Characterizing QT interval prolongation in early clinical development: a case study with methadone
- PMID: 28596836
- PMCID: PMC5461648
- DOI: 10.1002/prp2.284
Characterizing QT interval prolongation in early clinical development: a case study with methadone
Abstract
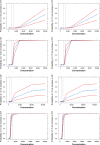
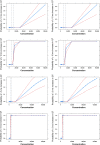
Recently, we have shown how pharmacokinetic-pharmacodynamic (PKPD) modeling can be used to assess the probability of QT interval prolongation both in dogs and humans. A correlation between species has been identified for a drug-specific parameter, making it possible to prospectively evaluate nonclinical signals. Here, we illustrate how nonclinical data on methadone can be used to support the evaluation of dromotropic drug effects in humans. ECG and drug concentration data from a safety pharmacology study in dogs were analyzed using nonlinear mixed effects modeling. The slope of the PKPD model describing the probability of QT interval prolongation was extrapolated from dogs to humans and subsequently combined with methadone pharmacokinetic data as input for clinical trial simulations. Concentration versus time profiles were simulated for doses between 5 and 500 mg. Predicted peak concentrations in humans were then used as reference value to assess the probability of an increase in QT interval of ≥5 and ≥10 ms. Point estimates for the slope in dogs suggested low probability of ≥10 ms prolongation in humans, whereas an effect of approximately 5 ms increase is predicted when accounting for the 90% credible intervals of the drug-specific parameter in dogs. Interspecies differences in drug disposition appear to explain the discrepancies between predicted and observed QT prolonging effects in humans. Extrapolation of the effects of racemic compound may not be sufficient to describe the increase in QT interval observed after administration of methadone to patients. Assessment of the contribution of enantioselective metabolism and active metabolites is critical.
Keywords: Clinical trial simulations; PKPD modeling; QT interval prolongation; methadone; translational pharmacology..
Figures


Similar articles
-
Translating QT interval prolongation from conscious dogs to humans.Br J Clin Pharmacol. 2017 Feb;83(2):349-362. doi: 10.1111/bcp.13123. Epub 2016 Oct 29. Br J Clin Pharmacol. 2017. PMID: 27614058 Free PMC article.
-
Model-based evaluation of drug-induced QTc prolongation for compounds in early development.Br J Clin Pharmacol. 2015 Jan;79(1):148-61. doi: 10.1111/bcp.12482. Br J Clin Pharmacol. 2015. PMID: 25099645 Free PMC article. Clinical Trial.
-
Assessment of Interspecies Differences in Drug-Induced QTc Interval Prolongation in Cynomolgus Monkeys, Dogs and Humans.Pharm Res. 2016 Jan;33(1):40-51. doi: 10.1007/s11095-015-1760-9. Epub 2015 Nov 9. Pharm Res. 2016. PMID: 26553352 Free PMC article.
-
Pharmacokinetic-pharmacodynamic modeling in the data analysis and interpretation of drug-induced QT/QTc prolongation.AAPS J. 2005 Oct 24;7(3):E609-24. doi: 10.1208/aapsj070363. AAPS J. 2005. PMID: 16353940 Free PMC article. Review.
-
The role of concentration-effect relationships in the assessment of QTc interval prolongation.Br J Clin Pharmacol. 2015 Jan;79(1):117-31. doi: 10.1111/bcp.12443. Br J Clin Pharmacol. 2015. PMID: 24938719 Free PMC article. Review.
References
-
- Bellanti F, Chain A, Danhof M, Della Pasqua O. Relevance of QT‐RR correlations in the assessment of QTc‐interval prolongation in clinical trial simulations, PAGE 20 (2011) (http://www.page-meeting.org/?abstract=2168; last accessed on 20/10/16).
-
- Brocks DR (2006). Drug disposition in three dimensions: an update on stereoselectivity in pharmacokinetics. Biopharm Drug Dispos. 27: 387–406. - PubMed
-
- Cavero I, Holzgrefe H (2015). CiPA: ongoing testing, future qualification procedures, and pending issues. J Pharmacol Toxicol Methods 76: 27–37. - PubMed
-
- Chain AS, Krudys KM, Danhof M, Della Pasqua O (2011). Assessing the probability of drug‐induced QTc‐interval prolongation during clinical drug development. Clin Pharmacol Ther 90: 867–75. - PubMed
LinkOut - more resources
Full Text Sources
Other Literature Sources

