. 2017 Aug;134(1):29-40.
doi: 10.1007/s11060-017-2507-8. Epub 2017 Jun 9.

Epithelial membrane protein-2 (EMP2) promotes angiogenesis in glioblastoma multiforme

Affiliations

Epithelial membrane protein-2 (EMP2) promotes angiogenesis in glioblastoma multiforme

Yu Qin et al. J Neurooncol. 2017 Aug.

Abstract

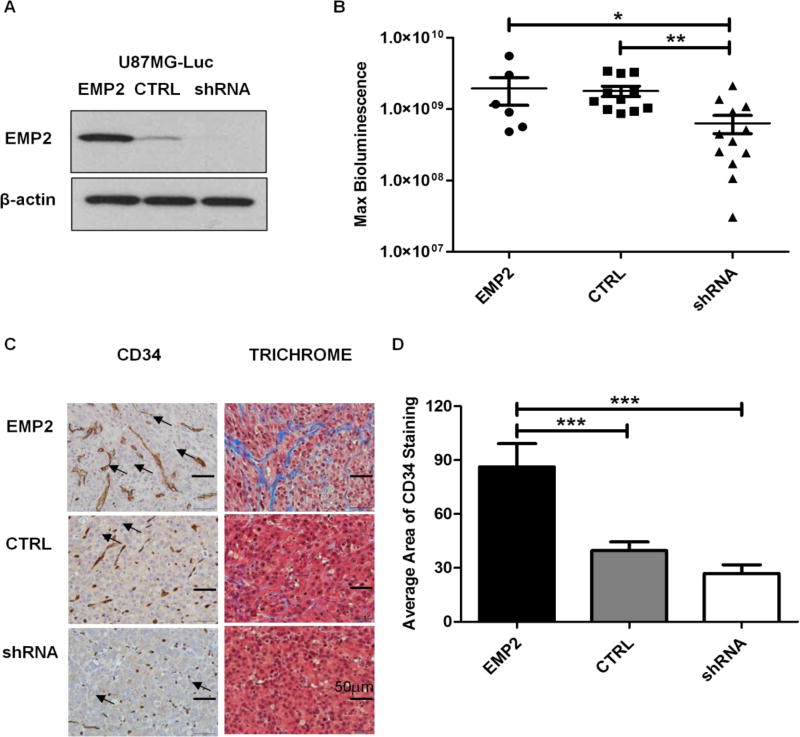
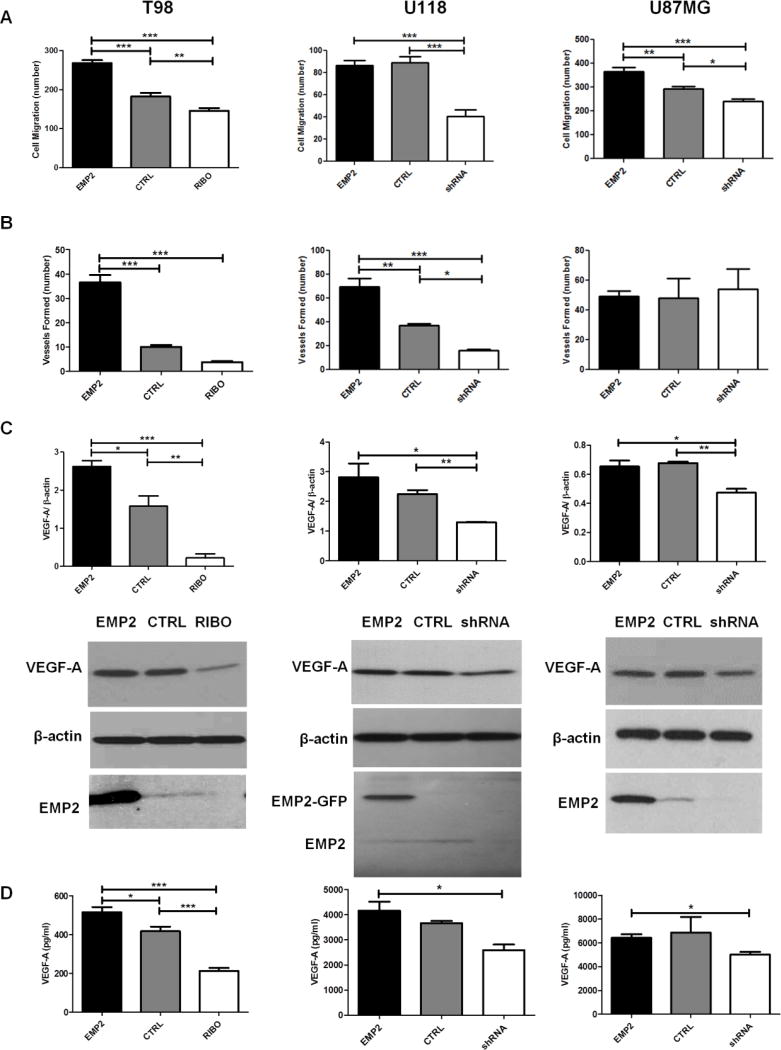
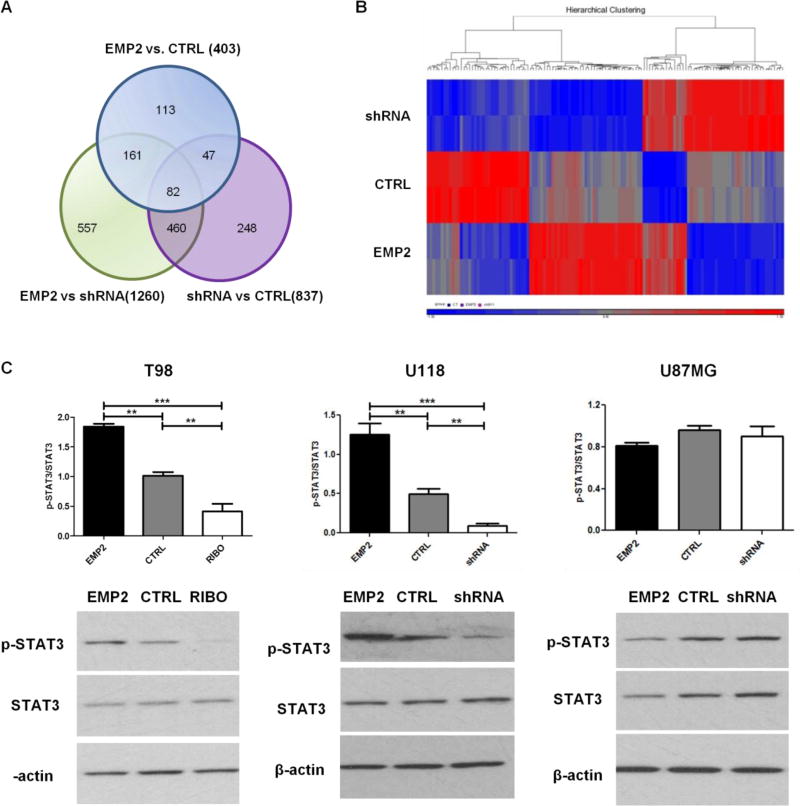
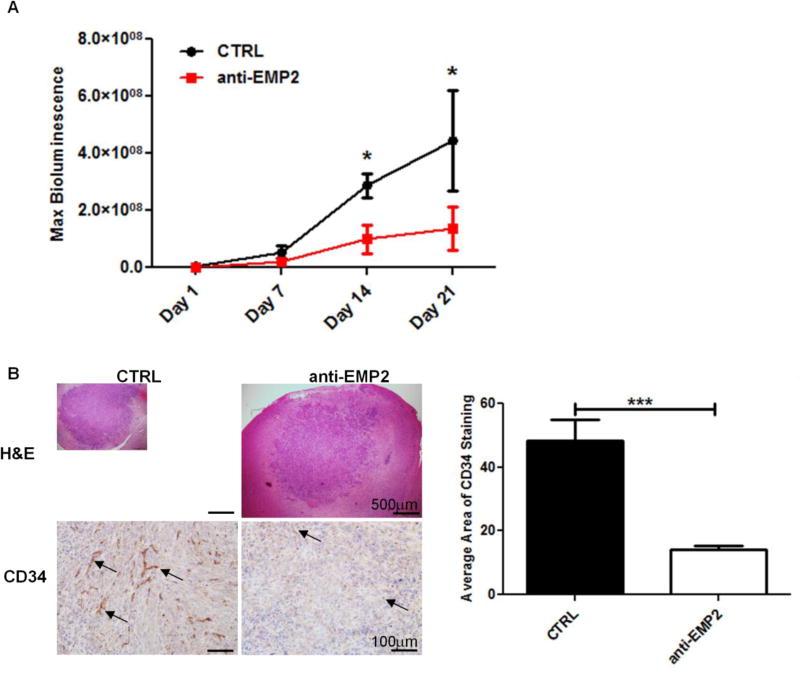
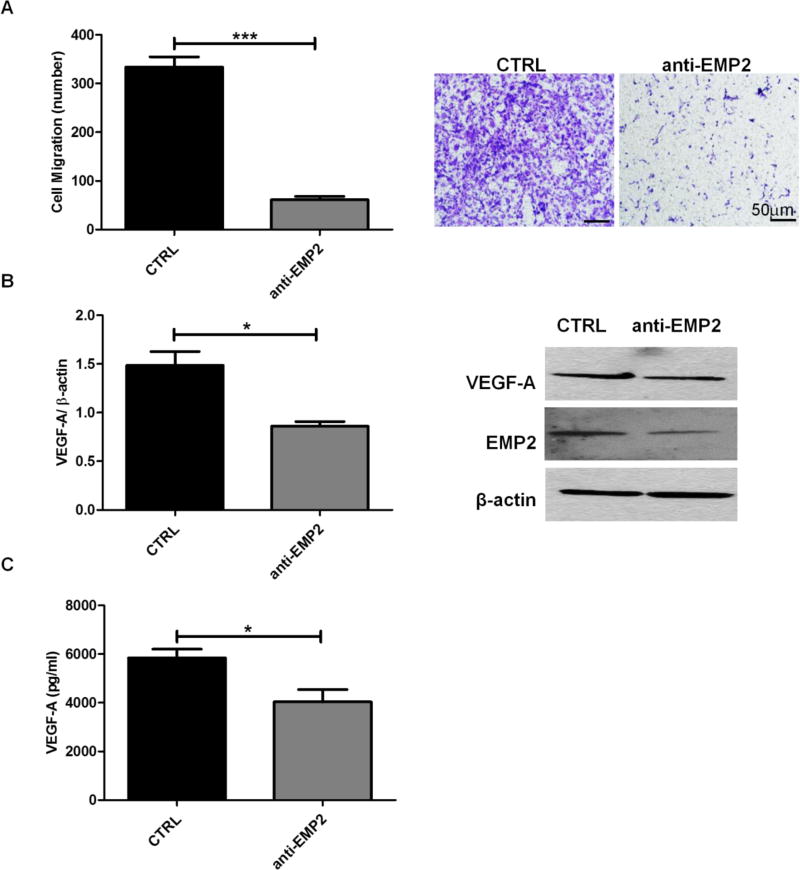
Glioblastoma multiforme (GBM) is the most aggressive malignant brain tumor and is associated with an extremely poor clinical prognosis. One pathologic hallmark of GBM is excessive vascularization with abnormal blood vessels. Extensive investigation of anti-angiogenic therapy as a treatment for recurrent GBM has been performed. Bevacizumab, a monoclonal anti-vascular endothelial growth factor A (VEGF-A), suggests a progression-free survival benefit but no overall survival benefit. Developing novel anti-angiogenic therapies are urgently needed in controlling GBM growth. In this study, we demonstrate tumor expression of epithelial membrane protein-2 (EMP2) promotes angiogenesis both in vitro and in vivo using cell lines from human GBM. Mechanistically, this pro-angiogenic effect of EMP2 was partially through upregulating tumor VEGF-A levels. A potential therapeutic effect of a systemic administration of anti-EMP2 IgG1 on intracranial xenografts was observed resulting in both significant reduction of tumor load and decreased tumor vasculature. These results suggest the potential for anti-EMP2 IgG1 as a promising novel anti-angiogenic therapy for GBM. Further investigation is needed to fully understand the molecular mechanisms how EMP2 modulates GBM pathogenesis and progression and to further characterize anti-EMP2 therapy in GBM.

Keywords: Angiogenesis; EMP2; GBM; Immunotherapy.


Conflict of interest statement

Conflicts of interests:

M.W., L.K.G, and J.B. are inventors on the University of California patents related to the anti- EMP2 IgG1 antibody presented in this work. They are also founders of Paganini Biopharma. No other authors have competing interests.

Figures

FIG 1
FIG 1. EMP2 Promotes Angiogenesis in U87MG Intracranial Tumors
(A) EMP2 levels were validated among the U87MG/Luc panel by Western Blots prior to stereotactic implantation. (B) Intracranial tumor growth was monitored by bioluminescence imaging on day 18 post tumor implantations in mice bearing U87MG/EMP2 (n=6), U87MG/CTRL (n=11) or U87MG/shRNA (n=12). The numbers of animals per group was generated by pooling two independent trials. (C) Intracranial tumors were fixed and stained with CD34 (left) and trichrome (right) and representative images were taken with a bright field microscope under 400× magnification. Arrowheads indicate representative staining of tumor associated vasculature. (D) Automated quantification of CD34 staining among groups was determined by NIH Image J software with a custom macro script as detailed in methods. One-way analysis of variance with a Bonferroni post-test was calculated to determine the difference among three groups. Significance was defined as *p<0.05, ** p<0.001, *** p<0.0001.
FIG 2
FIG 2. EMP2 Potentiates HUVEC Migration and Tube Formation and Increases VEGF-A Expression and Secretion in vitro
T98, U118 or U87MG cells with different levels of EMP2 were cultured for 48 hours and conditioned media were collected at the end of incubation. (A) HUVEC migration assay and (B) capillary tube formation were performed as described in methods. Migratory cell numbers were averaged by counting four random fields per transwell under 400× magnification using a bright field microscope with the averaged results presented. Tube formation was evaluated under a fluorescent microscope and all fully formed tubes were counted on the entire cover slips. The experiment was repeated three times, and the averaged results presented. (C) T98, U118 or U87MG cells with different levels of EMP2 were cultured for 48 hours and cells were lysed to evaluate VEGF-A expression by Western Blots. Quantification of VEGF-A expression normalized by β-actin were determined by NIH Image J software (top) and representative images of Western Blots show the expression of VEGF-A, EMP2, or β-actin (bottom). (D) T98, U118 or U87MG with different levels of EMP2 were cultured for 48 hours and conditioned media were collected at the end of incubation. Secreted VEGF-A levels in conditioned media were examined by VEGF-A ELISA. The experiments were performed in triplicate or duplicate and repeated at least three times. One-way analysis of variance with a Bonferroni post-test was calculated to determine the difference among three groups. Significance was not reached in U87MG panel by one-way analysis of variance, a student’s t test was performed between U87MG/EMP2 and U87/shRNA. Significance was defined as *p<0.05, ** p<0.001, *** p<0.0001.
FIG 3
FIG 3. U118 Affymetrix RNA Microarray and EMP2 Regulates STAT3 in Some GBM Cells
RNA was extracted from U118/EMP2, U118/CTRL or U118/shRNA. Affymetrix U133 plus 2.0 microarrays were performed in duplicate and the average of two samples was taken. The relative abundance of specific gene expression was determined among groups. (A) Gene expression was detailed between groups in a Venn diagram. (B) 129 genes were expressed more than 1.5 fold between groups and heat map analysis displayed the differential gene profiling hierarchy among three groups using R software. (C) T98, U118 or U87MG cells with different levels of EMP2 were cultured for 48 hours and cells were lysed to evaluate total STAT3 expression as well as STAT3 phosphorylation at Y705 by Western Blots. Quantification of STAT3 phosphorylation normalized by total STAT3 expression were determined by NIH Image J software (top) and representative images of Western Blots showed the expression of p-STAT3, STAT3 or β-actin (bottom). The experiments were repeated at least three times. One-way analysis of variance with a Bonferroni post-test was calculated to determine the difference among three groups. Significance was defined as ** p<0.001, *** p<0.0001.
FIG 4
FIG 4. Anti-EMP2 Reduces Intracranial U87MG/EMP2 Tumor Load and Angiogenesis
U87MG/EMP2/Luc cells were stereotactically implanted into athymic nude mice. From day 1, mice were intraperitoneally injected with either control vehicle saline (n=5) or anti-EMP2 IgG1 antibody (n=6) twice a week for three weeks. (A) Bioluminescence images were captured on days 1, 7, 14 and 21 post tumors implantation to monitor tumor growth. A two-way analysis of variance was used to determine the difference between control and anti-EMP2 antibody treatment groups within the treatment time course. (B) Representative histological images (left, top) and CD34 staining (left, bottom) of intracranial tumors from two groups were displayed under 40× and 200× magnification, respectively, and staining was automated quantification using NIH Image J software with a custom macro script were examined (right). Student’s t test was used to determine the difference between the two groups. Significance defined as *p<0.05, *** p<0.0001.
FIG 5
FIG 5. Anti-EMP2 Decreases HUVEC Migration and VEGF-A Expression and Secretion
U87MG wild type cells were cultured in the presence of anti-EMP2 antibody (n=4) or a vehicle (saline) control (n=3) for 48 hours. (A) Conditioned media were collected at the end of incubation for HUVEC migration assay. Migratory cell numbers were averaged by counting four random fields per transwell (left) and representative images of migratory cells were shown under 400× magnification (right). (B) Quantification of VEGF-A expression normalized by β-actin were determined by NIH Image J software (left) and representative images of Western Blots show the expression of VEGF-A, EMP2, or β-actin (right). (C) Quantification of cell-secreted VEGF-A levels were determined by ELISA. The experiments were repeated at least three times. Student’s t test was used to determine the difference between the two groups. Significance was defined as *p<0.05, *** p<0.0001.

References

    1. Dolecek TA, Propp JM, Stroup NE, Kruchko C. CBTRUS statistical report: primary brain and central nervous system tumors diagnosed in the United States in 2005–2009. Neuro Oncol. 2012;14(Suppl 5):v1–49. - PMC - PubMed
    1. Omuro A, DeAngelis LM. Glioblastoma and other malignant gliomas: a clinical review. JAMA. 2013;310:1842–1850. - PubMed
    1. Liebelt BD, et al. Glioma Stem Cells: Signaling, Microenvironment, and Therapy. Stem Cells Int. 2016;2016:7849890. - PMC - PubMed
    1. Ricci-Vitiani L, et al. Tumour vascularization via endothelial differentiation of glioblastoma stem-like cells. Nature. 2010;468:824–828. - PubMed
    1. Wang R, et al. Glioblastoma stem-like cells give rise to tumour endothelium. Nature. 2010;468:829–833. - PubMed

MeSH terms