

Inflammation in the developing rat modulates astroglial reactivity to seizures in the mature brain
- PMID: 28597918
- PMCID: PMC5554830
- DOI: 10.1111/joa.12636
Inflammation in the developing rat modulates astroglial reactivity to seizures in the mature brain
Abstract
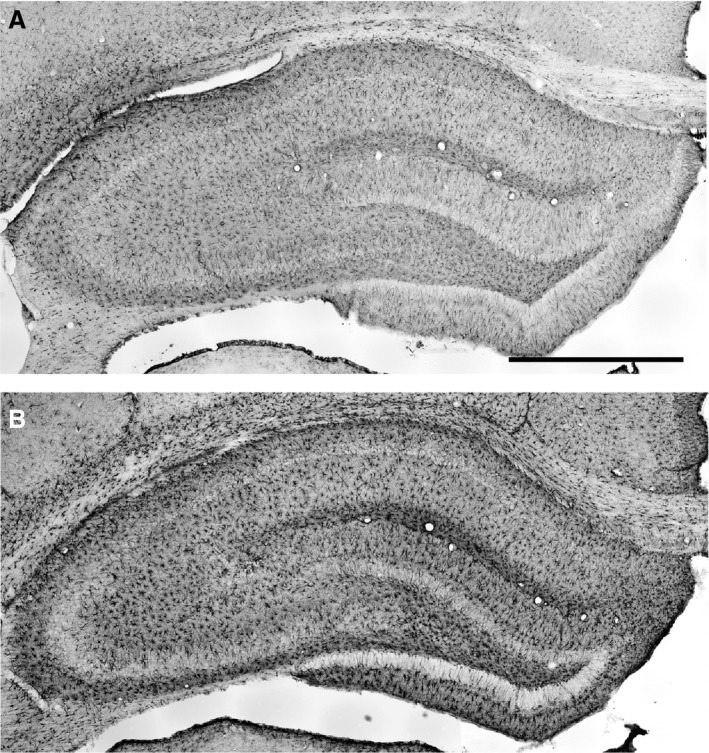
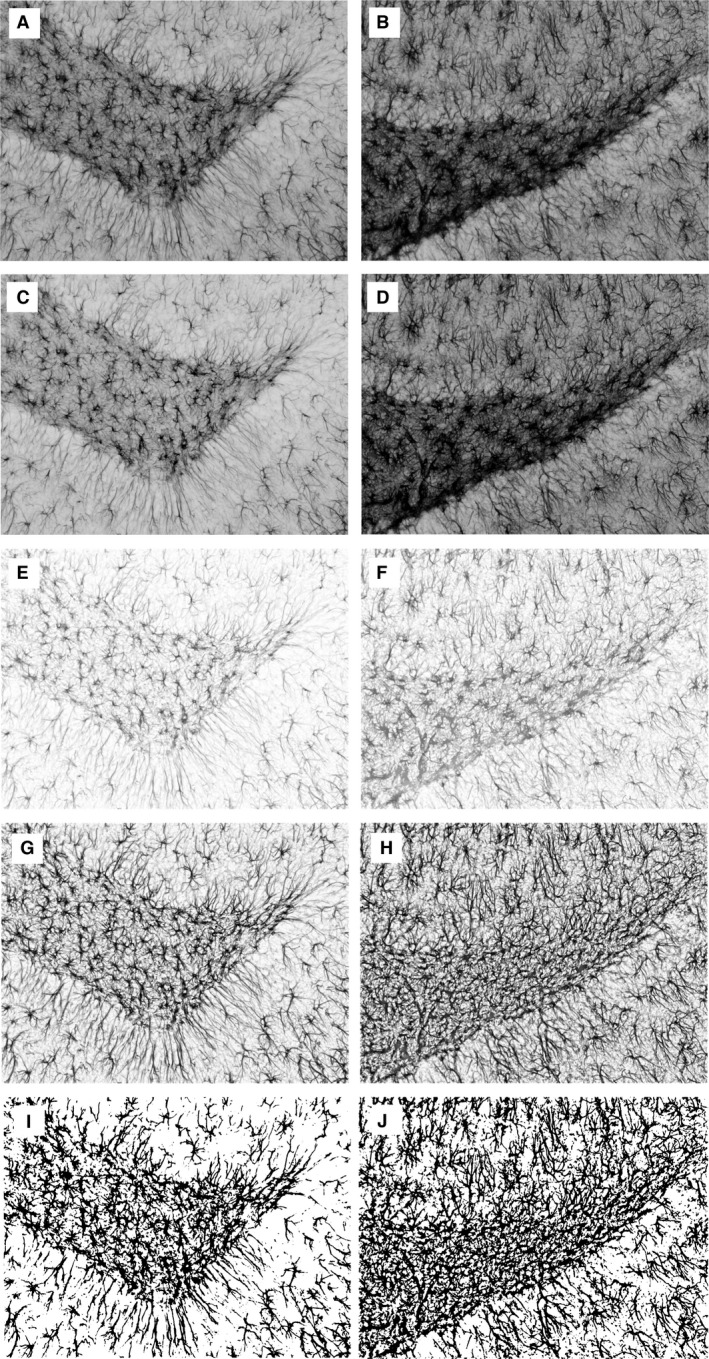
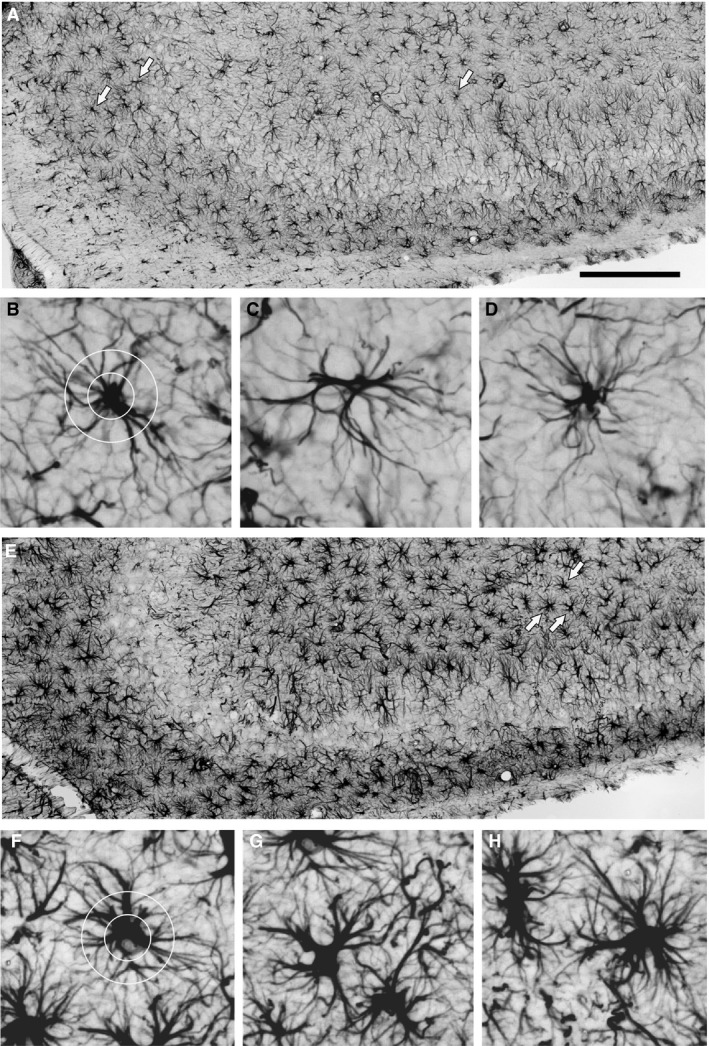
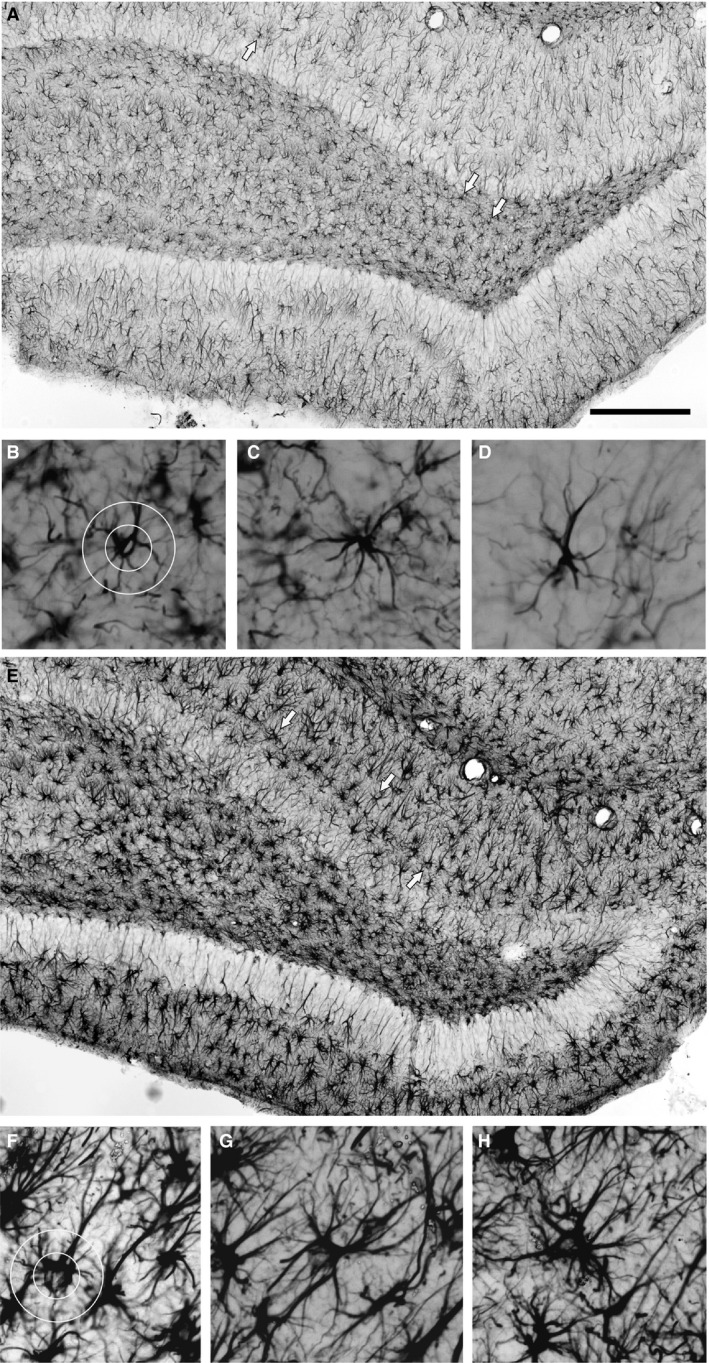
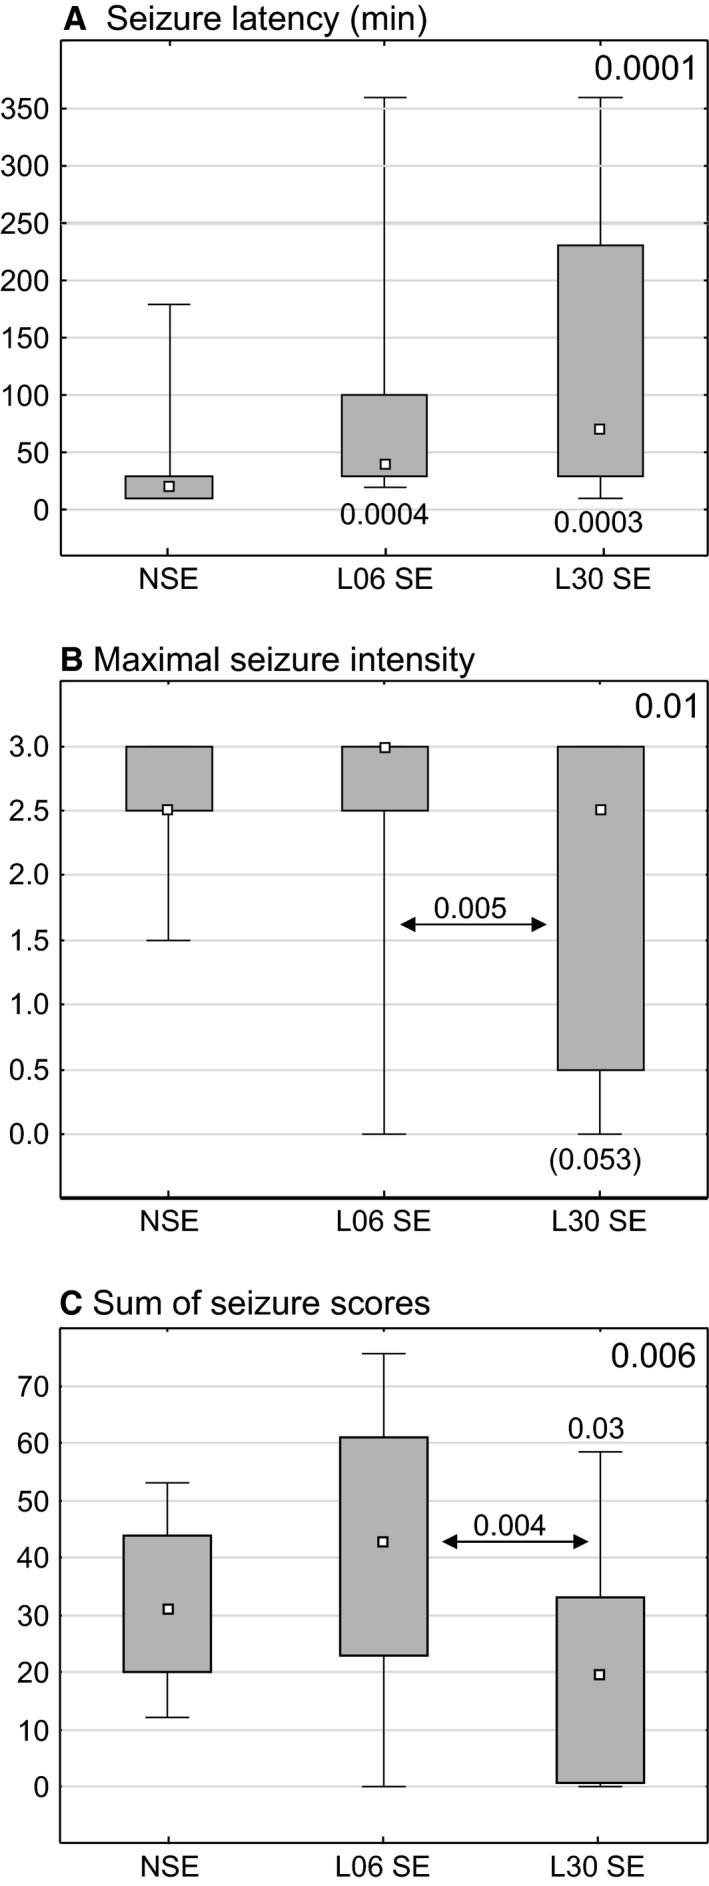
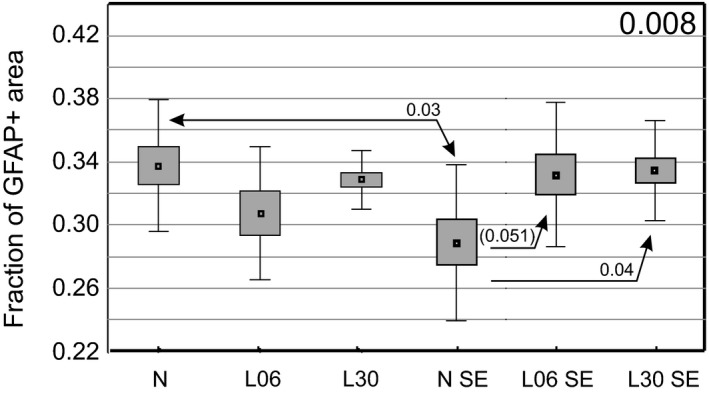
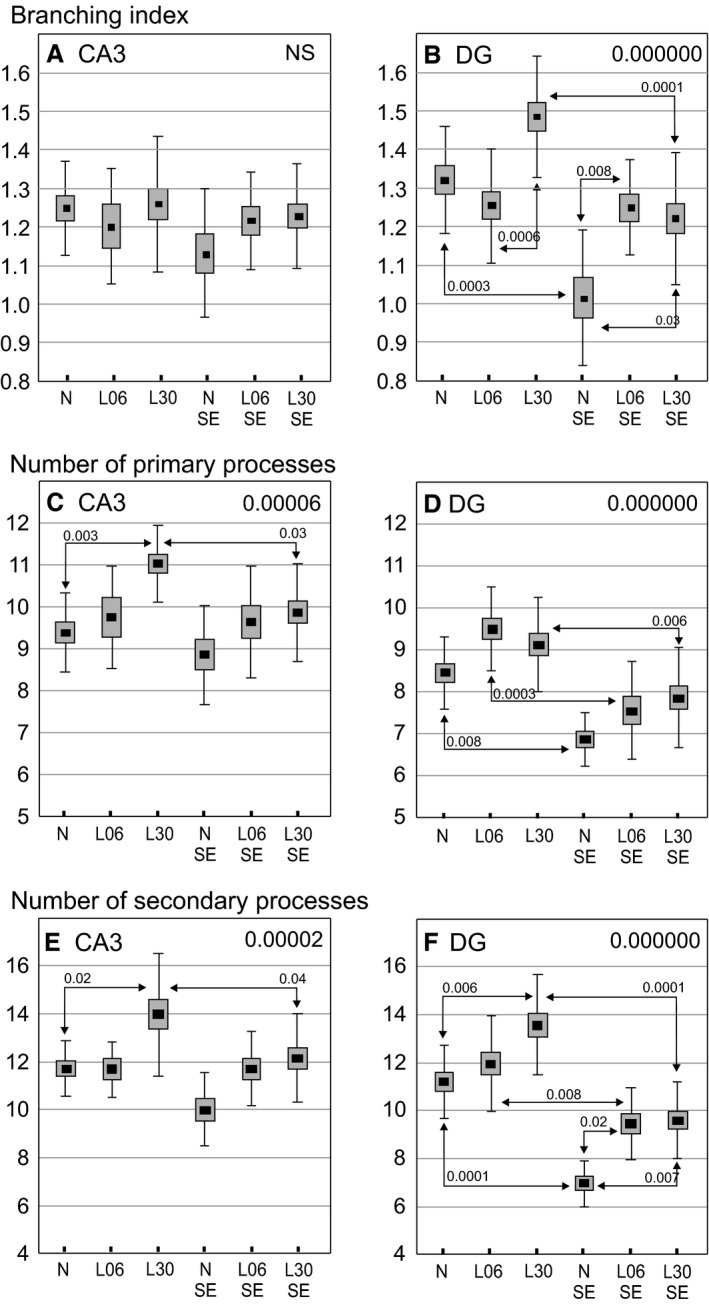
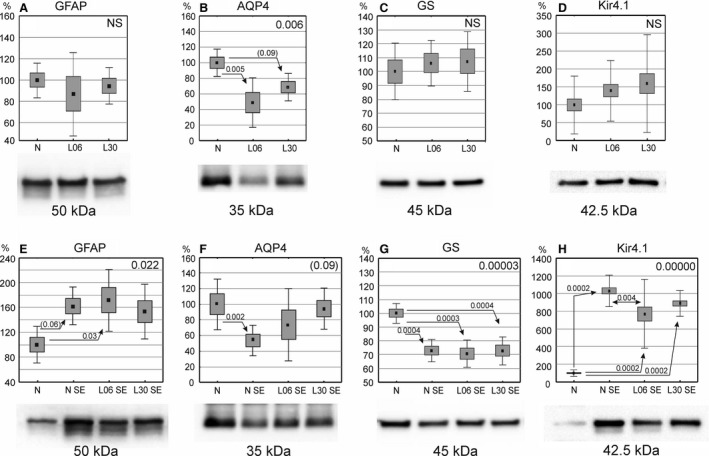
Astrocytes participate in neuronal development and excitability, and produce factors enhancing or suppressing inflammatory processes occurring due to neurodegenerative diseases, such as epilepsy. Seizures, in turn, trigger the release of inflammatory mediators, causing structural and functional changes in the brain. Therefore, it appears reasonable to determine whether generalized inflammation at developmental periods can affect astrocyte reactivity to epileptic seizures occurring in the adult brain. Lipopolysaccharide (LPS) was injected in 6- or 30-day-old rats (P6 or P30, respectively). At the age of 2 months, seizures were induced, and pilocarpine and morphological changes of astrocytes located within the hippocampal formation were assessed. Additionally, expression of glial fibrillary acidic protein (GFAP), glutamine synthetase (GS), aquaporin 4 (AQP4), and inwardly rectifying potassium channel Kir 4.1 (Kir4.1) was determined using Western blots. The animal group given LPS on P6 displayed maximal susceptibility to pilocarpine-induced seizures, significantly higher than the group that received LPS on P30. In the immunohistologically examined hippocampal formation, the GFAP-immunoreactive area was not affected by LPS alone. However, it was reduced following seizures in naïve controls but not in LPS-pretreated rats. Increases in the ramification of astrocytic processes were detected only in adult rats given LPS on P30, not on P6. Seizures abolished the effects. Following seizures, the process ramification showed no significant change in the two LPS-treated rat groups, whereas it was significantly reduced in the dentate gyrus of LPS-untreated controls. Glial fibrillary acidic protein (GFAP) expression showed no changes induced with LPS alone and rose slightly after seizures. AQP4 content was lower in rats given LPS on P6 and was seizure-resistant in the two LPS-treated groups, contrary to a decrease in untreated controls. GS expression was not affected by LPS treatments and was reduced after seizures without an intergroup difference. Kir4.1 underwent highly significant increases in all groups experiencing seizures, but LPS alone had no effect. It can be concluded that the generalized inflammatory status led to some important changes in astrocytes reflected, in part at least by permanent modifications of their morphology and molecular profile. Moreover, the previously experienced inflammation prevented the cells from much stronger changes in response to seizures observed in adult untreated controls. The obtained results point to a link between the activation of astrocytes by transient systemic inflammation occurring during the developmental period and their subsequent reactivity to seizures, which may play an important role in the functional features of the brain, including its susceptibility to seizures.
Keywords: GFAP; astrocyte; cell morphology; epilepsy; lipopolysaccharide.
© 2017 Anatomical Society.
Figures
Similar articles
-
Inflammation induced at different developmental stages affects differently the range of microglial reactivity and the course of seizures evoked in the adult rat.Epilepsy Behav. 2015 Aug;49:66-70. doi: 10.1016/j.yebeh.2015.04.063. Epub 2015 May 16. Epilepsy Behav. 2015. PMID: 25989877
-
Effects of dexamethasone on the Li-pilocarpine model of epilepsy: protection against hippocampal inflammation and astrogliosis.J Neuroinflammation. 2018 Mar 5;15(1):68. doi: 10.1186/s12974-018-1109-5. J Neuroinflammation. 2018. PMID: 29506554 Free PMC article.
-
Volumetric response of the adult brain to seizures depends on the developmental stage when systemic inflammation was induced.Epilepsy Behav. 2018 Jan;78:280-287. doi: 10.1016/j.yebeh.2017.09.009. Epub 2017 Nov 8. Epilepsy Behav. 2018. PMID: 29128467
-
Glutamine synthetase in brain: effect of ammonia.Neurochem Int. 2002 Aug-Sep;41(2-3):123-42. doi: 10.1016/s0197-0186(02)00033-5. Neurochem Int. 2002. PMID: 12020613 Review.
-
Seizures and the regulation of astroglial gene expression.Epilepsy Res Suppl. 1992;7:197-209. Epilepsy Res Suppl. 1992. PMID: 1334663 Review.
Cited by
-
Analysis of Both Lipid Metabolism and Endocannabinoid Signaling Reveals a New Role for Hypothalamic Astrocytes in Maternal Caloric Restriction-Induced Perinatal Programming.Int J Mol Sci. 2021 Jun 11;22(12):6292. doi: 10.3390/ijms22126292. Int J Mol Sci. 2021. PMID: 34208173 Free PMC article.
-
Kir4.1 may represent a novel therapeutic target for diabetic retinopathy (Review).Exp Ther Med. 2021 Sep;22(3):1021. doi: 10.3892/etm.2021.10453. Epub 2021 Jul 15. Exp Ther Med. 2021. PMID: 34373707 Free PMC article. Review.
-
Advances in the Potential Biomarkers of Epilepsy.Front Neurol. 2019 Jul 2;10:685. doi: 10.3389/fneur.2019.00685. eCollection 2019. Front Neurol. 2019. PMID: 31312171 Free PMC article. Review.
-
Seizures in PPT1 Knock-In Mice Are Associated with Inflammatory Activation of Microglia.Int J Mol Sci. 2022 May 17;23(10):5586. doi: 10.3390/ijms23105586. Int J Mol Sci. 2022. PMID: 35628400 Free PMC article.
-
Immune Challenges and Seizures: How Do Early Life Insults Influence Epileptogenesis?Front Pharmacol. 2020 Feb 4;11:2. doi: 10.3389/fphar.2020.00002. eCollection 2020. Front Pharmacol. 2020. PMID: 32116690 Free PMC article. Review.
References
-
- Bayer SA, Altman J, Russo RJ, et al. (1993) Timetables of neurogenesis in the human brain based on experimentally determined patterns in the rat. Neurotoxicology 14, 83–144. - PubMed
-
- Ben‐Ari Y, Cossart R (2000) Kainate, a double agent that generates seizures: two decades of progress. Trends Neurosci 23, 580–587. - PubMed
-
- Binder DK, Nagelhus EA, Ottersen OP (2012) Aquaporin‐4 and epilepsy. Glia 8, 1203–1214. - PubMed
MeSH terms
Substances
LinkOut - more resources
Full Text Sources
Other Literature Sources
Medical
Research Materials
Miscellaneous
