. 2017 Jun 9:6:e26437.
doi: 10.7554/eLife.26437.

A novel twelve class fluctuation test reveals higher than expected mutation rates for influenza A viruses

Affiliations

A novel twelve class fluctuation test reveals higher than expected mutation rates for influenza A viruses

Matthew D Pauly et al. Elife. .

Abstract

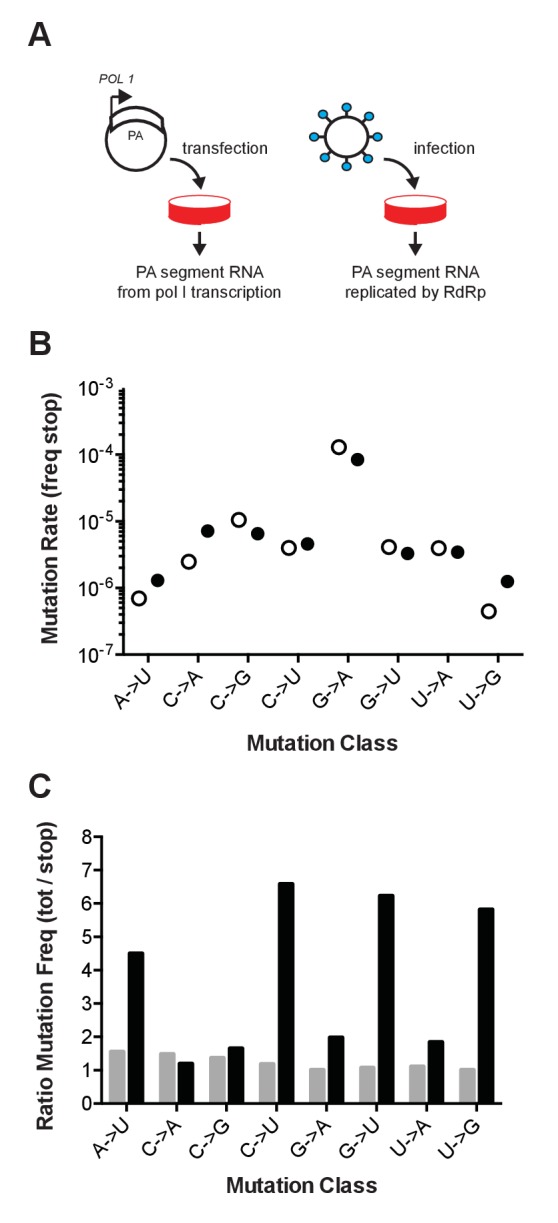
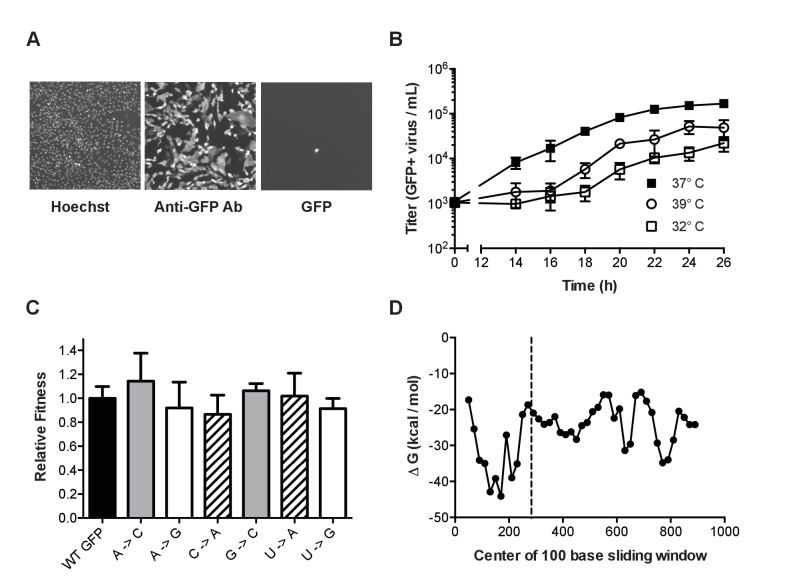
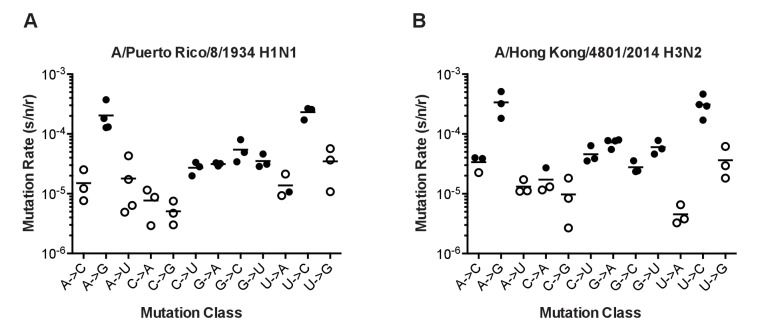
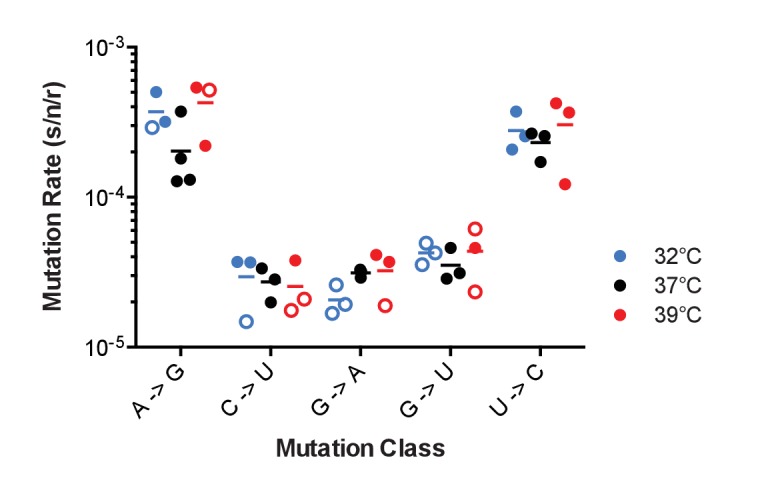
Influenza virus' low replicative fidelity contributes to its capacity for rapid evolution. Clonal sequencing and fluctuation tests have suggested that the influenza virus mutation rate is 2.7 × 10⁻⁶ - 3.0 × 10⁻⁵ substitutions per nucleotide per strand copied (s/n/r). However, sequencing assays are biased toward mutations with minimal fitness impacts and fluctuation tests typically investigate only a subset of all possible single nucleotide mutations. We developed a fluctuation test based on reversion to fluorescence in a set of virally encoded mutant green fluorescent proteins, which allowed us to measure the rates of selectively neutral mutations representative of the twelve different mutation types. We measured an overall mutation rate of 1.8 × 10⁻⁴ s/n/r for PR8 (H1N1) and 2.5 × 10⁻⁴ s/n/r for Hong Kong 2014 (H3N2) and a transitional bias of 2.7-3.6. Our data suggest that each replicated genome will have an average of 2-3 mutations and highlight the importance of mutational load in influenza virus evolution.

Keywords: diversity; evolution; evolutionary biology; genomics; infectious disease; microbiology; mutation rate; virus.


Conflict of interest statement

The authors declare that no competing interests exist.

Figures

Figure 1.
Figure 1.. Influenza mutation rates by PrimerID next generation sequencing.
(A) Segment 3 (PA) RNA was isolated from either cells transfected with pol I expression plasmids or cell-free supernatants of cells infected with influenza virus. These RNA were reverse transcribed with barcoded PrimerID primers and amplified by PCR for sequencing as described in the methods. We obtained 449,655 PrimerID consensus sequences for the plasmid-derived RNA sample and 481,286 consensus sequences for the virus-derived RNA sample. (B) The frequencies of mutations to stop codons in pol I transcribed RNA (open circles) and virus-derived RNA (filled circles) were determined by dividing the number of stop codon mutations across the consensus sequences by the total number of nonsense mutation target (NSMT) sites analyzed. Plotted data are in Figure 1—source data 1. See also Supplementary file 1. (C) Total mutation frequencies were calculated as the number of observed mutations for a particular mutation class divided by the number of sequenced sites that could mutate by that same class. Shown is the ratio of total mutation frequency to stop codon mutation frequency by mutation class for sequences derived from plasmid-derived RNA (grey bars) and virus-derived RNA (black bars). Plotted data are in Figure 1—source data 2. DOI: http://dx.doi.org/10.7554/eLife.26437.002
Figure 2.
Figure 2.. Characterization of mutant ΔHA-GFP influenza viruses.
(A) Fluorescent images of cells infected with mutant ΔHA-GFP (shown are data for the A to C virus, see Table 1) and stained with Hoechst and anti-GFP Alexa 647 conjugate. Cells were imaged at 4x magnification and the resulting images were digitally magnified to an equal extent for this figure. (B) Growth kinetics of mutant ΔHA-GFP viruses. MDCK-HA cells were infected at an MOI of 0.01 in 96-well plates and incubated at 32°C (open squares), 37°C (filled squares), or 39°C (open circles). At each time point, the supernatants from 4 wells were transferred to a new 96-well plate containing MDCK cells. After 14 hr the cells were fixed and stained using an anti-GFP antibody. The number of cells stained were determined by fluorescence microscopy and used to calculate the titer of GFP expressing virus. Data shown are the cumulative mean and standard deviations for 4 measurements at each time point for each of two mutant ΔHA-GFP viruses (C to U and U to A viruses). Each point is the therefore the mean ± standard deviation for 8 values. Plotted data are in Figure 2—source data 1. (C) The fitness of 6 of the mutant ΔHA-GFP viruses (x-axis) were compared to wild type ΔHA-GFP through direct competition with a genetically barcoded competitor over 4 serial passages. Quantitative PCR was used to determine the relative changes in the frequency of the two competitors and fitness values were calculated as described in the Methods. Mutant viruses are classified by the GFP amino acid mutated, with wild type (black), T65 (gray), Y66 (striped), G67 (white). Shown are the mean and standard deviation for three competitions and fitness measurements for each virus. Plotted data are in Figure 2—source data 2. (D) The minimum free energy of RNA folding for 100 base sliding windows (80 base overlaps) were determined for the ΔHA-GFP construct. The location of the three mutated sites (bases 280–288) are indicated by the dashed line. Plotted data are in Figure 2—source data 3. DOI: http://dx.doi.org/10.7554/eLife.26437.006
Figure 3.
Figure 3.. Fluorescent Luria-Delbruck fluctuation test.
(A) General workflow for measuring the mutation rate using mutant ΔHA-GFP viruses. Parallel cultures of MDCK-HA cells were infected with passage one stocks of mutant ΔHA-GFP viruses at low multiplicity. The time for initial replication was varied to allow for a number of replicated viruses and revertants adequate to measure the mutation rate for a given class. Supernatants were transferred to 96-well plates of MDCK cells and incubated for 14 hr to allow for infection and GFP expression in target cells. The mutation rate for each mutant ΔHA-GFP virus and class was calculated as described in the methods and text based on the initial and final titer (Ni and Nf, anti-GFP positive infected cells) and proportion of cultures with no revertants (P0, wells without green fluorescence). (B–D) Specificity of the reversion to fluorescence assay. The (B) A to G, (C) G to A, and (D) G to C mutation rates for A/Puerto Rico/8/1934 H1N1 were measured at 37°C in cells pretreated with 0.625 μM 5-azacytidine (AzaC), 15 μM 5-fluorouracil (5 FU), or 2.5 μM ribavirin (Riba). No data are shown for G to C with 2.5 μM ribavirin because large titer decreases upon drug treatment prohibited measurements. Filled symbols represent measurements in which P0 is between 0.1 and 0.69, where the assay is most precise. Open circles represent data with P0 between 0.7 and 0.9. Arithmetic means are indicated. A one-way ANOVA with a Dunnett’s correction for multiple comparisons was used for each mutation class to compare each drug treatment to no drug treatment. *p<0.05, **p<0.01, ***p<0.005. Plotted data are in Figure 3—source data 1. DOI: http://dx.doi.org/10.7554/eLife.26437.010
Figure 4.
Figure 4.. The mutation rates of influenza viruses replicated at 37°C.
(A) Measurements of A/Puerto Rico/8/1934 H1N1 viruses encoding the 12 different mutant ΔHA-GFP constructs. (B) Measurements of viruses encoding the replication complex (PB2, PB1, PA, and NP) from A/Hong Kong/4801/2014 H3N2 and the remaining genes coming from A/Puerto Rico/8/1934 H1N1. Filled symbols represent measurements in which P0 is between 0.1 and 0.69. Open circles represent data with P0 between 0.7 and 0.95. Plotted data are in Figure 4—source data 1. Raw counts of green cells in positive wells for Hong Kong viruses are in Figure 4—source data 2. The arithmetic means are indicated on the graphs and the means and standard deviations reported in Supplementary file 2. DOI: http://dx.doi.org/10.7554/eLife.26437.012
Figure 5.
Figure 5.. The effect of temperature on influenza A virus mutation rates.
Mutation rates were determined for A/Puerto Rico/8/1934 H1N1 viruses encoding the indicated mutant ΔHA-GFP constructs replicated at 32°C (blue), 37°C (black) and 39°C (red). Filled symbols represent measurements in which P0 is between 0.1 and 0.69. Open circles represent data with P0 between 0.7 and 0.90. The arithmetic means are indicated. A two-way ANOVA revealed no significant differences in mutation rates based upon temperature. Plotted data are in Figure 5—source data 1. DOI: http://dx.doi.org/10.7554/eLife.26437.015

Comment in

Similar articles

Cited by

References

    1. Acevedo A, Brodsky L, Andino R. Mutational and fitness landscapes of an RNA virus revealed through population sequencing. Nature. 2014;505:686–690. doi: 10.1038/nature12861. - DOI - PMC - PubMed
    1. Aggarwal S, Bradel-Tretheway B, Takimoto T, Dewhurst S, Kim B. Biochemical characterization of enzyme fidelity of influenza A virus RNA polymerase complex. PLoS One. 2010;5:e10372. doi: 10.1371/journal.pone.0010372. - DOI - PMC - PubMed
    1. Anderson JP, Daifuku R, Loeb LA. Viral error catastrophe by mutagenic nucleosides. Annual Review of Microbiology. 2004;58:183–205. doi: 10.1146/annurev.micro.58.030603.123649. - DOI - PubMed
    1. Baranovich T, Wong SS, Armstrong J, Marjuki H, Webby RJ, Webster RG, Govorkova EA. T-705 (favipiravir) induces lethal mutagenesis in influenza A H1N1 viruses in vitro. Journal of Virology. 2013;87:3741–3751. doi: 10.1128/JVI.02346-12. - DOI - PMC - PubMed
    1. Bass BL. RNA editing by adenosine deaminases that act on RNA. Annual Review of Biochemistry. 2002;71:817–846. doi: 10.1146/annurev.biochem.71.110601.135501. - DOI - PMC - PubMed

Publication types

Substances