. 2017 Jun 9:8:15732.
doi: 10.1038/ncomms15732.

Tespa1 regulates T cell receptor-induced calcium signals by recruiting inositol 1,4,5-trisphosphate receptors

Affiliations

Tespa1 regulates T cell receptor-induced calcium signals by recruiting inositol 1,4,5-trisphosphate receptors

Jingjing Liang et al. Nat Commun. .

Erratum in

Abstract

Thymocyte-expressed, positive selection-associated 1 (Tespa1) is important in T cell receptor (TCR)-driven thymocyte development. Downstream of the TCR, Tespa1 is a crucial component of the linker for activation of T cells (LAT) signalosome, facilitating calcium signalling and subsequent MAPK activation. However, it is unknown how Tespa1 elicits calcium signalling. Here, we show that inositol 1,4,5-trisphosphate receptor type 1 (IP3R1) is crucial for Tespa1-optimized, TCR-induced Ca2+ flux and thymocyte development. Upon TCR stimulation, Tespa1 directly interacts with IP3R1 and recruits it to the TCR complex, where IP3R1 is phosphorylated at Y353 by Fyn. This Tespa1-IP3R1 interaction is mediated by the F187 and F188 residues of Tespa1 and the amino-terminus of IP3R1. Tespa1-F187A/F188A mutant mice phenocopy Tespa1-deficient mice with impaired late thymocyte development due to reduced IP3R1 translocation to the TCR-proximal region. Our work elucidates the function of Tespa1 in T cell development and the regulation of TCR-induced Ca2+ signalling through IP3R1.


Conflict of interest statement

The authors declare no competing financial interests.

Figures
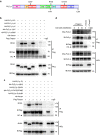
Figure 1
Figure 1. Association of PLC-γ1 and Tespa1.
(a) Schematic of the functional domains of PLC-γ1. (b) Immunoblot analysis (IB) of HEK293 cells co-transfected with Flag-tagged Tespa1 and HA-tagged full-length PLC-γ1 (FL) or its mutants. Cells were lysed, immunoprecipitated (IP) with anti-Flag beads, and probed with anti-Flag and anti-HA. Bottom, immunoblot analysis of whole-cell lysates (WCL, without immunoprecipitation). HC, heavy chain. (c) HA-tagged full-length PLC-γ1 (FL) or PLC-γ1 with a point mutation in the X catalytic domain, cSH2 domain or Y catalytic domain was co-expressed and analysed for interaction with Tespa1. (d) Immunoblot analysis of Jurkat cells transfected with Flag-tagged Tespa1 (J-Tespa1) or Flag empty vector (J-Vector). Cells were left unstimulated (0) or were stimulated with anti-CD3 and anti-CD28 antibodies for 5 or 10 min, following by lysis, immunoprecipitation with anti-Flag beads and probing with anti-PLC-γ1 or anti-p-PLC-γ1 antibodies. Data are representative of at least three experiments.
Figure 2
Figure 2. Interaction between Tespa1 and IP3R1.
(a,b) Immunoblot analysis (IB) of HEK293 cells co-transfected with Flag-tagged full-length Tespa1 (FL) or different Tespa1 mutants and HA-tagged IP3R1-N-TM. Cells were lysed and immunoprecipitated (IP) with anti-Flag beads (a) or anti-HA antibodies plus protein G beads (b), then probed with anti-Flag and anti-HA antibodies. Bottom, immunoblot analysis of whole-cell lysates (WCL, without immunoprecipitation). (c) Immunoblot analysis of Jurkat cells transfected with Flag-tagged Tespa1 (J-Tespa1), Flag-tagged Tespa1-F187A/F188A (J-FFAA) or Flag empty vector (J-Vector). Cells were left unstimulated (0) or were stimulated with anti-CD3 and anti-CD28 antibodies for 5 or 10 min, lysed, immunoprecipitated with anti-Flag beads and probed with anti-IP3R1, anti-IP3R2 or anti-IP3R3 antibodies. Data are representative of at least three experiments.
Figure 3
Figure 3. Recruitment of IP3R1 to TCR-proximal region by Tespa1.
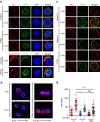
(a) Confocal microscopy images of J-Tespa1 and J-FFAA cells labelled with anti-LAT (red), anti-IP3R1 (green), and DAPI (blue) before (0 min) and after (5 min) stimulation with soluble anti-CD3 and anti-CD28 antibodies. Scale bar, 1 μm. (b) WT thymocytes before (0 min) and after (10 min) stimulation with anti-CD3 immobilized on coverslips were stained with anti-IP3R1 antibodies, and then a 4 μm Z-stack 3D display was taken from contacting coverslip by Structured illumination microscopy (SIM). Left, a view from side of contacting coverslip. Right, a view upright to Z-axis. (c) SIM images of thymocytes from Tespa1+/+ (+/+), Tespa1−/− (−/−) and Tespa1-FFAA (FFAA) mice labelled with anti-IP3R1 (green) and Alexa Fluor 647-conjugated anti-TCR β (red) before (0 min) and after (10 min) stimulation with immobilized anti-CD3 antibodies (10 μg ml−1). Scale bar, 1 μm. (d) Mean fluorescence intensity (MFI) of IP3R1 from SIM analysis as in b. Each symbol represents an individual cell; small horizontal lines indicate the mean±s.d. One-way ANOVA was performed with a P value included. *P<0.05, ***P<0.001, NS, not significant. Data are representative of at least three experiments.
Figure 4
Figure 4. Requirement of Tespa1 for Y353 phosphorylation of IP3R1.
(a) Confocal microscopy images of J-Tespa1 or J-FFAA cells labelled with anti-LAT (red), anti-IP3R1 phospho-Y353 (p-Y353, green) and DAPI (blue) before (0 min) and after (5 min) stimulation with soluble anti-CD3 and anti-CD28 antibodies. Scale bar, 1 μm. (b) Structured illumination microscopy (SIM) images of thymocytes from Tespa1+/+ (+/+), Tespa1−/− (−/−) and Tespa1-FFAA (FFAA) mice labelled with anti-IP3R1 phospho-Y353 (p-Y353, green) and Alexa Fluor 647-conjugated anti-TCR α/β (red) before (0 min) and after (10 min) stimulation with immobilized anti-CD3 antibodies (10 μg ml−1). Scale bar, 1 μm. (c) Mean fluorescence intensity (MFI) of IP3R1 phospho-Y353, assessed by SIM analysis as in b. Each symbol represents an individual cell; small horizontal lines indicate the mean±s.d. One-way ANOVA was performed with a P value included. **P<0.01, ***P<0.001, NS, not significant. (d) HEK293 cells were transiently transfected with combinations of plasmids expressing Flag-tagged IP3R1-N, IP3R1-N-Y353F, IP3R1-N-TM or IP3R1-N-TM-Y353F, HA-tagged Fyn-Y528F, Myc-tagged Tespa1 or Tespa1-FFAA. Flag-tagged proteins were pulled down with anti-Flag beads and probed with anti-IP3R1 phospho-Y353 (p-Y353) antibody by immunoblotting. p-Y353 (SE) denotes a short exposure of the membrane probed for phospho-Y353 of IP3R1-N and IP3R1-N-Y353F. p-Y353 (LE) denotes a long exposure of membrane probed for phospho-Y353 of IP3R1-N-TM and IP3R1-N-TM-Y353F. The IP3R1-N-TM/IP3R1-N-TM-Y353F phospho- Y353 band was removed from the membrane containing IP3R1-N and IP3R1-N-Y353F and exposed separately for long time. IP3R1-N-TM is a fusion protein consisting of IP3R1-N (amino acids 1–610) and the transmembrane domain (TM) (amino acids 2216–2749) of IP3R1 that is located on the ER. Data are representative of at least three experiments.
Figure 5
Figure 5. Tespa1-IP3R1 interaction facilitates calcium signalling.
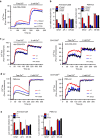
(a) Recordings of Ca2+ flux in J-Tespa1, J-FFAA, and J-Vector cells. Cells were stimulated by crosslinking biotinylated anti-CD3 and anti-CD28 antibodies (anti-CD3+CD28) with streptavidin in Ca2+-free medium, then, 2 mM CaCl2 was added. (b) Luciferase activity in J-Tespa1, J-FFAA and J-Vector cells transfected with luciferase reporter constructs (horizontal line). Cells were allowed to ‘rest’ for 30 min, and were then stimulated with anti-CD3 plus anti-CD28 antibodies (left) or PMA plus ionomycin (right) for 6 h, results were normalized to renilla luciferase activity and are presented relative to those of unstimulated cells. (c,d) Recordings of Ca2+ flux from Tespa1+/+ (+/+), Tespa1−/− (−/−) and Tespa1-FFAA (FFAA) thymocytes. Cells were stimulated by crosslinking biotinylated anti-CD3 and anti-CD4 antibodies (anti-CD3+CD4, c) with streptavidin or by PMA and ionomycin (PMA+Ion, d) in Ca2+-free medium, then, 2 mM CaCl2 was added. (e) Luciferase activity in sorted DP thymocytes from Tespa1+/+ (+/+), Tespa1−/− (−/−) and Tespa1-FFAA (FFAA) mice. Cells were transfected with luciferase reporter constructs (horizontal line), allowed to ‘rest’ for 30 min, and then stimulated with anti-CD3 and anti-CD4 antibodies (left) or PMA plus ionomycin (right) for 6 h, results were normalized to renilla luciferase activity and are presented relative to those of unstimulated cells. Data are representative of at least three experiments (error bars indicate s.d. in b,e).
Figure 6
Figure 6. Impaired TCR-proximal calcium flux in Tespa1-FFAA T cells.
(a) Two-colour time-lapse TIRFM images of Fluo4 (green) and Alexa Fluor 647-Fab anti-TCR α/β (red) captured at the indicated time points (Supplementary Movie 1) from isolated Tespa1+/+, Tespa1−/− and Tespa1-FFAA (FFAA) DP cells placed on planar lipid bilayers containing anti-CD3 antibodies. See Supplementary Movie 1 for the complete time-lapse TIRFM images. Scale bar, 3 μm. (b) Normalized fluorescence intensity (FI) of Ca2+ imaging (Fluo4) from high-speed, high-resolution, time-lapse TIRFM images of real-time Ca2+ flux in the TCR-proximal region in isolated Tespa1+/+ (+/+), Tespa1−/− (−/−) and Tespa1-FFAA (FFAA) DP cells as in a. Data are representative of at least three experiments. Bars represent mean±s.e.m. of 10 (FFAA) or 12 (+/+ and −/−) cells from one representative of three independent experiments.
Figure 7
Figure 7. Impaired positive selection in Tespa1-FFAA mice.
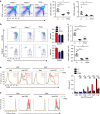
(a) Surface staining of CD4 and CD8 (left) on Tespa1+/+ (+/+), Tespa1−/− (−/−) and Tespa1-FFAA (FFAA) thymocytes. The numbers in or adjacent to the outlined areas (or in quadrants) indicate the percentage of cells in each area throughout. Right, quantification of CD4+ (CD4SP) and CD8+ (CD8SP) thymocyte subpopulations. (b) Surface expression of TCR-β and CD24 on the gated CD4SP or CD8SP thymocytes. The numbers adjacent to the outlined areas indicate the percentage of cells in the CD24loTCRβhi gate. Right, ratio of mature (CD24neg-lo) cells to immature (CD24hi) cells (Mat/imm). (c) Quantification of CD4+CD69hi and CD8+CD69hi cells from the surface staining of CD4, CD8 and CD69 on Tespa1+/+ (+/+), Tespa1−/− (−/−) and Tespa1-FFAA (FFAA) thymocytes. (d) CD69 staining on the gated CD4+ or CD8+ cells from Tespa1+/+ (+/+), Tespa1−/− (−/−) and Tespa1-FFAA (FFAA) total splenocytes left unstimulated (Med) or stimulated by TCR crosslinking with anti-CD3 antibodies for 6 h. The numbers below the bracketed lines indicate the percentage of CD69+ cells (the colours match the key). (e) Flow cytometric analysis of proliferation by CellTrace Violet staining in sorted Tespa1+/+ (+/+), Tespa1−/− (−/−) and Tespa1-FFAA (FFAA) CD4+ and CD8+ splenocytes left unstimulated (Med) or stimulated with anti-CD3 antibodies for 72 h in vitro. (f) Statistics for enzyme-linked immunosorbent assays detecting the level of secreted IFN-γ by sorted Tespa1+/+ (+/+), Tespa1−/− (−/−) and Tespa1-FFAA (FFAA) CD4+ splenocytes after a 3 days in vitro stimulation with different doses of plate-bound anti-CD3 antibodies. Each symbol (a,c) represents an individual mouse; small horizontal lines indicate the mean (and s.d.). *P<0.05, **P<0.01, ***P<0.001, and NS, not significant (two-tailed t-test). Data are representative of three independent experiments with five or six mice per group (a,c) (mean±s.d. in a,c, error bars indicate s.d. in b,f).

Similar articles

Cited by

References

    1. Malissen B., Gregoire C., Malissen M. & Roncagalli R. Integrative biology of T cell activation. Nat. Immunol. 15, 790–797 (2014). - PubMed
    1. Smith-Garvin J. E., Koretzky G. A. & Jordan M. S. T cell activation. Ann. Rev. Immunol. 27, 591–619 (2009). - PMC - PubMed
    1. Rao A. & Hogan P. G. Calcium signaling in cells of the immune and hematopoietic systems. Immunol. Rev. 231, 5–9 (2009). - PubMed
    1. Muller M. R. & NFAT Rao A. NFAT, immunity and cancer: a transcription factor comes of age. Nat. Rev. Immunol. 10, 645–656 (2010). - PubMed
    1. Vig M. & Kinet J. P. Calcium signaling in immune cells. Nat. Immunol. 10, 21–27 (2009). - PMC - PubMed

Publication types

MeSH terms