. 2017 Jun 9:8:15812.
doi: 10.1038/ncomms15812.

Zinc-dependent regulation of zinc import and export genes by Zur

Affiliations

Zinc-dependent regulation of zinc import and export genes by Zur

Seung-Hwan Choi et al. Nat Commun. .

Abstract

In most bacteria, zinc depletion is sensed by Zur, whereas the surplus is sensed by different regulators to achieve zinc homeostasis. Here we present evidence that zinc-bound Zur not only represses genes for zinc acquisition but also induces the zitB gene encoding a zinc exporter in Streptomyces coelicolor, a model actinobacteria. Zinc-dependent gene regulation by Zur occurs in two phases. At sub-femtomolar zinc concentrations (phase I), dimeric Zur binds to the Zur-box motif immediately upstream of the zitB promoter, resulting in low zitB expression. At the same time, Zur represses genes for zinc uptake. At micromolar zinc concentrations (phase II), oligomeric Zur binding with footprint expansion upward from the Zur box results in high zitB induction. Our findings reveal a mode of zinc-dependent gene activation that uses a single metalloregulator to control genes for both uptake and export over a wide range of zinc concentrations.


Conflict of interest statement

The authors declare no competing financial interests.

Figures

Figure 1
Figure 1. The abundance of Zur and its genome-wide binding in S. coelicolor.
(a) Analytical western blot analysis of Zur. Exponentially grown S. coelicolor M145 cells were either untreated or treated with varying concentrations of chelator TPEN (5.9, 5.7, 5.5 and 5.0 μM) or 100 μM ZnSO4 for 1 h before cell harvest. Crude cell extracts were analysed by western analysis, in parallel with quantified amount of purified Zur (1, 2 and 4 ng), using polyclonal antibodies against Zur. The amount of Zur in each loaded sample was estimated in ng, taking the band intensity of 1 ng purified Zur as 1.0. Average values with s.d.'s from three independent experimental samples were presented. (b) Zur-binding peaks throughout the whole genome from ChIP-chip analysis. The peak intensity values (y axis) were calculated from the average of the log2 ratios of 10 highest consecutive probe signals for each Zur-enriched site. Known promoter sites of Zur-repressed genes were indicated with red arrows. A new promoter site with Zur-binding consensus sequence was indicated with a blue arrow. (c) The Zur binding motif was extracted from the highly enriched 172 Zur-binding regions by multiple EM for motif elicitation (MEME), with E-value of 3.9e-233. (d) The zinc-specific and Zur-dependent induction of the zitB gene. Transcripts from SCO6751 (zitB) gene were analysed by S1 mapping. Exponentially grown wild type (WT) and Δzur mutant cells were treated with 6 μM TPEN or various metal salts (ZnSO4, CdCl2, CoSO4, FeSO4, MnCl2, NiSO4 and CuSO4) at 100 μM for 30 min before cell harvest. The amount of zitB transcript was quantified and presented in relative value with that in non-treated sample as 1.0. Values from three independent experiments were presented as average with s.d.'s. The P values for all the measurements in TPEN and zinc treatment to WT and TPEN treatment to Δzur mutant were <0.001 by Student's t-test.
Figure 2
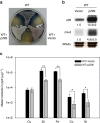
Figure 2. Overexpression of zitB hinders differentiation and causes a decrease in the content of Zn as well as Fe, Co and Ni.
(a) The ermEp::zitB construct on pSET162 plasmid (pZitB) was introduced into the chromosome of the wild-type S. coelicolor. The pZitB containing strain showed defect in sporulation (white phenotype) and antibiotic production, whereas the wild-type strain with or without the empty vector (pSET) demonstrated grey spore formation and blue antibiotic production. (b) Expression of the zitB and znuA genes in pZitB containing strain. The zitB and znuA transcripts were analysed by S1 mapping. The band intensity was quantified and presented as relative values obtained from three independent experiments and measured with P values of <0.001 by Student's t-test. (c) Intracellular amounts of divalent cations (Cu, Zn, Fe, Co and Ni) in the wild-type cells with empty pSET162 vector or pZitB, as assayed by ICP-MS analysis. Mn and Cd were not detected. Average values from three biologically independent samples were presented in ppb (μg per litre wet mycelium) with error bars representing s.d.'s. * and ** indicate measurements with P values of <0.05 and 0.001, respectively, by Student's t-test.
Figure 3
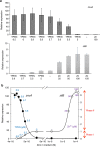
Figure 3. Zinc-responsive expression of the zitB gene in comparison with the zinc uptake (znuA) gene.
(a) S1 mapping analysis of znuA and zitB transcripts under TPEN or zinc-treated conditions. The wild-type cells grown in YEME medium to exponential growth (OD600 of 0.4 to ∼0.5) were treated for 30 min with TPEN (5.0–6.5 μM as indicated), ZnSO4 (25–150 μM as indicated) or none, before cell harvest. Quantifications of S1 mapping results were done from 11 independent experiments for znuA, and 3–6 experiments for zitB transcript analysis. The relative expression values with s.d.'s were presented, taking the untreated sample values as 1.0. The P values for all the measurements were <0.001 by Student's t-test, except the zitB value for 5 μM TPEN treatment (P>0.8). (b) The relative expression levels of znuA and zitB mRNAs were plotted against the concentrations of zinc in the medium. The maximally expressed levels were drawn as equal heights in the y axis for both znuA (solid circle; left axis) and zitB (open circle; right axis). The concentration of zinc in the TPEN-treated samples was calculated from the concentrations of treated TEPN (μM; in blue number). The added amount of Zn (μM) was indicated in purple. The amount of zinc in non-treated YEME medium (−) estimated by ICP-MS was 1.33 μM. The biphasic induction of the zitB gene was labeled as phase I (at sub-femtomolar zinc) and phase II (at >micromolar zinc).
Figure 4
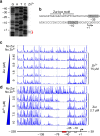
Figure 4. Footprinting analysis of Zur binding to the zitB promoter region.
(a) Determination of the zitB TSS by high-resolution S1 mapping. Exponentially grown cells were treated with ZnSO4 at 100 μM for 1 h before RNA preparation. The 5′ end position of the zitB transcript (+1) was determined by electrophoresis of S1-protected DNAs on a 6% polyacrylamide gel containing 7 M urea, along with sequencing ladders generated with the SCC5F2A cosmid DNA and the same primer used to generate the S1 probe. The position of the longest protection was assigned as +1. (b) The positions of the predicted −10 and −35 elements of the zitB promoter and the Zur-box motif. (c,d) DNase I footprinting patterns of Zur-zitB DNA interaction as analysed by capillary electrophoresis. (c) Footprinting under varying Zur protein concentrations. The DNA probe containing the zitB gene from +39 to −228 nt relative to the TSS (+1) was incubated with increasing amounts of Zur (0.45, 0.9, 1.8 and 9.0 μM) in the presence of 75 μM ZnSO4. The DNA probe only with no added Zur nor zinc was analysed in parallel. The primary protection from −40 to −78, and the extended footprint at higher Zur up to −138 were indicated with dotted lines. (d) Footprinting under varying zinc concentrations. DNase I footprinting analysis was done with the same DNA probe, but with fixed amount of Zur at 2.7 μM, and increasing amount of ZnSO4 (2.5, 5.0, 7.5 and 10.0 μM) in each binding reaction. Zinc-dependent extension of Zur footprint on the zitB promoter was shown.
Figure 5
Figure 5. Zinc-dependent formation of multimeric Zur-zitB DNA complexes in vitro and the contribution of Zur-box upstream region on zitB activation in vivo.
(a) EMSA analysis of Zur binding on 33 bp zitB DNA probe in comparison with the complex on 25 bp zitB DNA. Increasing amounts of zinc (0, 0.1, 0.5, 1.0, 2.5, 5, 10 and 20 μM) were included in the binding buffer with 90 nM Zur. The molecular weights of the retarded bands were estimated from electrophoretic mobility on native PAGE with different acrylamide percentages (Supplementary Fig. 9), and were marked as T (tetramer) or D (dimer). (b) EMSA analysis on the 114 bp zitB probe (from −148 to −35 nt). Increasing amounts of zinc (0, 0.5, 1, 5, 10 and 20 μM) were included in the binding buffer with 90 nM Zur. Based on the estimated molecular weights from native PAGE mobility, the retarded bands were indicated by O for octamer, and D for dimer. (c) Expression of GUS reporter gene linked with the zitB promoter region from +50 to −60 nt (pzitB-60GUS) or to −228 nt (pzitB-228GUS). S. coelicolor cells containing the chromosomally integrated reporter gene were either non-treated or treated with 10 μM TPEN or 100 μM ZnSO4 for 30 min. Quantitation of S1 mapping results were done from three independent experiments, and the relative expression values were presented by taking the non-treated level as 1.0. The P values of all the relative measurements except zinc-treated pzitB-60GUS were ≤0.001 by Student's t-test. (d) In vitro transcription assays of the zitB and znuA promoters in the presence of purified Zur (50 nM) and RNA polymerase core enzyme (E. coli) and the housekeeping sigma factor HrdB (S. coelicolor). Varying amounts of ZnSO4 (0, 1, 5, 10, 15 and 20 μM) were added in the transcription buffer. Predicted lengths of the zitB and znuA transcripts are 52 nt (left arrow) and 87 nt (right arrow), respectively.
Figure 6
Figure 6. A scheme for zinc-dependent changes in the binding mode of Zur on zitB DNA.
A structural model for the Zur2-DNA (25 bp) complex (a) and a model for Zur4-DNA (33 bp) complex (b). The blue regions in DNA represent the 15 bp Zur-box motif. The two figures were prepared with the same DNA orientation, to show the distinct binding modes of dimeric versus tetrameric Zur. (c) A schematic model for the change in the binding mode of Zur on zitB promoter region as zinc level increases. The dimeric Zur with three high-affinity zinc-binding sites occupied by zinc at femtomolar range (Zn3Zur)2 was indicated in red, whereas the oligomers of dimeric Zur with possibly more zinc binding at low-affinity site(s) were presented in purple.

Similar articles

Cited by

References

    1. Finney L. A. & O'Halloran T. V. Transition metal speciation in the cell: insights from the chemistry of metal ion receptors. Science 300, 931–936 (2003). - PubMed
    1. Reyes-Caballero H., Campanello G. C. & Giedroc D. P. Metalloregulatory proteins: metal selectivity and allosteric switching. Biophys. Chem. 156, 103–114 (2011). - PMC - PubMed
    1. Foster A. W., Osman D. & Robinson N. J. Metal preferences and metallation. J. Biol. Chem. 289, 28095–28103 (2014). - PMC - PubMed
    1. Waldron K. J., Rutherford J. C., Ford D. & Robinson N. J. Metalloproteins and metal sensing. Nature 460, 823–830 (2009). - PubMed
    1. Giedroc D. P. & Arunkumar A. I. Metal sensor proteins: nature's metalloregulated allosteric switches. Dalton Trans. 29, 3107–3120 (2007). - PubMed

Publication types

MeSH terms