

Mitochondrial respiration and ROS emission during β-oxidation in the heart: An experimental-computational study
- PMID: 28598967
- PMCID: PMC5482492
- DOI: 10.1371/journal.pcbi.1005588
Mitochondrial respiration and ROS emission during β-oxidation in the heart: An experimental-computational study
Abstract
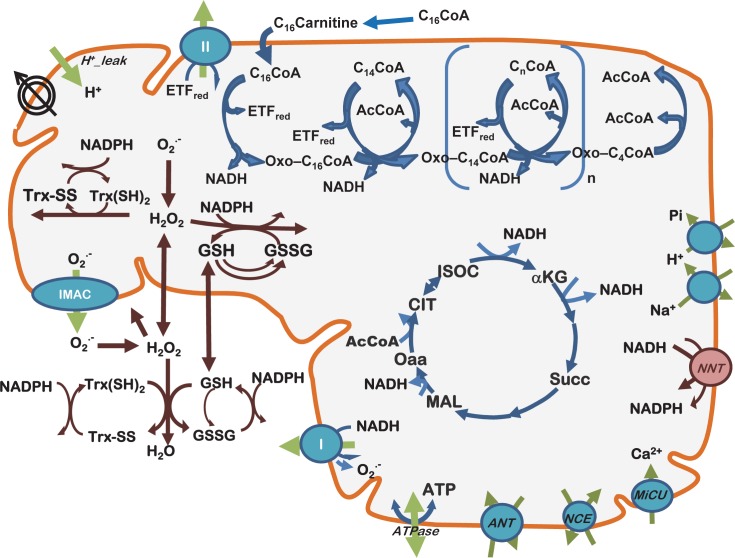
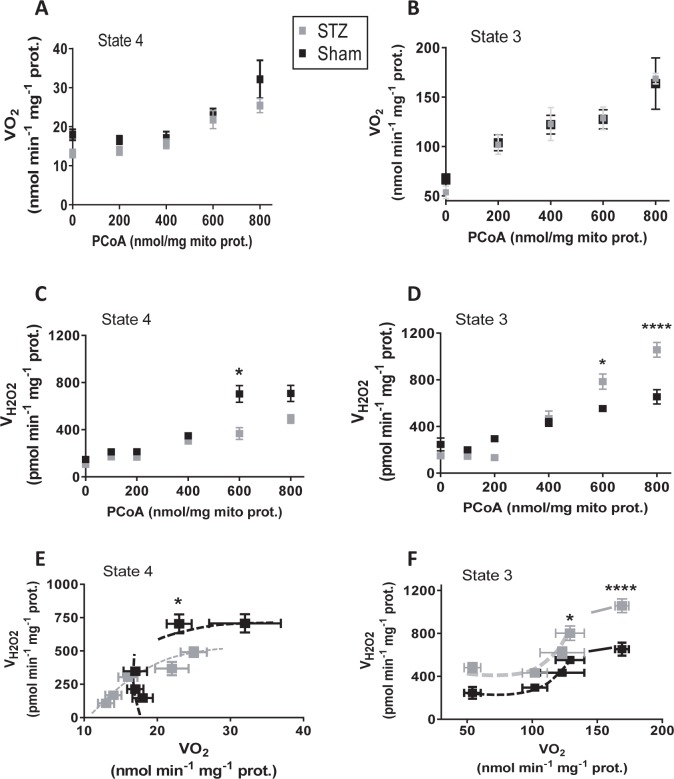
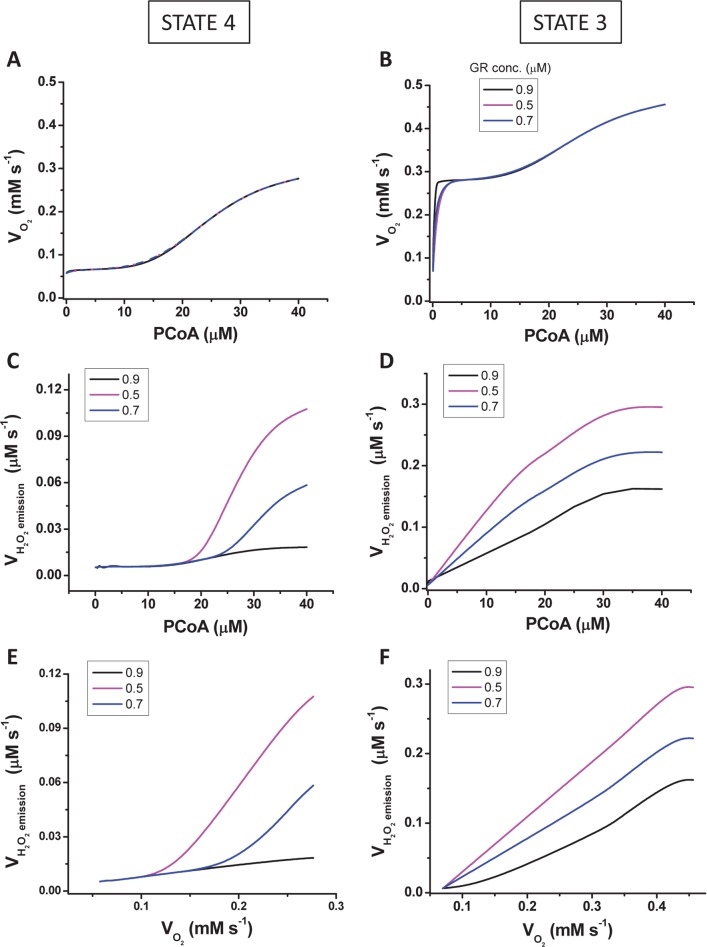
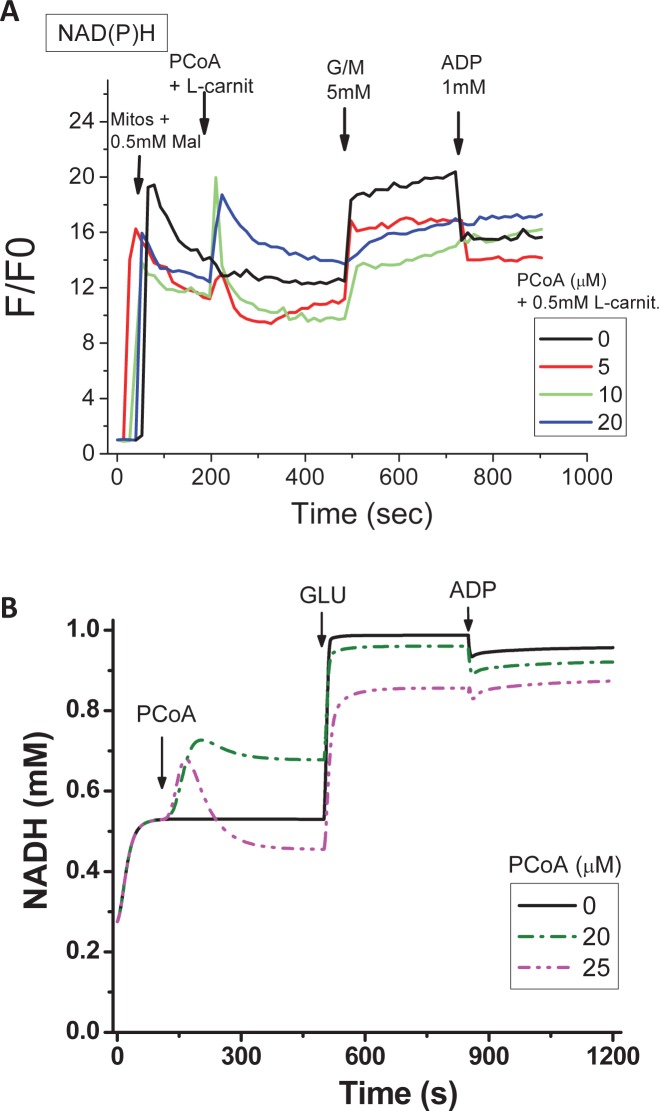
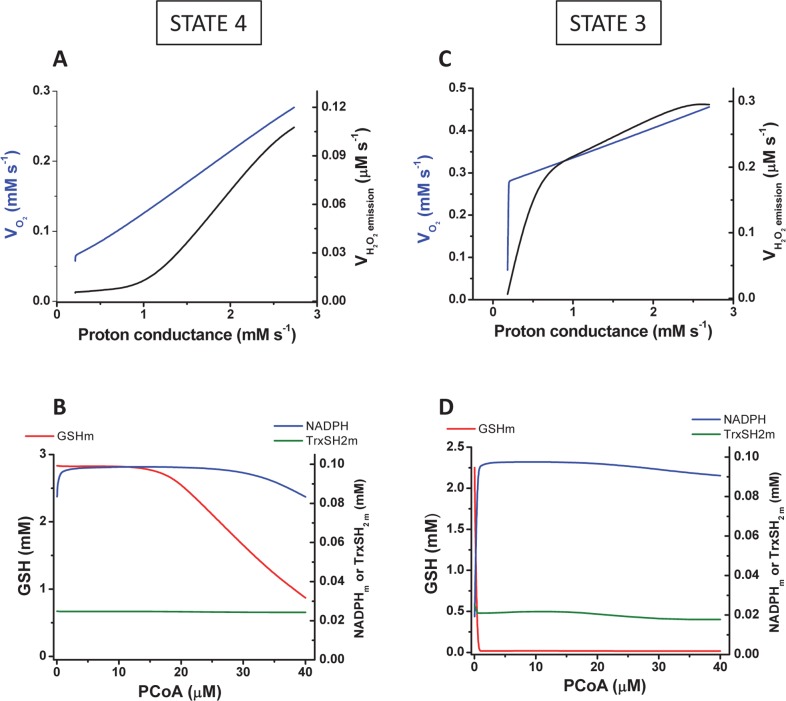
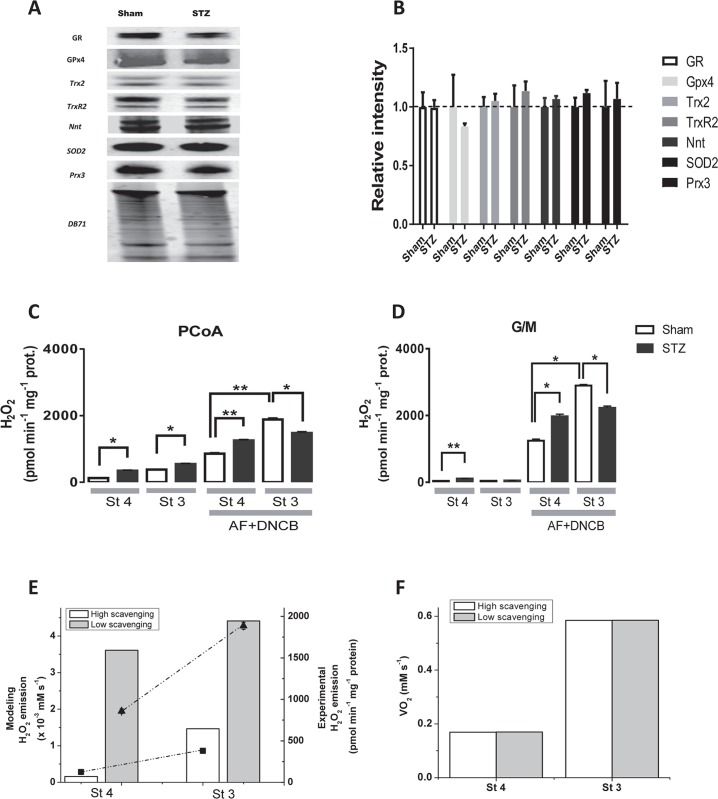
Lipids are main fuels for cellular energy and mitochondria their major oxidation site. Yet unknown is to what extent the fuel role of lipids is influenced by their uncoupling effects, and how this affects mitochondrial energetics, redox balance and the emission of reactive oxygen species (ROS). Employing a combined experimental-computational approach, we comparatively analyze β-oxidation of palmitoyl CoA (PCoA) in isolated heart mitochondria from Sham and streptozotocin (STZ)-induced type 1 diabetic (T1DM) guinea pigs (GPs). Parallel high throughput measurements of the rates of oxygen consumption (VO2) and hydrogen peroxide (H2O2) emission as a function of PCoA concentration, in the presence of L-carnitine and malate, were performed. We found that PCoA concentration < 200 nmol/mg mito protein resulted in low H2O2 emission flux, increasing thereafter in Sham and T1DM GPs under both states 4 and 3 respiration with diabetic mitochondria releasing higher amounts of ROS. Respiratory uncoupling and ROS excess occurred at PCoA > 600 nmol/mg mito prot, in both control and diabetic animals. Also, for the first time, we show that an integrated two compartment mitochondrial model of β-oxidation of long-chain fatty acids and main energy-redox processes is able to simulate the relationship between VO2 and H2O2 emission as a function of lipid concentration. Model and experimental results indicate that PCoA oxidation and its concentration-dependent uncoupling effect, together with a partial lipid-dependent decrease in the rate of superoxide generation, modulate H2O2 emission as a function of VO2. Results indicate that keeping low levels of intracellular lipid is crucial for mitochondria and cells to maintain ROS within physiological levels compatible with signaling and reliable energy supply.
Conflict of interest statement
The authors have declared that no competing interests exist.
Figures
Similar articles
-
Impaired mitochondrial energy supply coupled to increased H2O2 emission under energy/redox stress leads to myocardial dysfunction during Type I diabetes.Clin Sci (Lond). 2015 Oct;129(7):561-74. doi: 10.1042/CS20150204. Epub 2015 Jun 11. Clin Sci (Lond). 2015. PMID: 26186741 Free PMC article.
-
Redox-optimized ROS balance and the relationship between mitochondrial respiration and ROS.Biochim Biophys Acta. 2014 Feb;1837(2):287-95. doi: 10.1016/j.bbabio.2013.11.007. Epub 2013 Nov 20. Biochim Biophys Acta. 2014. PMID: 24269780 Free PMC article.
-
Effects of bioenergetics, temperature and cadmium on liver mitochondria reactive oxygen species production and consumption.Aquat Toxicol. 2019 Sep;214:105264. doi: 10.1016/j.aquatox.2019.105264. Epub 2019 Jul 25. Aquat Toxicol. 2019. PMID: 31377504
-
Generation of superoxide by the mitochondrial Complex I.Biochim Biophys Acta. 2006 May-Jun;1757(5-6):553-61. doi: 10.1016/j.bbabio.2006.03.013. Epub 2006 Apr 17. Biochim Biophys Acta. 2006. PMID: 16678117 Review.
-
A radical shift in perspective: mitochondria as regulators of reactive oxygen species.J Exp Biol. 2017 Apr 1;220(Pt 7):1170-1180. doi: 10.1242/jeb.132142. J Exp Biol. 2017. PMID: 28356365 Review.
Cited by
-
Pineapple consumption reduced cardiac oxidative stress and inflammation in high cholesterol diet-fed rats.Nutr Metab (Lond). 2021 Apr 7;18(1):36. doi: 10.1186/s12986-021-00566-z. Nutr Metab (Lond). 2021. PMID: 33827626 Free PMC article.
-
Cell-Specific Protective Signaling Induced by the Novel AT2R-Agonist NP-6A4 on Human Endothelial and Smooth Muscle Cells.Front Pharmacol. 2018 Aug 21;9:928. doi: 10.3389/fphar.2018.00928. eCollection 2018. Front Pharmacol. 2018. PMID: 30186168 Free PMC article.
-
Advances in understanding the role of adipose tissue and mitochondrial oxidative stress in Trypanosoma cruzi infection.F1000Res. 2019 Jul 22;8:F1000 Faculty Rev-1152. doi: 10.12688/f1000research.19190.1. eCollection 2019. F1000Res. 2019. PMID: 31354939 Free PMC article. Review.
-
Diabetes Mellitus Severity and a Switch From Using Lipoprotein Lipase to Adipose-Derived Fatty Acid Results in a Cardiac Metabolic Signature That Embraces Cell Death.J Am Heart Assoc. 2019 Nov 5;8(21):e014022. doi: 10.1161/JAHA.119.014022. Epub 2019 Oct 31. J Am Heart Assoc. 2019. PMID: 31665961 Free PMC article.
-
Dioxygen and Metabolism; Dangerous Liaisons in Cardiac Function and Disease.Front Physiol. 2017 Dec 12;8:1044. doi: 10.3389/fphys.2017.01044. eCollection 2017. Front Physiol. 2017. PMID: 29311974 Free PMC article. Review.
References
-
- Singh R, Cuervo AM (2012) Lipophagy: connecting autophagy and lipid metabolism. Int J Cell Biol 2012: 282041 doi: 10.1155/2012/282041 - DOI - PMC - PubMed
-
- Walther TC, Farese RV (2012) Lipid droplets and cellular lipid metabolism. Annu Rev Biochem 81: 687–714. doi: 10.1146/annurev-biochem-061009-102430 - DOI - PMC - PubMed
-
- Aggarwal NT, Makielski JC (2013) Redox control of cardiac excitability. Antioxid Redox Signal 18: 432–468. doi: 10.1089/ars.2011.4234 - DOI - PMC - PubMed
-
- Aon MA, Cortassa S, Akar FG, Brown DA, Zhou L, et al. (2009) From mitochondrial dynamics to arrhythmias. Int J Biochem Cell Biol 41: 1940–1948. doi: 10.1016/j.biocel.2009.02.016 - DOI - PMC - PubMed
-
- Aon MA, Cortassa S, Maack C, O'Rourke B (2007) Sequential opening of mitochondrial ion channels as a function of glutathione redox thiol status. J Biol Chem 282: 21889–21900. doi: 10.1074/jbc.M702841200 - DOI - PMC - PubMed
MeSH terms
Substances
LinkOut - more resources
Full Text Sources
Other Literature Sources
Medical
