

Expression of inhibitory receptors and polyfunctional responses of T cells are linked to the risk of congenital transmission of T. cruzi
- PMID: 28598971
- PMCID: PMC5479596
- DOI: 10.1371/journal.pntd.0005627
Expression of inhibitory receptors and polyfunctional responses of T cells are linked to the risk of congenital transmission of T. cruzi
Abstract
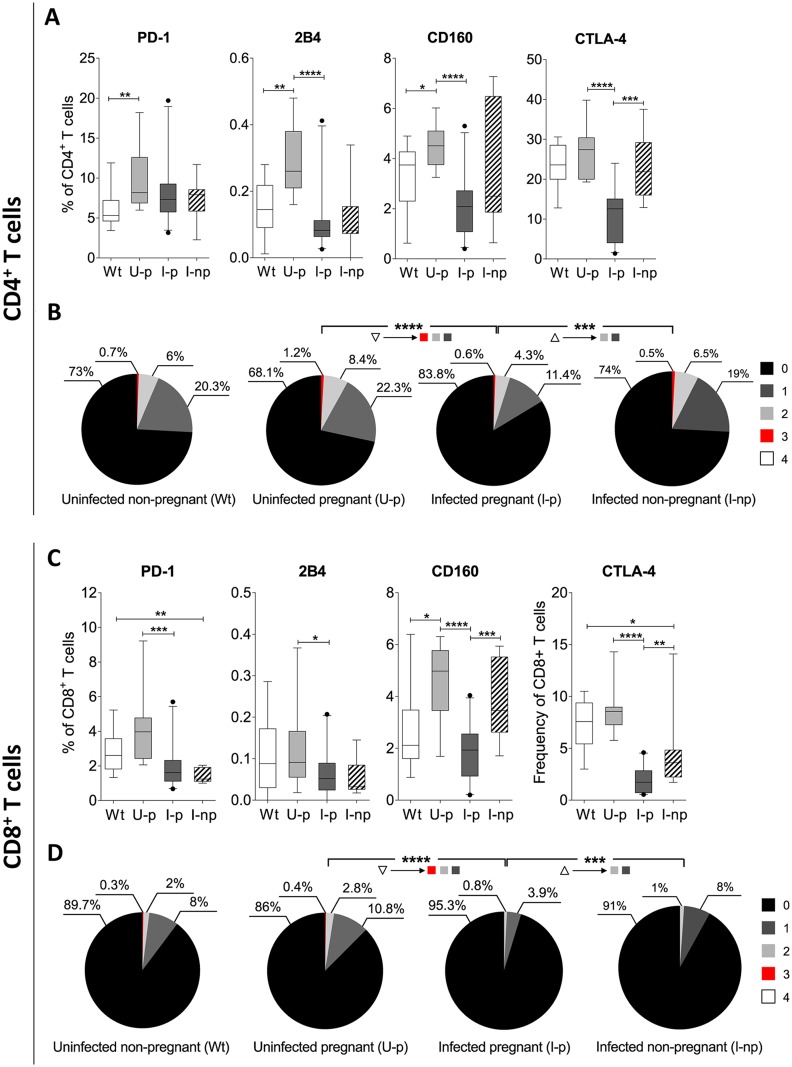
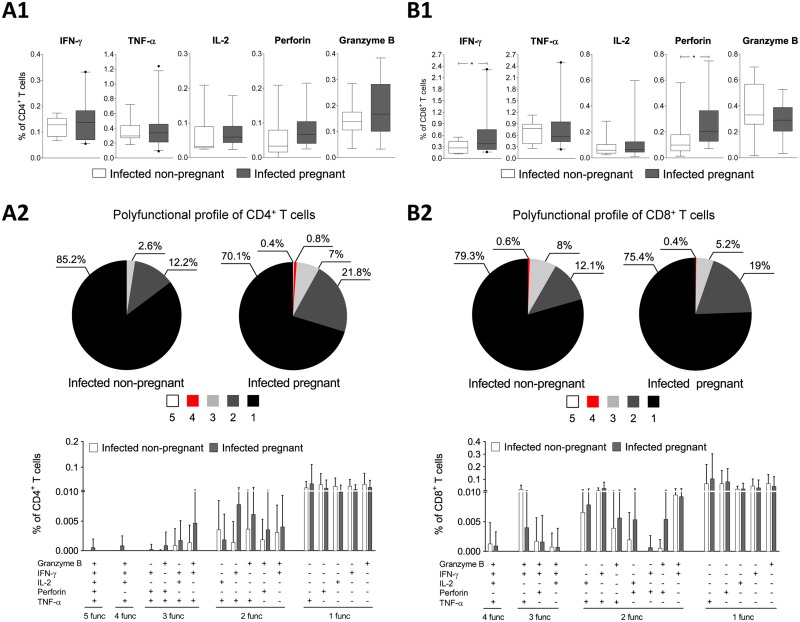
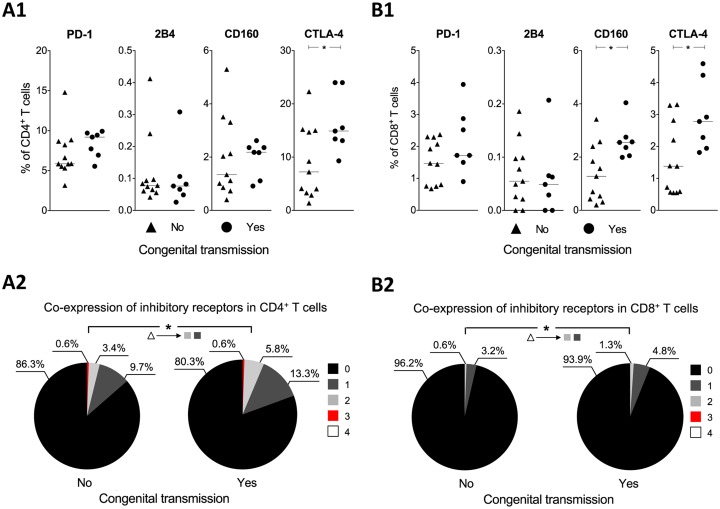
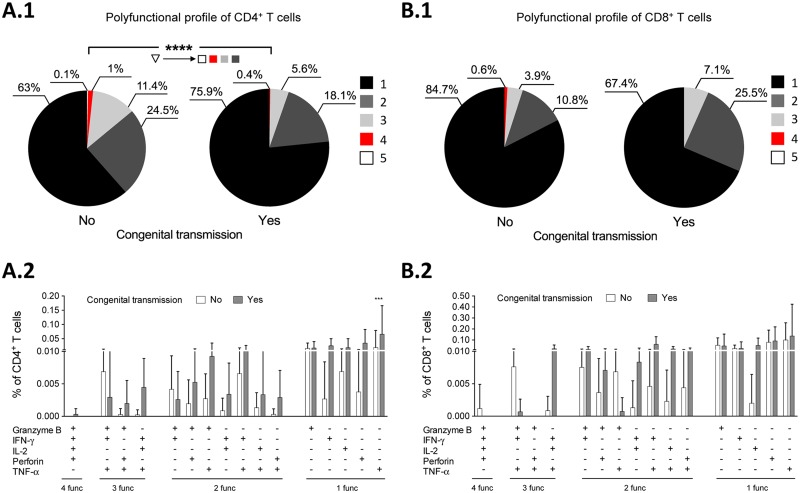
Congenital T. cruzi infections involve multiple factors in which complex interactions between the parasite and the immune system of pregnant women play important roles. In this study, we used an experimental murine model of chronic infection with T. cruzi to evaluate the changes in the expression of inhibitory receptors and the polyfunctionality of T cells during gestation and their association with congenital transmission rate of T. cruzi infection. The results showed that pregnant naïve mice had a higher percentage of CD4+ and CD8+ T cells that expressed inhibitory receptors than cells from non-pregnant naïve mice. However, in mice chronically infected with T. cruzi, gestation induced a significant decrease in the frequency of T cells that expressed or co-expressed inhibitory receptors, as well as an increase in the frequency of polyfunctional CD4+ and CD8+ T cells. This different behavior may be due to the breakdown in the infected mice of the gestation-induced immune homeostasis, probably to control the parasite load. Remarkably, it was observed that the mothers that transmitted the parasite had a higher frequency of T cells that expressed and co-expressed inhibitory receptors as well as a lower frequency of polyfunctional parasite-specific T cells than those that did not transmit it, even though the parasitemia load was similar in both groups. All together these data suggest that the maternal immune profile of the CD4+ and CD8+ T cells could be a determining factor in the congenital transmission of T. cruzi.
Conflict of interest statement
The authors have declared that no competing interests exist.
Figures
Similar articles
-
Congenital transmission of Trypanosoma cruzi is associated with maternal enhanced parasitemia and decreased production of interferon- gamma in response to parasite antigens.J Infect Dis. 2004 Apr 1;189(7):1274-81. doi: 10.1086/382511. Epub 2004 Mar 12. J Infect Dis. 2004. PMID: 15031797
-
Diagnosis of congenital Trypanosoma cruzi infection: A serologic test using Shed Acute Phase Antigen (SAPA) in mother-child binomial samples.Acta Trop. 2015 Jul;147:31-7. doi: 10.1016/j.actatropica.2015.03.026. Epub 2015 Apr 3. Acta Trop. 2015. PMID: 25847262
-
Circulating Cytokine and Chemokine Profiles of Trypanosoma cruzi-Infected Women During Pregnancy and Its Association With Congenital Transmission.J Infect Dis. 2021 Sep 17;224(6):1086-1095. doi: 10.1093/infdis/jiab057. J Infect Dis. 2021. PMID: 33528501
-
Dynamics of T Cells Repertoire During Trypanosoma cruzi Infection and its Post-Treatment Modulation.Curr Med Chem. 2019;26(36):6519-6543. doi: 10.2174/0929867325666181101111819. Curr Med Chem. 2019. PMID: 30381063 Review.
-
Infection and invasion mechanisms of Trypanosoma cruzi in the congenital transmission of Chagas' disease: a proposal.Biol Res. 2010;43(3):307-16. Epub 2010 Nov 30. Biol Res. 2010. PMID: 21249302 Review.
Cited by
-
Differential Expression of Immune Response Genes in Asymptomatic Chronic Chagas Disease Patients Versus Healthy Subjects.Front Cell Infect Microbiol. 2021 Sep 6;11:722984. doi: 10.3389/fcimb.2021.722984. eCollection 2021. Front Cell Infect Microbiol. 2021. PMID: 34552885 Free PMC article.
-
A proportion of CD4+ T cells from patients with chronic Chagas disease undergo a dysfunctional process, which is partially reversed by benznidazole treatment.PLoS Negl Trop Dis. 2021 Feb 4;15(2):e0009059. doi: 10.1371/journal.pntd.0009059. eCollection 2021 Feb. PLoS Negl Trop Dis. 2021. PMID: 33539379 Free PMC article.
-
An Animal Model of Acute and Chronic Chagas Disease With the Reticulotropic Y Strain of Trypanosoma cruzi That Depicts the Multifunctionality and Dysfunctionality of T Cells.Front Immunol. 2019 Apr 26;10:918. doi: 10.3389/fimmu.2019.00918. eCollection 2019. Front Immunol. 2019. PMID: 31105709 Free PMC article.
-
CD8+ T Cell Response Quality Is Related to Parasite Control in an Animal Model of Single and Mixed Chronic Trypanosoma cruzi Infections.Front Cell Infect Microbiol. 2021 Oct 12;11:723121. doi: 10.3389/fcimb.2021.723121. eCollection 2021. Front Cell Infect Microbiol. 2021. PMID: 34712620 Free PMC article.
-
Understanding CD8+ T Cell Immunity to Trypanosoma cruzi and How to Improve It.Trends Parasitol. 2019 Nov;35(11):899-917. doi: 10.1016/j.pt.2019.08.006. Epub 2019 Oct 10. Trends Parasitol. 2019. PMID: 31607632 Free PMC article. Review.
References
-
- Rassi A Jr., Rassi A, Marin-Neto JA. Chagas disease. Lancet. 2010;375(9723): 1388–402. doi: 10.1016/S0140-6736(10)60061-X - DOI - PubMed
-
- Coura JR, Borges-Pereira J. Chagas disease: 100 years after its discovery. A systemic review. Acta Trop. 2010;115(1–2): 5–13. doi: 10.1016/j.actatropica.2010.03.008 - DOI - PubMed
-
- Lasso P, Mateus J, Pavia P, Rosas F, Roa N, Thomas MC, et al. Inhibitory Receptor Expression on CD8+ T Cells Is Linked to Functional Responses against Trypanosoma cruzi Antigens in Chronic Chagasic Patients. J Immunol. 2015;195(8): 3748–58. doi: 10.4049/jimmunol.1500459 - DOI - PubMed
-
- Nakamoto N, Cho H, Shaked A, Olthoff K, Valiga ME, Kaminski M, et al. Synergistic reversal of intrahepatic HCV-specific CD8+ T cell exhaustion by combined PD-1/CTLA-4 blockade. PLoS Pathog. 2009;5(2): e1000313 doi: 10.1371/journal.ppat.1000313 - DOI - PMC - PubMed
-
- Arguello RJ, Albareda MC, Alvarez MG, Bertocchi G, Armenti AH, Vigliano C, et al. Inhibitory receptors are expressed by Trypanosoma cruzi-specific effector T cells and in hearts of subjects with chronic Chagas disease. PLoS One. 2012;7(5): e35966 doi: 10.1371/journal.pone.0035966 - DOI - PMC - PubMed
MeSH terms
Substances
LinkOut - more resources
Full Text Sources
Other Literature Sources
Medical
Research Materials
