. 2017 Jun 9;12(6):e0179203.
doi: 10.1371/journal.pone.0179203. eCollection 2017.

The dynamic role of autophagy and MAPK signaling in determining cell fate under cisplatin stress in osteosarcoma cells

Affiliations

The dynamic role of autophagy and MAPK signaling in determining cell fate under cisplatin stress in osteosarcoma cells

Sudeshna Mukherjee et al. PLoS One. .

Abstract

Osteosarcoma (OS) is an aggressive bone malignancy commonly observed in children and adolescents. Sub-optimal therapy for years has irretrievably compromised the chances of OS patient survival; also, lack of extensive research on this rare disease has hindered therapeutic development. Cisplatin, a common anti-tumor drug, is currently an integral part of treatment regime for OS along with methotrexate and doxorubicin. However, toxicity issues associated with combination module impede OS therapy. Also, despite the proven benefits of cisplatin, acquisition of resistance remains a concern with cisplatin-based therapy. This prompted us to investigate the molecular effects of cisplatin exposure and changes associated with acquired resistance in OS cells. Cisplatin shock was found to activate MAPK signaling and autophagy in OS cells. An activation of JNK and autophagy acted as pro-survival strategy, while ERK1/2 triggered apoptotic signals upon cisplatin stress. A crosstalk between JNK and autophagy was observed. Maximal sensitivity to cisplatin was obtained with simultaneous inhibition of both autophagy and JNK pathway. Cisplatin resistant cells were further developed by repetitive drug exposure followed by clonal selection. The resistant cells showed an altered signaling circuitry upon cisplatin exposure. Our results provide valuable cues to possible molecular alterations that can be considered for development of improved therapeutic strategy against osteosarcoma.


Conflict of interest statement

Competing Interests: The authors have declared that no competing interests exist.

Figures

Fig 1
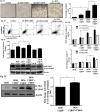
Fig 1. Development and characterization of HOS-resistant model.
(A) Cells were seeded at a density of 4000 per well in triplicates. MTT assay was performed following CDDP exposure for 24h. Percentage viability of OS-R cells compared to parental cells is represented in the figure. (B) Phase contrast images of—i. HOS parental untreated cells; ii. HOS-CDDP-treated cells, images were captured after 30min of 1mg/ml CDDP shock; iii. HOS cells reviving post shock when maintained in drug free media for around 3–4 weeks; iv. Resistant cells (OS-R) maintained in IC50 dose of CDDP. The scale bar represents 30μm. (C) cDNA was synthesized from DNase-treated RNA isolated from HOS and OS-R cells. RT-PCR was performed with ABCB1 specific primers. Fold change in expression level of ABCB1 gene is represented in the figure with untreated control taken as “1”. (D) Single cell colony formation assay was performed in HOS and OS-R cells. Cells were counted and serially diluted until distinct single cells were observed. The cells were then monitored for their colony forming capacity. Fold increase in number of colonies formed after 24 and 48h in OS-R cells compared to HOS is represented. (E) Levels of cleaved PARP-1 was monitored by immunoblot after IC50 dose of CDDP exposure for 24h in HOS cells and in OS-R cells maintained in IC50 dose of CDDP. (F) The HOS cells were maintained in conditioned media (CM) for 48h and survivability upon exposure to various concentrations of CDDP was measured by MTT assay. Here, control (Ctrl) represents regular media in which HOS cells were cultured. The symbol (*) signifies a significant difference in CM with respect to control.
Fig 2
Fig 2. Effect of CDDP on autophagy in HOS and OS-R cells.
(A) Immunoblot analysis was performed to analyze expression of specific autophagic markers representing late stages of autophagy following CDDP exposure (IC50) for 24h in HOS cells. Densitometric scanning of each blot was performed with ImageJ software to quantitate differences in expression. Expression level in untreated control HOS cells was set as arbitrary unit “1” in this and in subsequent figures. β-Actin served as a loading control. (B) MDC fluorescence staining was performed in HOS cells with and without treatment with CDDP (IC50) for 24h and in OS-R cells. Green dots indicative of autophagosomes were monitored by fluorescence microscopy. A representative image is presented. Fluorimetric measurement of MDC fluorescence is also presented in the form bar diagram, where control was considered as arbitrary unit "1". (C) HOS and OS-R cells cultured in 96-well plates were pre-treated for 24h with autophagy inhibitors, 3-MA (8μM) and CQDP (10μM) and then exposed to various concentrations of CDDP. MTT assay was performed for each sample in triplicate. The graph represents percentage viability of cells. The symbol (*) denotes a significant difference with respect to untreated HOS cells and the symbol (#) denotes a significant difference in OS-R with respect to HOS cells.
Fig 3
Fig 3. Effect of autophagy inhibition in HOS and OS-R cells.
(A) Phase contrast images showing morphology of HOS untreated (i), CDDP (IC50) treated (ii), only CQDP (10μM)-treated (iii) and cells treated for 24h with both CQDP and CDDP (iv). The scale bar represents 30μm. (B) Flow cytometric analysis of apoptosis with AnnexinV/PI upon autophagy inhibition. HOS cells were either untreated (i) or treated with CDDP (IC50) (ii), only CQDP (10μM) (iii) or both CQDP and CDDP (iv) for 24h. CQDP was added 24h prior to CDDP treatment. Cells present in the lower right (LR) and upper right (UR) quadrant represent early and late apoptotic cells respectively. A fold increase in total number of apoptotic cells upon different treatment is represented through bar diagram. (C) Immunoblot showing cleaved PARP-1 expression levels in HOS and OS-R cells after 24h of CDDP exposure in presence or absence of CQDP (10μM). Densitometric scanning was performed with ImageJ software. β-Actin served as a loading control. (D) Caspase-3 assay was performed to determine apoptosis induction in cells after various treatments. A prior treatment of CQDP (10μM, 24h) was given to the cells before CDDP (IC50) exposure. To inhibit caspase activity Z-VAD-FMK was used at 50μM concentration and was added 1h prior to administration of various treatments. Activity in control HOS and OS-R cells was taken as "1". (E) Autophagic flux representative of difference in protein level of LC3B-II between CQDP treated HOS cells and CQDP plus CDDP (IC50) treated cells was checked by immunoblot. The same is represented with bar diagram. A prior treatment of CQDP (10μM, 24h) was given to cells before CDDP exposure.
Fig 4
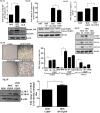
Fig 4. Role of activated ERK1/2 signaling upon CDDP stress.
(A) Levels of phosphorylated-ERK1/2 were analyzed by immunoblot after CDDP exposure (IC50) for 24h in HOS cells. OS-R cells were maintained at similar CDDP concentration. Bands were densitometrically scanned with ImageJ and normalized to total ERK1/2. β-Actin served as a loading control. (B) ERK1/2 signaling was inhibited in HOS cells with U0126 (10μM; 2h) and CDDP (IC50) treatment was made thereafter for 24h. Cleaved PARP-1 levels were then analyzed by immunoblot. β-Actin served as a loading control. (C) A fold change in caspase-3 activity was analyzed colorimetrically in HOS cells. ERK1/2 signaling was inhibited with U0126 (10μM; 2h) followed by CDDP (IC50) treatment for 24h. Activity in control HOS cells was considered as "1". (D) Representative phase contrast images for HOS-untreated (i), CDDP (IC50)-treated (24h) (ii), only U0126-treated (iii), and cells with prior ERK1/2 inhibition followed by CDDP (IC50) treatment (24h) (iv). The scale bar represents 30μm.
Fig 5
Fig 5. Role of activated JNK signaling upon CDDP stress.
(A) Levels of phosphorylated-JNK were analyzed by immunoblot in untreated HOS cells, in CDDP exposed (at IC50 dose) HOS cells for 24h and in OS-R cells. Densitometric scanning was performed with ImageJ software and normalized to total protein. β-Actin served as a loading control. (B) JNK signaling was inhibited in HOS cells with SP600125 (SP, 25μM). SP was added 2h prior to CDDP treatment (IC50 for 24h). Cleaved PARP-1 levels were then analyzed by immunoblot in untreated HOS, only SP-treated cells, only CDDP-treated cells, and in HOS cells treated with SP plus CDDP. β-Actin served as a loading control. Densitometric scanning was performed with ImageJ software. (C) A fold change in caspase-3 activity was analyzed colorimetrically in HOS cells. JNK signaling was inhibited with SP (25μM; added 2h prior to CDDP) followed by CDDP (IC50) treatment for 24h. Activity in control HOS cells was considered as "1". (D) Representative phase contrast images for HOS-untreated (i), CDDP (IC50)-treated (24h) (ii), only SP-treated (iii), and cells with prior JNK inhibition followed by CDDP (IC50) treatment (24h) (iv). The scale bar represents 30μm. (E) Autophagy was inhibited in HOS cells with prior treatment of CQDP (10μM, 24h) followed by CDDP (IC50) exposure. Protein expression of autophagic markers- LC3B-II, ATG-5 and ATG-12 were analyzed by immunoblot. Densitometric scanning was performed with ImageJ and represented. β-Actin served as a loading control. (F) To confirm an increase in autophagic flux upon JNK inhibition HOS cells were treated with SP (25μM; 2h) followed by CQDP (10μM) for 24h. Immunoblot analysis was performed for anti-LC3B-II. Difference in protein level of LC3B-II is represented with a bar diagram. β-Actin served as a loading control.
Fig 6
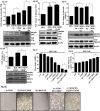
Fig 6. Effect of autophagy inhibition on MAPK signaling.
(A) Levels of phosphorylated-JNK were analyzed by immunoblot after CDDP exposure (IC50) for 1h (A), 6h (A) and 24h (B) in HOS cells. A prior treatment of CQDP (10μM, 24h) was given wherever mentioned before CDDP exposure. Densitometric scanning was performed with ImageJ. β-Actin served as a loading control. (C and D) Levels of phosphorylated-ERK1/2 were analyzed by immunoblot after CDDP exposure (IC50) for 1h (C), 6h (C) and 24h (D) in HOS cells. A prior treatment of CQDP (10μM, 24h) was given wherever mentioned before CDDP exposure. Densitometric scanning was performed with ImageJ software. β-Actin served as a loading control. (E) Cell viability was measured 24h after treatment by trypan blue assay. Cells were either untreated or treated with the following:- SP (25μM); CQDP (10μM); SP (25μM) plus CQDP (10μM); CDDP (IC50); CQDP (10μM) plus CDDP (IC50); SP (25μM) plus CDDP (IC50); or SP (25μM) plus CQDP (10μM) plus CDDP (IC50). (F) A fold change in caspase-3 activity was analyzed colorimetrically 24h after treatment in HOS cells. Cells were either untreated or treated with the following:- SP (25μM); CQDP (10μM); SP (25μM) plus CQDP (10μM); CDDP (IC50); SP (25μM) plus CDDP (IC50); or SP (25μM) plus CQDP (10μM) plus CDDP (IC50). Activity in control HOS cells was considered as "1". (G) Representative phase contrast images of HOS cells treated with CDDP (IC50) for 24h or along with combinations of inhibitors, SP600125 (25μM) or CQDP (10μM) or both (i-v). The scale bar represents 30μm.
Fig 7
Fig 7. Role of p53 status in modulating autophagic response.
(A) CMV-driven wild type p53 expression construct was transfected to HOS cells. Around 24h and 48h post transfection cells were exposed to specific treatments—SP (25μM) for 2h followed by CDDP (IC50) for 24h. Immunoblot analysis was performed to analyze LC3B-II levels. β-Actin served as a loading control and un-transfected cells served as an experimental control. (B) Transfected and un-transfected cells were analyzed for expression of p53 protein. (C) As representative of cells harboring p53 wild type protein, HepG2 cells were treated with SP (25μM) for 2h followed by CDDP (IC50) for 24h and harvested for analysis of LC3B by immunoblot analysis.

Similar articles

Cited by

References

    1. Bielack SS, Carrle D, Hardes J, Schuck A, Paulussen M. Bone tumors in adolescents and young adults. Curr Treat Options Oncol. 2008. February;9(1):67–80. doi: 10.1007/s11864-008-0057-1 - DOI - PubMed
    1. Bacci G, Ferrari S, Bertoni F, Picci P, Bacchini P, Longhi A, et al. Histologic response of high-grade nonmetastatic osteosarcoma of the extremity to chemotherapy. Clin Orthop Relat Res. 2001. May(386):186–96. - PubMed
    1. Bacci G, Rocca M, Salone M, Balladelli A, Ferrari S, Palmerini E, et al. High grade osteosarcoma of the extremities with lung metastases at presentation: treatment with neoadjuvant chemotherapy and simultaneous resection of primary and metastatic lesions. J Surg Oncol. 2008. November 1;98(6):415–20. doi: 10.1002/jso.21140 - DOI - PubMed
    1. Blay JY. Chemotherapy for osteosarcoma without high-dose methotrexate: another piece in the puzzle. Onkologie. 2007. May;30(5):226–7. - PubMed
    1. Chou AJ, Geller DS, Gorlick R. Therapy for osteosarcoma: where do we go from here? Paediatr Drugs. 2008;10(5):315–27. - PubMed

MeSH terms