. 2017 Jun 9;12(6):e0179204.
doi: 10.1371/journal.pone.0179204. eCollection 2017.

α-Mangostin ameliorates hepatic steatosis and insulin resistance by inhibition C-C chemokine receptor 2

Affiliations

α-Mangostin ameliorates hepatic steatosis and insulin resistance by inhibition C-C chemokine receptor 2

Hong Min Kim et al. PLoS One. .

Abstract

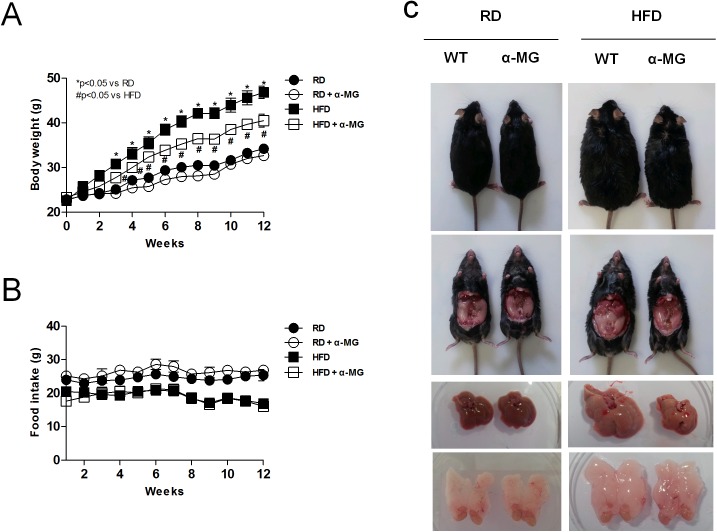
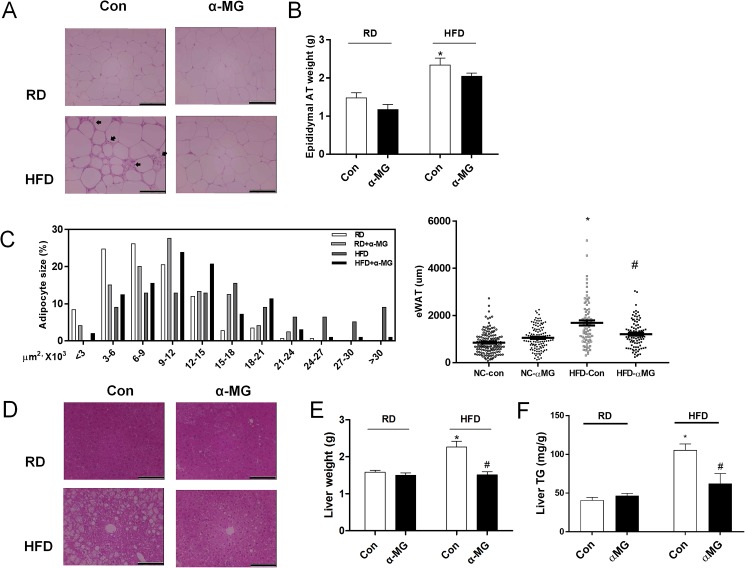
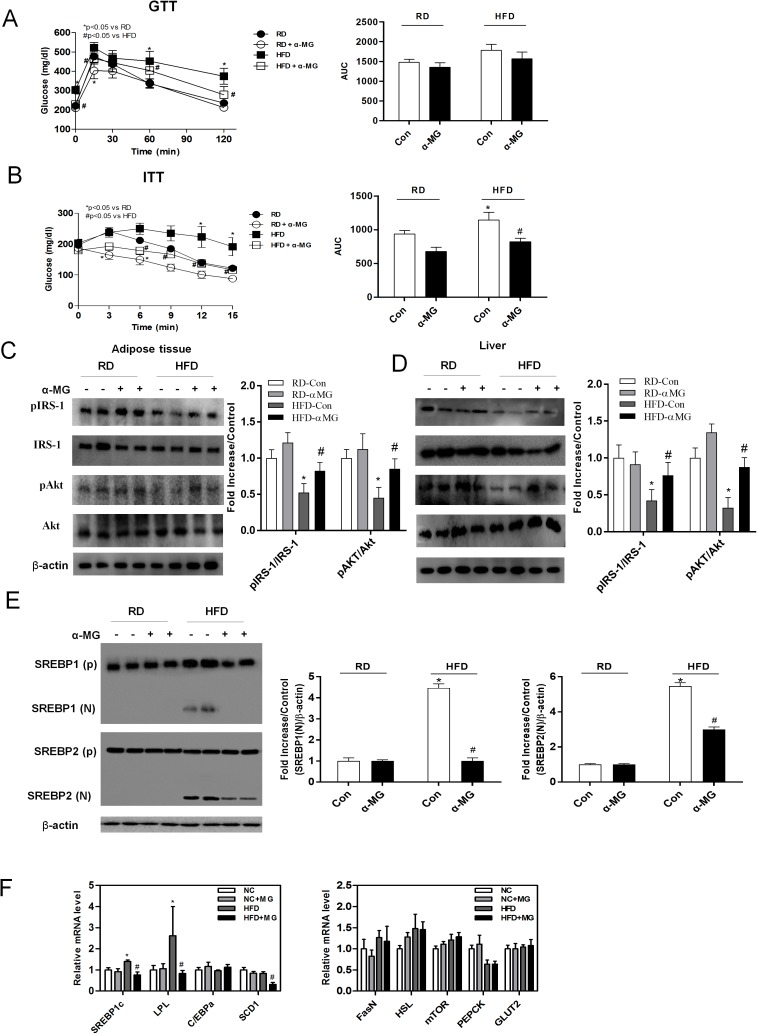
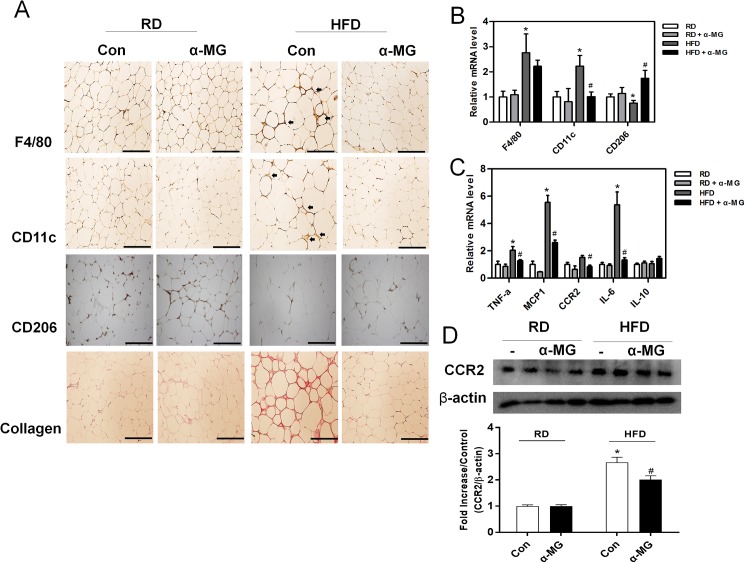
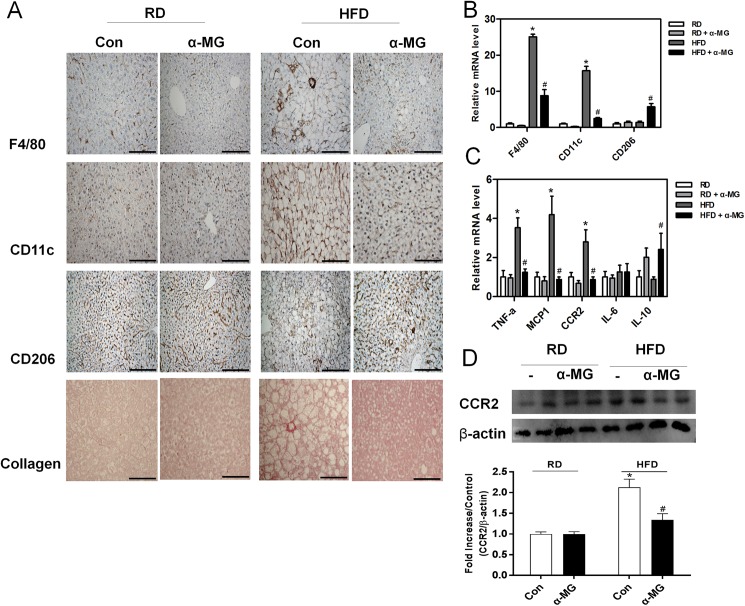
Obesity induces various metabolic diseases such as dyslipidemia, nonalcoholic fatty liver disease (NAFLD), and type 2 diabetes. Fat expansion in adipose tissue induces adipose tissue dysfunction and inflammation, insulin resistance, and other metabolic syndromes. α-Mangostin (α-MG) has been previously studied for its anti-cancer, anti-inflammatory, and antioxidant activities. In this study, we investigated the effects of α-MG on adipose tissue inflammation and hepatic steatosis. We categorized study animals into four groups: regular diet control mice, RD mice treated with α-MG, high fat diet-induced obese mice, and HFD mice treated with α-MG. α-MG treatment significantly reduced not only the body, liver, and fat weights, but also plasma glucose, insulin, and triglyceride levels in HFD mice. Additionally, adiponectin levels of α-MG-treated mice were significantly higher than those of control HFD mice. Immunohistochemistry of liver and adipose tissue showed that CD11c expression was reduced in α-MG fed obese mice. α-MG treatment of HFD mice down-regulated the adipose-associated inflammatory cytokines and CCR2 in both liver and adipose tissue. Moreover, glucose tolerance and insulin sensitivity were significantly improved in α-MG fed obese mice. α-Mangostin ameliorates adipose inflammation and hepatic steatosis in HFD-induced obese mice.


Conflict of interest statement

Competing Interests: The authors declare that no competing interests exist.

Figures

Fig 1
Fig 1. α-MG suppressed HFD-induced body weight gain in experimental animals.
WT and α-MG-treated mice were fed a high-fat diet (HFD) for 12 weeks. (A) Body weight changes of WT mice (n = 10) and α-MG-treated mice (n = 10). (B) Food intake changes of WT mice and α-MG-treated mice. (C) Tissue size of WT mice and α-MG treated mice. Data are shown as mean ± SEM with n = 10 animals per group. *P < 0.05 compared with RD mice. #P < 0.05 compared to HFD mice.
Fig 2
Fig 2. α-MG reduced liver tissue weight and epididymal adipose tissue in HFD mice.
(A) Pathological grade from histological examination of the adipose tissues stained with hematoxylin and eosin. (B) Adipose tissue weight changes of WT mice and α-MG-treated mice. (C) Adipocytes size of adipose tissue in WT mice and α-MG-treated mice. (D) Pathological grade from histological examination of the livers stained with hematoxylin and eosin. (E) Liver weight changes of WT mice and α-MG-treated mice. (F) TG contents of the livers from RD- or HFD-fed WT and α-MG-treated mice. Original magnification is x200 (scale bar = 100 μm). Data are shown as mean ± SEM with n = 10 animals per group. *P < 0.05 compared to RD mice. #P < 0.05 compared to HFD mice.
Fig 3
Fig 3. α-MG improved glucose tolerance and insulin sensitivity and reduced expression of lipid synthesis genes in the liver.
(A) Mice underwent glucose (1 g/kg) tolerance tests and area under the curve of GTT. and (B) insulin (0.75 U/kg) tolerance tests and area under the curve of ITT. Western blots of insulin signaling molecules, pIRS-1 and pAkt, (C) in the adipose tissue and (D) in the liver. phosphorylated Akt or IRS-1 were normalized to non-phosphorylated Akt or IRS-1. Cropped membrane was used in western blot. (E) The expression of the proteins SREBP1(N) and SREBP2(N) was measured in liver tissue using western blots, which were re-probed for β-actin as a loading control. All data were normalized to beta-actin. The band intensities were measured using an Image J Analyzer. (F) Expression of the fatty acid synthesis genes (SREBP1c, LPL, C/EBPα, SCD1, FasN, HSL, mTOR, PEPCK and GLUT2). mRNA levels were estimated using real-time PCR. Data are shown as mean ± SEM with n = 10 animals per group. *P < 0.05 compared with RD mice. #P < 0.05 compared to HFD mice.
Fig 4
Fig 4. Changes in macrophages and inflammatory responses in white adipose tissue.
(A) Immunohistochemistry staining of collagen and the macrophage markers F4/80 (total macrophages), CD11c (type 1 macrophages), and CD206 (type 2 macrophages) in white adipose tissue. Original magnification is x200 (scale bar = 100 μm). (B) Macrophage marker mRNA levels in white adipose tissue (n = 6). (C) Concentrations of inflammatory cytokines (TNF-α, MCP-1, CCR2 and IL-6) and the anti-inflammatory cytokine IL-10 in white adipose tissue (n = 6). mRNA levels were estimated using real-time PCR. *P < 0.05 compared to RD mice. #P < 0.05 compared to HFD mice. (D) The expression of CCR2 protein was measured in adipose tissue using western blots, which were re-probed for β-actin as a loading control. The band intensities were measured using an Image J Analyzer.
Fig 5
Fig 5. Changes in macrophages and inflammatory responses in liver tissue.
(A) Immunohistochemistry staining of collagen and the macrophage markers F4/80 (total macrophages), CD11c (type 1 macrophages), and CD206 (type 2 macrophages) in liver tissue. Original magnification is x200 (scale bar = 100 μm). (B) Macrophage marker mRNA levels in liver tissue (n = 6). (C) Concentrations of inflammatory cytokines (TNF-α, MCP-1, CCR2 and IL-6) and anti-inflammatory cytokine IL-10 in liver tissue (n = 6). mRNA levels were estimated using real-time PCR. *P < 0.05 compared to RD mice. #P < 0.05 compared to HFD mice. (D) The expression of CCR2 protein was measured in liver using western blots, which were re-probed for β-actin as a loading control. The band intensities were measured using an Image J Analyzer.
Fig 6
Fig 6. α-MG reduced inflammatory cell migration and cytokines.
(A) Peritoneal macrophages and (B) Raw 264.7 (macrophage) cells were treated with CCL2 (10 ng/ml) or ATCM (adipose tissue-conditioned medium) in the presence and absence of CCR2 inhibitor (10 μM/ml) or α-MG (25 μM/ml) for 24h. The number of transmigrated peritoneal macrophages was measured using a migration assay in the presence and absence of α-MG. Original magnification is x200 (scale bar = 100 μm). (C) mRNA expression of pro-inflammatory cytokines (TNF-α, MCP-1, CCR2, and IL-6) and the anti-inflammatory cytokine IL-10 in Raw264.7 cells. mRNA levels were estimated using real-time PCR. *P < 0.05 compared to control. #P < 0.05 compared to CCL2 or ATCM treated.
Fig 7
Fig 7. α-MG did not attenuate differentiation of bone marrow-derived macrophages.
Vehicle or α-MG (10 μM/ml) were co-administrated with M-CSF (20 ng/ml) and cultured in RPMI 1640 medium containing 10% FBS and 1% penicillin at 37°C for 5 days to allow macrophage differentiation. The percentages of (A) M1 macrophages (F4/80+ CD11c+) and (B) M2 macrophages (F4/80+ CD206+) are shown. This mean was estimated by flow cytometry analysis.

Similar articles

Cited by

References

    1. Yang L, Colditz GA (2015) Prevalence of Overweight and Obesity in the United States, 2007–2012. JAMA Intern Med 175: 1412–1413. doi: 10.1001/jamainternmed.2015.2405 - DOI - PMC - PubMed
    1. Grundy SM (2004) Obesity, metabolic syndrome, and cardiovascular disease. J Clin Endocrinol Metab 89: 2595–2600. doi: 10.1210/jc.2004-0372 - DOI - PubMed
    1. Pi-Sunyer FX (1991) Health implications of obesity. Am J Clin Nutr 53: 1595S–1603S. - PubMed
    1. Quan X, Wang Y, Ma X, Liang Y, Tian W, Ma Q, et al. (2012) alpha-Mangostin induces apoptosis and suppresses differentiation of 3T3-L1 cells via inhibiting fatty acid synthase. PLoS One 7: e33376 doi: 10.1371/journal.pone.0033376 - DOI - PMC - PubMed
    1. Pradhan A (2007) Obesity, metabolic syndrome, and type 2 diabetes: inflammatory basis of glucose metabolic disorders. Nutr Rev 65: S152–156. - PubMed

MeSH terms