. 2017 Jun;13(6):4077-4084.
doi: 10.3892/ol.2017.5967. Epub 2017 Mar 31.

Genomic analysis of drug resistant small cell lung cancer cell lines by combining mRNA and miRNA expression profiling

Affiliations

Genomic analysis of drug resistant small cell lung cancer cell lines by combining mRNA and miRNA expression profiling

Yitian Chen et al. Oncol Lett. 2017 Jun.

Abstract

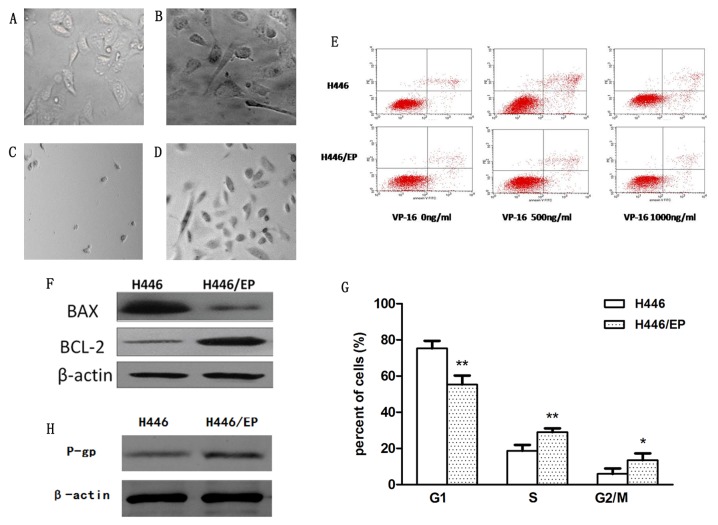
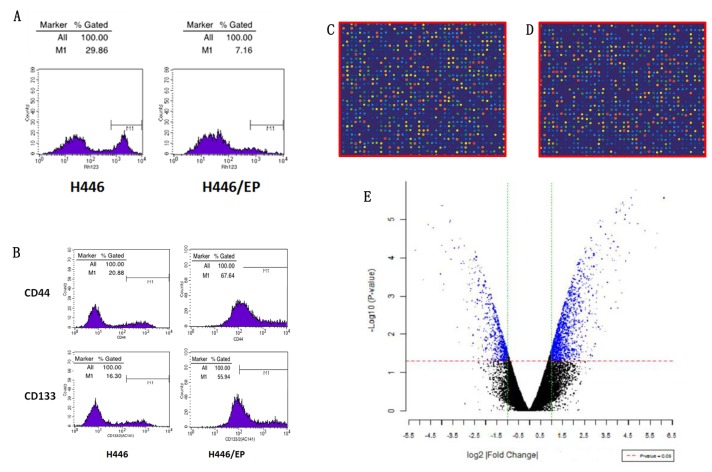
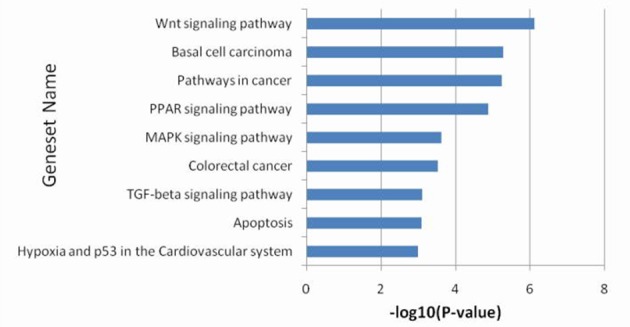
Etoposide (VP16) combined with cisplatin (DDP), as the first-line chemotherapy for small cell lung cancer (SCLC), regularly confers drug resistance. The present study applied complementary (c)DNA and micro (mi)RNA microarray to identify gene and miRNA expression profiles associated with multidrug resistance (MDR) in SCLC. The VP16/DDP (VP16 combined with DDP) resistant SCLC H446/EP cell line was derived from the parental H446 cell line by continuous exposure to increasing concentrations of etoposide and cisplatin. The mRNA and miRNA expression profiles between the resistant and parental SCLC cells were analyzed by Phalanx OneArray™ mRNA and miRNA microarray, and the results were confirmed by quantitative polymerase chain reaction. The expression levels of 75 genes were downregulated whilst 40 genes were upregulated in the H446/EP cell line compared with the H446 cell line. The expression levels of 16 miRNAs were upregulated whilst 15 were downregulated in the H446/EP cell line compared with the H446 cell line. Expression profile studies indicate that the particular mRNA and miRNA alteration demonstrated in MDR of SCLC may provide potential biomolecular targets for MDR reversion.

Keywords: VP-16; gene chips; multidrug resistance; platinol; small cell lung cancer.


Figures

Figure 1.
Figure 1.
Phenotypic diversity of (A) H446 and (B) H446/EP cell lines was observed under inverted-microscope at magnification, ×400. Subsequent to incubation with VP16 and DDP in the dose of 1 µg/ml. (C) H446 cells and (D) H446/EP cells were observed under inverted-microscope, magnification ×100. (E) Apoptosis was determined by flow cytometric analysis of Annexin-V/PI staining. (F) Western blot analysis demonstrated lower apoptotic rates in the H446/EP cells compared with the H446 cells subsequent to treatment with VP-16 for 72 h. (G) Flow cytometric analysis demonstrated different cell cycle distribution between the H446 and H446/EP cell lines. *P<0.05, **P<0.01. (H) Western blot analysis demonstrated the excretion of P-gP was increased in the H446/EP cell line compared with the H446 cell line. VP-16, Etoposide; BCL-2, B-cell lymphoma 2; BAX, BCL-2-like protein 4; P-gp, P-glycoprotein. G1, cell cycle phase G1; S cell cycle phase S; G2/M, cell cycle G2/metaphase.
Figure 2.
Figure 2.
(A) Detecting accumulation of rhodamine via fluorescence demonstrated a lower accumulation of rhodamine in the H446/EP cell line compared with the H446 cell line. (B) Flow cytometry was used to quantitate the CD44 and CD133 expression. (C and D) Fluorescent exchange experiment: Green point represents Cy3 fluorescein, red dots represents Cy5 fluorescein. (E) Volcano diagram was depicted with the abscissa of log2 (fold change) and the ordinate of -log10 (P-value), using the filter conditions (>1 times fold change and P<0.05). CD, cluster of differentiation; Cy, cyanine.
Figure 3.
Figure 3.
[(A) Polymerase chain reaction amplification and melting curves. (i, ii) amplification curves and melting curves of H446 cells. (iii, iv) amplification curves and melting curves of H446/EP cells]. (B) Fold change expressions of mRNAs between H446/EP and H446 cells. The top 10 increased and 10 decreased genes were illustrated. (C) Histogram of fold change. (D) The volcano plot of H446 vs. H446/EP cells. Standard selection criteria to identify differentially expressed genes are established at a fold change ≥0.585 and P<0.05. (E) Heat map of 31 microRNAs that increased or decreased in expression at least 2-fold in the H446/EP cells compared with their expression in the H446 cells (columns: Cell lines; rows: Probe sets). Heat map indicates high or low expression relative to mean, as demonstrated in the scale. (C) blue dots, differentially expressed genes; (E) Red, high expression level; green, low expression level.
Figure 4.
Figure 4.
Gene set enrichment analysis of pathway was performed according to the top 10 differentially expressed genes. PPAR, peroxisome proliferator-activated receptor; MAPK, mitogen activated protein kinase; TGF, transforming growth factor.

References

    1. Torre LA, Bray F, Siegel RL, Ferlay J, Lortet-Tieulent J, Jemal A. Global cancer statistics, 2012. CA Cancer J Clin. 2015;65:87–108. doi: 10.3322/caac.21262. - DOI - PubMed
    1. Siegel R, Ma J, Zou Z, Jemal A. Cancer statistics, 2014. CA Cancer J Clin. 2014;64:9–29. doi: 10.3322/caac.21208. - DOI - PubMed
    1. Lara PN, Jr, Chansky K, Shibata T, Fukuda H, Tamura T, Crowley J, Redman MW, Natale R, Saijo N, Gandara DR. Common arm comparative outcomes analysis of phase 3 trials of cisplatin + irinotecan versus cisplatin + etoposide in extensive stage small cell lung cancer: Final patient-level results from Japan Clinical Oncology Group 9511 and Southwest Oncology Group 0124. Cancer. 2010;116:5710–5715. doi: 10.1002/cncr.25532. - DOI - PMC - PubMed
    1. Longley DB, Johnston PG. Molecular mechanisms of drug resistance. J Pathol. 2005;205:275–292. doi: 10.1002/path.1706. - DOI - PubMed
    1. Luqmani YA. Mechanisms of drug resistance in cancer chemotherapy. Med Princ Pract. 2005;14(Suppl 1):S35–S48. doi: 10.1159/000086183. - DOI - PubMed