. 2017 May;141(5):3379.
doi: 10.1121/1.4983191.

Neural representation of the self-heard biosonar click in bottlenose dolphins (Tursiops truncatus)

Affiliations

Neural representation of the self-heard biosonar click in bottlenose dolphins (Tursiops truncatus)

James J Finneran et al. J Acoust Soc Am. 2017 May.

Abstract

The neural representation of the dolphin broadband biosonar click was investigated by measuring auditory brainstem responses (ABRs) to "self-heard" clicks masked with noise bursts having various high-pass cutoff frequencies. Narrowband ABRs were obtained by sequentially subtracting responses obtained with noise having lower high-pass cutoff frequencies from those obtained with noise having higher cutoff frequencies. For comparison to the biosonar data, ABRs were also measured in a passive listening experiment, where external clicks and masking noise were presented to the dolphins and narrowband ABRs were again derived using the subtractive high-pass noise technique. The results showed little change in the peak latencies of the ABR to the self-heard click from 28 to 113 kHz; i.e., the high-frequency neural responses to the self-heard click were delayed relative to those of an external, spectrally "pink" click. The neural representation of the self-heard click is thus highly synchronous across the echolocation frequencies and does not strongly resemble that of a frequency modulated downsweep (i.e., decreasing-frequency chirp). Longer ABR latencies at higher frequencies are hypothesized to arise from spectral differences between self-heard clicks and external clicks, forward masking from previously emitted biosonar clicks, or neural inhibition accompanying the emission of clicks.


Figures
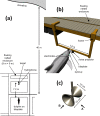
FIG. 1.
FIG. 1.
(Color online) (a) Testing was conducted in a floating, netted enclosure in San Diego Bay, with the dolphin positioned on a “biteplate” apparatus facing a physical target and recording hydrophone. (b) Schematic of dolphin positioned on biteplate while wearing “eyecups” to prevent visual inspection of target, and surface electrodes embedded in suction cups for ABR measurement. (c) The biosonar target was constructed from two hollow cones joined at their apices. The dolphin was conditioned to report a change in target orientation from aspect “A” to aspect “B.”
FIG. 2.
FIG. 2.
(a) In the biosonar task, ABRs to the dolphin's self-heard clicks were measured. At the same time, the dolphin's emitted biosonar clicks were used to trigger instances of masking noise bursts to mask a small proportion of the self-heard clicks. (b) In the passive listening task, ABRs were measured to external, spectrally pink clicks while HPN was simultaneously presented to the dolphin.
FIG. 3.
FIG. 3.
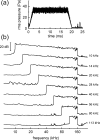
Derived, narrowband ABRs to the dolphin's self-heard biosonar click were obtained by masking 5% of the emitted clicks with a 20-ms noise burst with high-pass cutoff varied randomly from 10 to 113 kHz in 1/2-octave steps. (a) Representative example of the noise burst envelope. (b) Pressure spectral densities of representative noise bursts. The text legends indicate the high-pass cutoff frequency. Noise was equalized as spectrally pink, with a slope of −3 dB per octave within the passband.
FIG. 4.
FIG. 4.
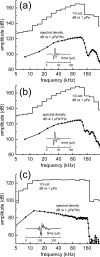
Representative examples of mean instantaneous sound pressure of biosonar clicks for (a) SAY and (b) TRO recorded in the farfield. (c) Representative example of spectrally pink click stimulus used in the passive listening tasks. The peSPL for this example was ∼145 dB re 1 μPa.
FIG. 5.
FIG. 5.
ABRs measured during the biosonar task with the dolphins (a) SAY and (b) TRO. For each dolphin, the top left panel shows the averaged ABRs measured in the presence of masking noise bursts with a low-pass cutoff frequency of 160 kHz and various high-pass cutoffs (specified with each trace). The unmasked condition was used in place of a 160-kHz HPN condition. For each noise condition, two averaged ABRs are shown, each based on one-half the total number of epochs obtained for each condition (Table I). Narrowband ABRs (top right panels) were derived by sequentially subtracting the ABRs obtained with noise having cutoff frequencies separated by one octave; i.e., the derived-band ABR from 56 to 113 kHz was obtained by subtracting the ABR obtained with 56-kHz HPN from the ABR obtained with 113 kHz. Symbols in the derived, narrowband ABRs indicate the specific peaks used for latency and amplitude measures. Vertical, dashed lines indicate the peak latencies for P1, P4, and N5 for the 80–160 kHz band. The bottom panel compares the unmasked ABR with the sum of the derived, narrowband ABRs based on a 1/2-octave bands (so there is no overlap between bands).
FIG. 6.
FIG. 6.
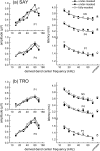
(Left panels) Narrowband ABR peak amplitudes and (right panel) latencies obtained during biosonar testing with the dolphins SAY and TRO. P1 amplitudes (left) showed little variation with frequency from 14 to 32 kHz and only small increases above 32 to 64 kHz. P4 amplitudes were relatively flat below 64 kHz, but increased sharply from 64 to 113 kHz. Derived-band latencies (right) showed little systematic change with frequency, especially P4 and N5 latencies at frequencies above 14 kHz. The solid lines in the right panel indicate the best fits of Eq. (1) to the latency data. In the right panel, symbols plotted at the abscissa position labeled “unmask” indicate the peak latencies of the unmasked ABRs.
FIG. 7.
FIG. 7.
ABRs measured during the passive listening task for the dolphins (a) SAY and (b) TRO showing the effects of under-masking. For each subject, the two left panels show four ABR measurements, each based on 1024 epochs, measured in the presence of HPN with various cutoff frequencies (denoted by text legends), for the fully and under-masked conditions. Narrowband ABRs (right panels) were derived by sequentially subtracting the ABRs obtained with noise having cutoff frequencies separated by one octave. Solid lines and dashed lines represent the narrowband ABRs from the under-masked and fully masked conditions, respectively. Filled and open circles indicate the specific values for the ABR peak amplitudes and latencies extracted for analysis, for the under-masked and fully masked conditions, respectively. The narrowband ABRs from the second passive listening experiment that replicated the under-masked condition (right panels, thin solid lines and filled squares) are also shown. Vertical, dashed lines indicate the latencies of P1, P4, and N5 for the 80–160 kHz band in the under-masked condition.
FIG. 8.
FIG. 8.
Comparison of unmasked ABRs with the sums of the derived, narrowband ABRs, based on 1/2-octave bands, obtained during the passive listening task. The similarity between the ABR waveforms in each case confirms that the unmasked ABR can be represented by the linear sum of the individual derived-band ABRs, i.e., that the masking noise was effective in limiting the spread of activation to higher-frequency cochlear regions, and that significant over-masking (apical spread of masking) did not occur.
FIG. 9.
FIG. 9.
Narrowband ABR peak amplitudes and latencies measured for the dolphins (a) SAY and (b) TRO in the first passive listening experiment show the effects of under-masking on the shapes of the amplitude and latency functions to be minimal. No systematic differences occur in the narrowband ABR amplitudes between the under-masked and fully masked conditions, and no significant effects of under-masking are seen on the shapes of the latency functions; i.e., latency functions for SAY were identical for the under-masked and fully masked conditions, and TRO's latency functions for the under-masked condition were parallel to those for the fully masked condition, but shifted by 40 μs. In the right panels, symbols plotted at the abscissa position labeled “unmask” indicate the peak latencies of the unmasked ABRs.
FIG. 10.
FIG. 10.
Narrowband ABR amplitudes for (a) SAY and (b) TRO measured during the second passive listening task. The same data are shown as functions of derived-band center frequency (upper panels) and stimulus peSPL (lower panels).
FIG. 11.
FIG. 11.
Narrowband ABR peak latencies for (a) SAY and (b) TRO measured during the second passive listening task. The solid lines show the best linear fits to the latency vs peSPL data. Series with only two data points were excluded from curve-fits. The values for P1 data for SAY at 125 and 130 dB were also excluded from fitting; the discontinuous nature of the latency data suggested a shift in the measured peak due to peak splitting.
FIG. 12.
FIG. 12.
Comparison of narrowband ABR waveforms obtained during the biosonar and passive listening (under-masked) tasks. For the lower frequency bands, the peak latencies for the biosonar and passive listening data are similar; however, there are substantial latency differences in the higher frequency bands.
FIG. 13.
FIG. 13.
Comparison of narrowband ABR peak amplitudes and latencies for the biosonar and passive listening (under-masked) tasks. Data for SAY and TRO are averaged. Latencies are similar at the lowest frequencies; however, the biosonar latencies show little change with frequency above 28 kHz, indicating that the dolphin's self-heard click is not represented neurally as an FM downsweep, but retains its impulsive nature.
FIG. 14.
FIG. 14.
To assess whether the pulsed masker influenced the latency shift between the passive listening and biosonar data, a limited amount of passive listening data were collected using noise burst maskers with temporal envelopes and jitter matching that used in the biosonar experiment. Both sets of passive listening data showed greater latency change with frequency compared to the biosonar data, indicating that the latency patterns of the derived, narrowband ABRs did not appear to be fundamentally affected by the use of pulsed masking noise.

Similar articles

Cited by

References

    1. Au, W. W. L. (1993). The Sonar of Dolphins ( Springer-Verlag, New York: ), 227 pp.
    1. Au, W. W. L. , and Martin, S. W. (2012). “ Why dolphin biosonar performs so well in spite of mediocre ‘equipment,’ ” IET Radar, Sonar Navig. 6, 566−575.10.1049/iet-rsn.2011.0194 - DOI
    1. Au, W. W. L. , and Simmons, J. A. (2007). “ Echolocation in dolphins and bats,” Phys. Today 60(9), 40−45.10.1063/1.2784683 - DOI
    1. Borg, E. , and Zakrisson, J. E. (1975). “ The activity of the stapedius muscle in man during vocalization,” Acta Otolaryngol. 79, 325–333.10.3109/00016487509124694 - DOI - PubMed
    1. Burkard, R. (1984). “ Sound pressure level measurement and spectral analysis of brief acoustic transients,” Electroencephalogr. Clin. Neurophysiol. 57, 83–91.10.1016/0013-4694(84)90010-5 - DOI - PubMed

Publication types

MeSH terms

LinkOut - more resources