Randomized Controlled Trial
. 2017 Jun 9;16(1):75.
doi: 10.1186/s12933-017-0554-2.

Multipolar pacing by cardiac resynchronization therapy with a defibrillators treatment in type 2 diabetes mellitus failing heart patients: impact on responders rate, and clinical outcomes

Affiliations
Randomized Controlled Trial

Multipolar pacing by cardiac resynchronization therapy with a defibrillators treatment in type 2 diabetes mellitus failing heart patients: impact on responders rate, and clinical outcomes

Celestino Sardu et al. Cardiovasc Diabetol. .

Abstract

Background: Type 2 diabetes mellitus (T2DM) is a multi factorial disease, affecting clinical outcomes in failing heart patients treated by cardiac resynchronization therapy with a defibrillator (CRT-d).

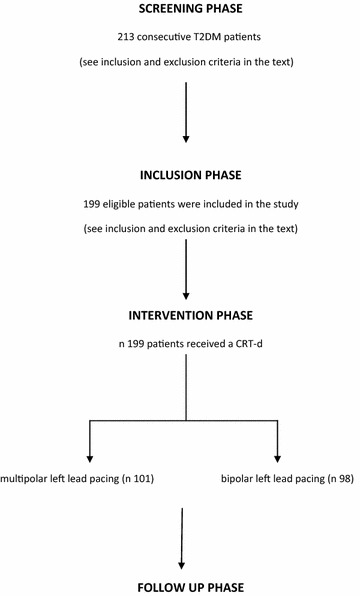
Methods: One hundred and ninety-five T2DM patients received a CRT-d treatment. Randomly the study population received a CRT-d via multipolar left ventricle (LV) lead pacing (n 99, multipolar group), vs a CRT-d via bipolar LV pacing (n 96, bipolar group). These patients were followed by clinical, and instrumental assessment, and telemetric device control at follow up. In this study we evaluated, in a population of failing heart T2DM patients, cardiac deaths, all cause deaths, arrhythmic events, CRT-d responders rate, hospitalizations for HF worsening, phrenic nerve stimulation (PNS), and LV catheter dislodgment events (and re-intervention for LV catheter re-positioning), comparing multipolar CRT-d vs bipolar CRT-d group of patients at follow up.

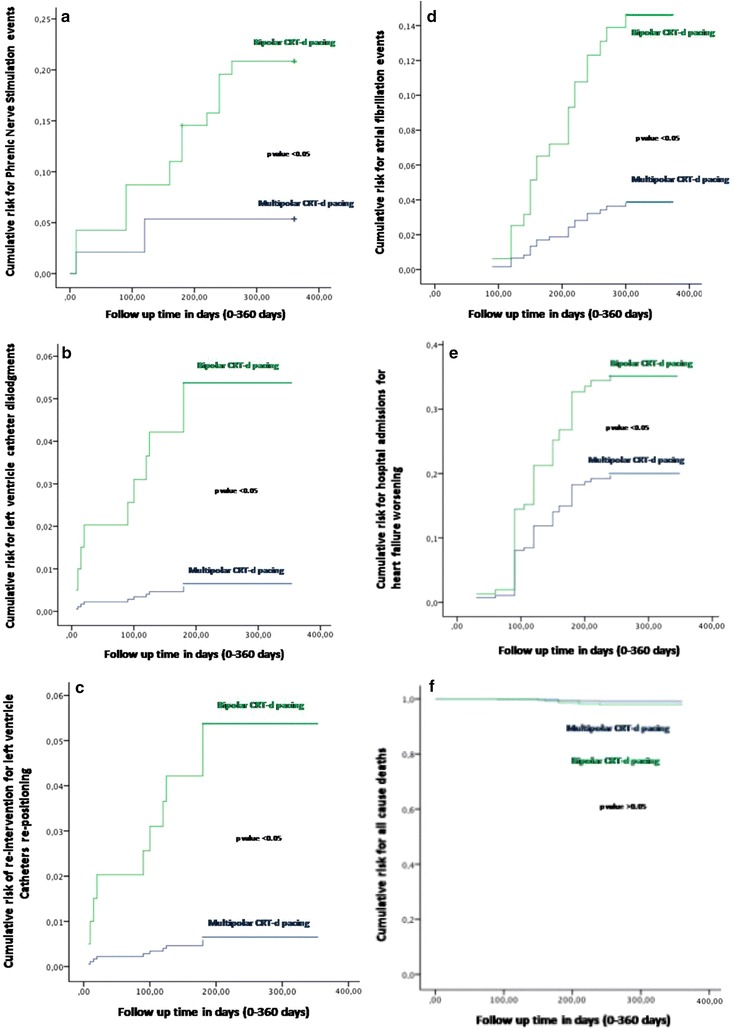
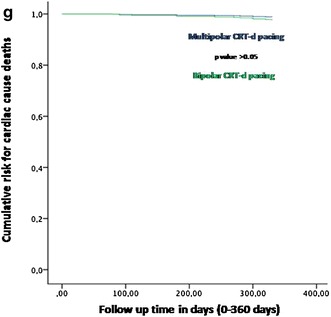
Results: At follow up there was a statistical significant difference about atrial arrhythmic events [7 (7%) vs 16 (16.7%), p value 0.019], hospitalizations for HF worsening [15 (15.2% vs 24 (25%), p value 0.046], LV catheter dislodgments [1 (1%) vs 9 (9.4%), p value 0018], PNS [5 (5%) vs 18 (18.7%), p value 0.007], and LV re-positioning [1 (1%) vs 9 (9.4%), p value 0.018], comparing multipolar CRT-d vs bipolar CRT-d group of patients. Multipolar pacing was an independent predictor of all these events.

Conclusions: CRT-d pacing via multipolar LV lead vs bipolar LV lead may reduce arrhythmic burden, hospitalization rate, PNS, LV catheters dislodgments, and re-interventions in T2DM failing heart patients. Clinical trial number NCT03095196.


Figures

Fig. 1
Fig. 1
In this figure study flow chart representation. The study was conducted by the following phases: screening phase, inclusion phase, intervention phase, follow up phase. In the screening phase, 213 consecutive T2DM patients [with chronic heart failure lasting for at least 3 months, New York Heart Association (NYHA) functional class II or III, left bundle brunch block, severe left ventricle ejection fraction reduction (LVEF < 35%)], and an indication for cardiac resynchronization therapy with a defibrillator (CRT-d) treatment, were screened to be included in the study (see the inclusion and exclusion criteria in the text). In the inclusion phase 199 patients of this screened population were identified, and included for participation in this study (see inclusion and exclusion criteria in the text). This phase was followed by intervention phase, in that 199 patients received a CRT-d device implant. The CRT-d implant was randomly performed by multipolar (n 101 patients) vs bipolar (n 98 patients) left ventricle pacing lead. After the CRT-d treatment these patients were ambulatory monitored by clinical and instrumental assessment as described in the text during follow up phase. Nine nine patients in multipolar CRT group vs 96 patients in the bipolar CRT group completed the follow up (two patients have refused to participate in the study, one have refused to receive a CRT-d, and one have been lost at follow up)
Fig. 2
Fig. 2
In this figure the representation of cumulative survival events free curves for study endpoints, by Cox regression analysis curves. The figure is structured in seven parts, as af, Fig. 3. In green color the bipolar group, in blue color the multipolar group for each figure part. The symbol asterisk was marking a statistical significant event, as indicated by a p value <0.05. In the part a of the figure, the curve representation of Phrenic Nerve stimulation events as “cumulative risk for Phrenic Nerve stimulation” (on y axis) during 360 days follow up (on x axis) comparing multipolar vs bipolar group. In the part b of the figure, the curve representation of catheter dislocation events as “cumulative risk for catheter dislodgement events” (on y axis) during 360 days follow up (on x axis) comparing multipolar vs bipolar group. In the part c of the figure, the curve representation of re-interventions for left ventricle lead re-positioning after dislodgment as “cumulative risk for re-interventions for left ventricle catheter re-positioning” (on y axis) during 360 days follow up (on x axis) comparing multipolar vs bipolar group. In the part d of the figure, the curve representation of hospital admission events as “cumulative risk for hospital admissions events” (on y axis) during 360 days follow up (on x axis) comparing multipolar vs bipolar group. In the part e of the figure, the curve representation of atrial fibrillation events as “cumulative risk for atrial fibrillation events” (on y axis) during 360 days follow up (on x axis) comparing multipolar vs bipolar group. In the part f of the curve, the representation of all cause of deaths events as “cumulative risk for all cause of deaths events” (on y axis) during 360 days follow up (on x axis) comparing multipolar vs bipolar group
Fig. 3
Fig. 3
In this figure the representation of cumulative survival events free curves for study endpoints, by Cox regression analysis curves. In the part of the curve, the representation of cardiac deaths events as “cumulative risk for cardiac deaths events” (on y axis) during 360 days follow up (on x axis) comparing multipolar vs bipolar group

References

    1. Huang ES, Laiteerapong N, Liu JY, John PM, Moffet HH, Karter AJ. Rates of complications and mortality in older patients with diabetes mellitus: the diabetes and aging study. JAMA Intern Med. 2014;174(2):251–258. doi: 10.1001/jamainternmed.2013.12956. - DOI - PMC - PubMed
    1. Devereux RB, Roman MJ, Paranicas M, O’Grady MJ, Lee ET, Welty TK, Fabsitz RR, Robbins D, Rhoades ER, Howard BV. Impact of diabetes on cardiac structure and function: the Strong Heart Study. Circulation. 2000;101:2271–2276. doi: 10.1161/01.CIR.101.19.2271. - DOI - PubMed
    1. Kannel WB, McGee DL. Diabetes and cardiovascular disease: the Framingham study. JAMA. 1979;241:2035–2038. doi: 10.1001/jama.1979.03290450033020. - DOI - PubMed
    1. Lind M, Bounias I, Olsson M, Gudbjornsdottir S, Svenson AM, Rosengren A. Glycaemic control and incidence of heart failure in 20985 patients with type 1 diabetes: an observational study. Lancet. 2011;378:140–146. doi: 10.1016/S0140-6736(11)60471-6. - DOI - PubMed
    1. Moss AJ, Jackson Hall W, Cannom DS, Klein H, Brown MW, James WS, Daubert P, Mark Estes NA, Foster E, Greenberg H, Higgins SL, Pfeffer MA, Solomon SD, Wilber D, Zareba W, for the MADIT-CRT Trial Investigators* Cardiac-resynchronization therapy for the prevention of heart-failure events. N Engl J Med. 2009;361:1329–1338. doi: 10.1056/NEJMoa0906431. - DOI - PubMed

Publication types

MeSH terms

Associated data