

A High-Density Genetic Linkage Map and QTL Fine Mapping for Body Weight in Crucian Carp (Carassius auratus) Using 2b-RAD Sequencing
- PMID: 28600439
- PMCID: PMC5555455
- DOI: 10.1534/g3.117.041376
A High-Density Genetic Linkage Map and QTL Fine Mapping for Body Weight in Crucian Carp (Carassius auratus) Using 2b-RAD Sequencing
Abstract
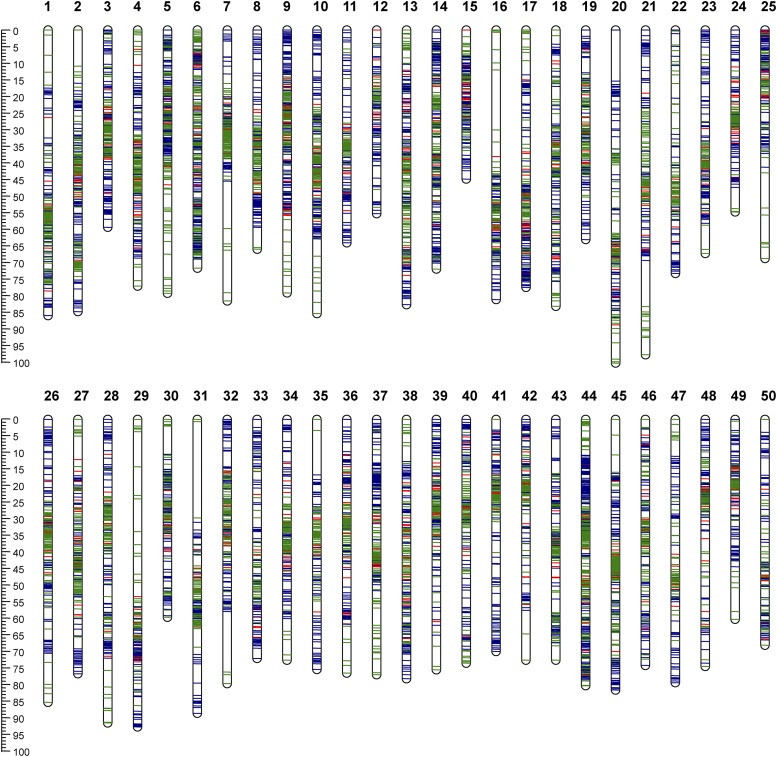
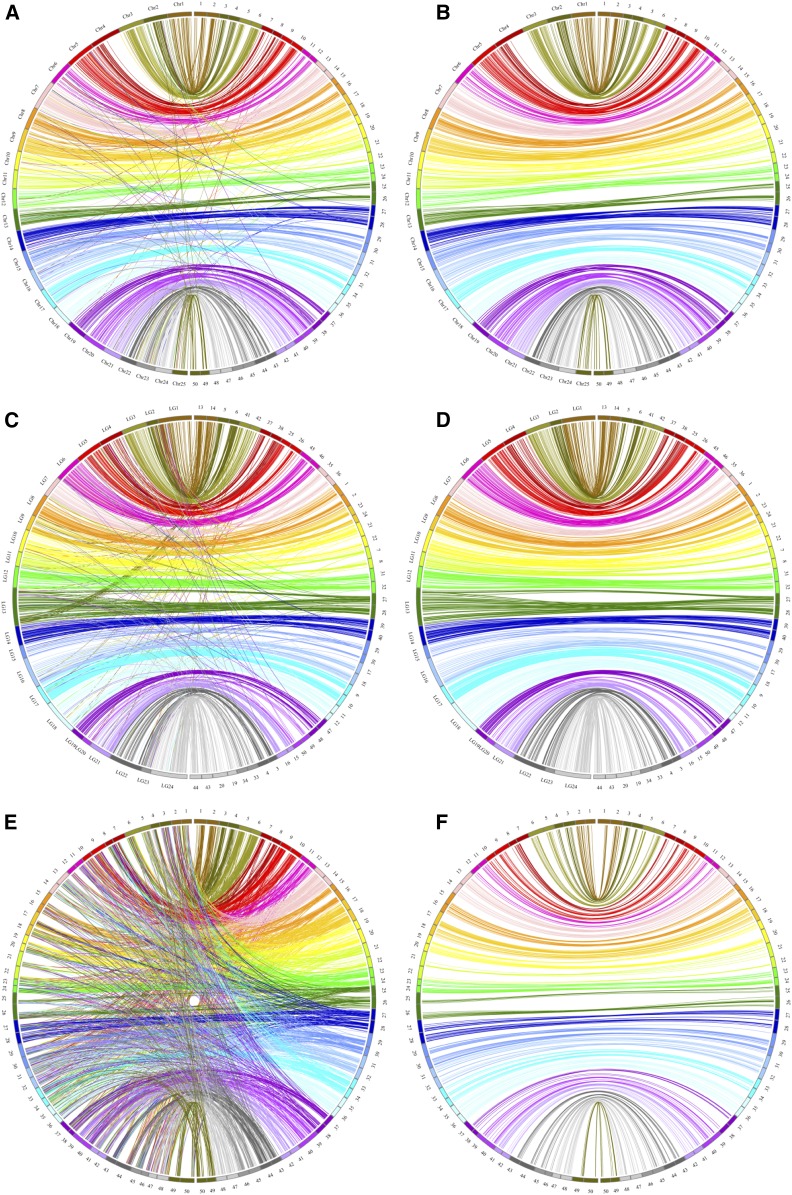
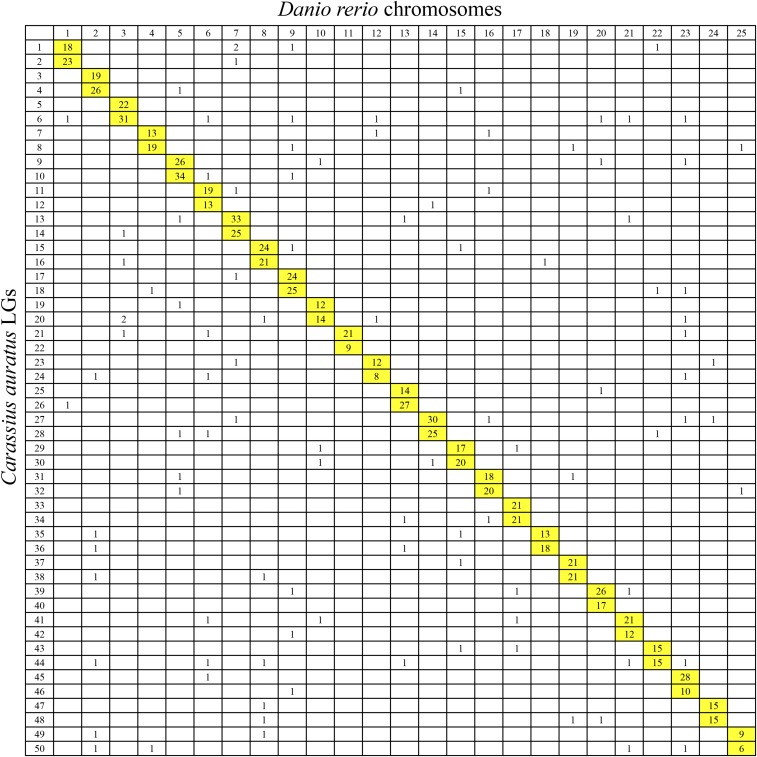
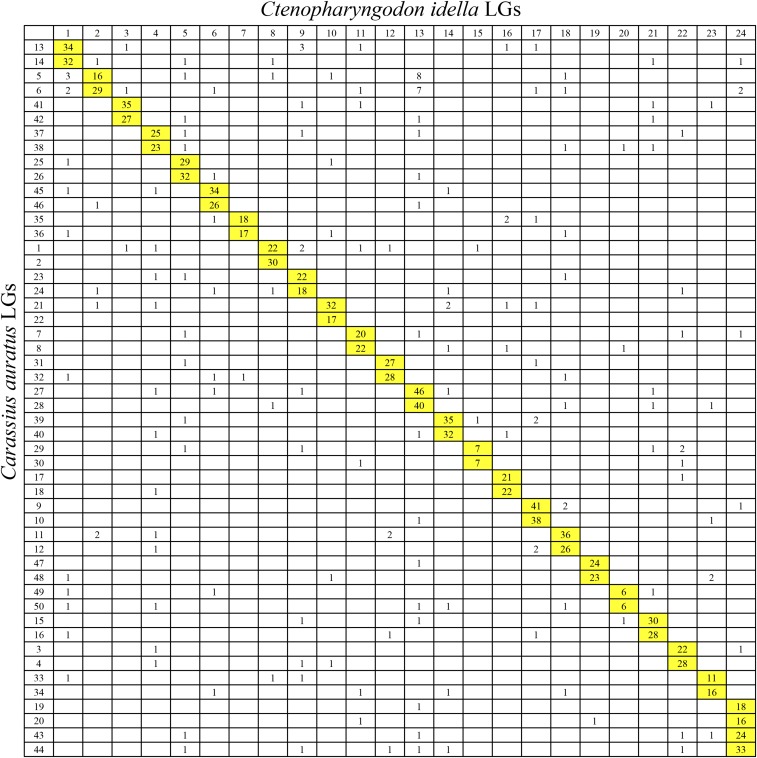
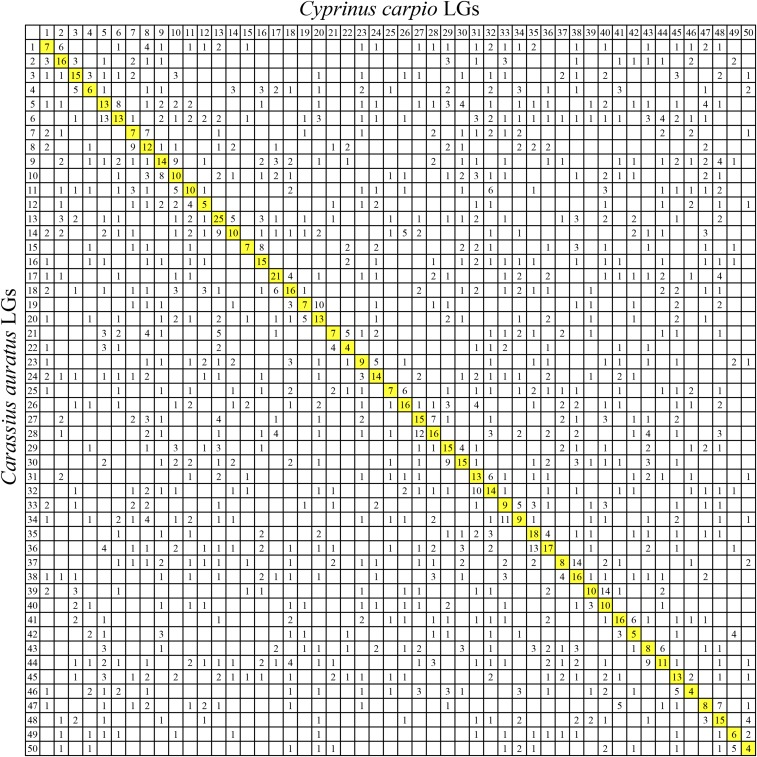
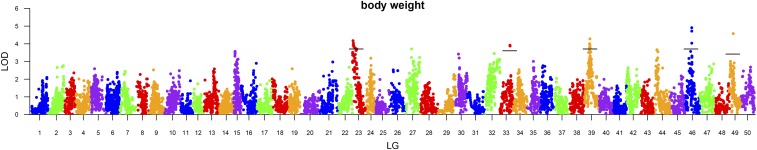
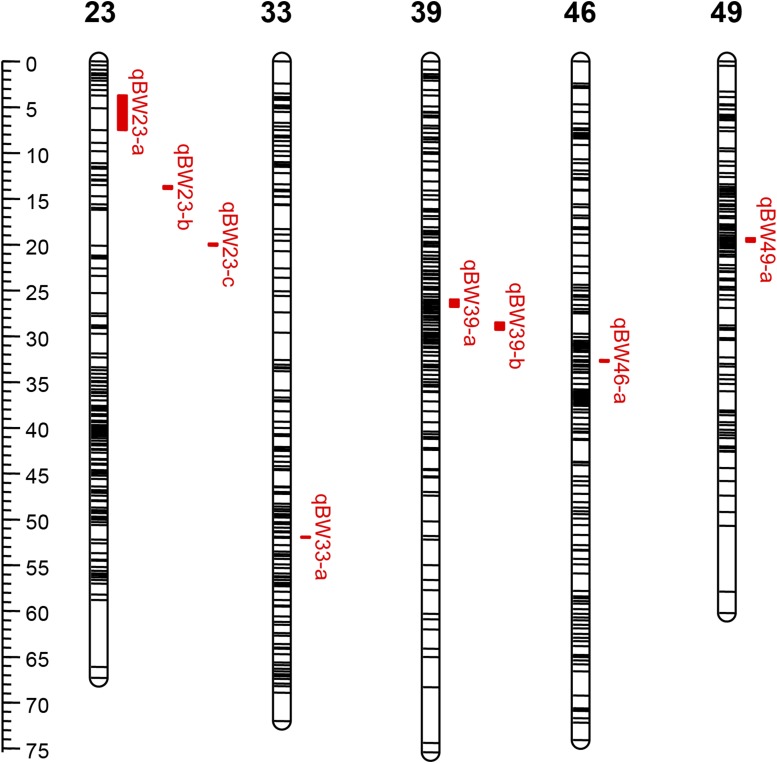
A high-resolution genetic linkage map is essential for a wide range of genetics and genomics studies such as comparative genomics analysis and QTL fine mapping. Crucian carp (Carassius auratus) is widely distributed in Eurasia, and is an important aquaculture fish worldwide. In this study, a high-density genetic linkage map was constructed for crucian carp using 2b-RAD technology. The consensus map contains 8487 SNP markers, assigning to 50 linkage groups (LGs) and spanning 3762.88 cM, with an average marker interval of 0.44 cM and genome coverage of 98.8%. The female map had 4410 SNPs, and spanned 3500.42 cM (0.79 cM/marker), while the male map had 4625 SNPs and spanned 3346.33 cM (0.72 cM/marker). The average recombination ratio of female to male was 2.13:1, and significant male-biased recombination suppressions were observed in LG47 and LG49. Comparative genomics analysis revealed a clear 2:1 syntenic relationship between crucian carp LGs and chromosomes of zebrafish and grass carp, and a 1:1 correspondence, but extensive chromosomal rearrangement, between crucian carp and common carp, providing evidence that crucian carp has experienced a fourth round of whole genome duplication (4R-WGD). Eight chromosome-wide QTL for body weight at 2 months after hatch were detected on five LGs, explaining 10.1-13.2% of the phenotypic variations. Potential candidate growth-related genes, such as an EGF-like domain and TGF-β, were identified within the QTL intervals. This high-density genetic map and QTL analysis supplies a basis for genome evolutionary studies in cyprinid fishes, genome assembly, and QTL fine mapping for complex traits in crucian carp.
Keywords: QTL; SNP; candidate growth gene; comparative genomics; crucian carp; genetic linkage map.
Copyright © 2017 Liu et al.
Figures
References
-
- Allendorf F. W., Thorgaard G. H., 1984. Tetraploidy and the evolution of salmonid fishes, pp. 1–53 in Evolutionary Genetics of Fishes. Plenum Press, New York, NY.
-
- Bergero R., Charlesworth D., 2009. The evolution of restricted recombination in sex chromosomes. Trends Ecol. Evol. 24: 94–102. - PubMed
Publication types
MeSH terms
Substances
LinkOut - more resources
Full Text Sources
Other Literature Sources
Research Materials