Review
. 2017 Oct:139:191-203.
doi: 10.1016/j.visres.2017.05.006. Epub 2017 Jun 21.

OCT angiography and visible-light OCT in diabetic retinopathy

Affiliations
Review

OCT angiography and visible-light OCT in diabetic retinopathy

Peter L Nesper et al. Vision Res. 2017 Oct.

Abstract

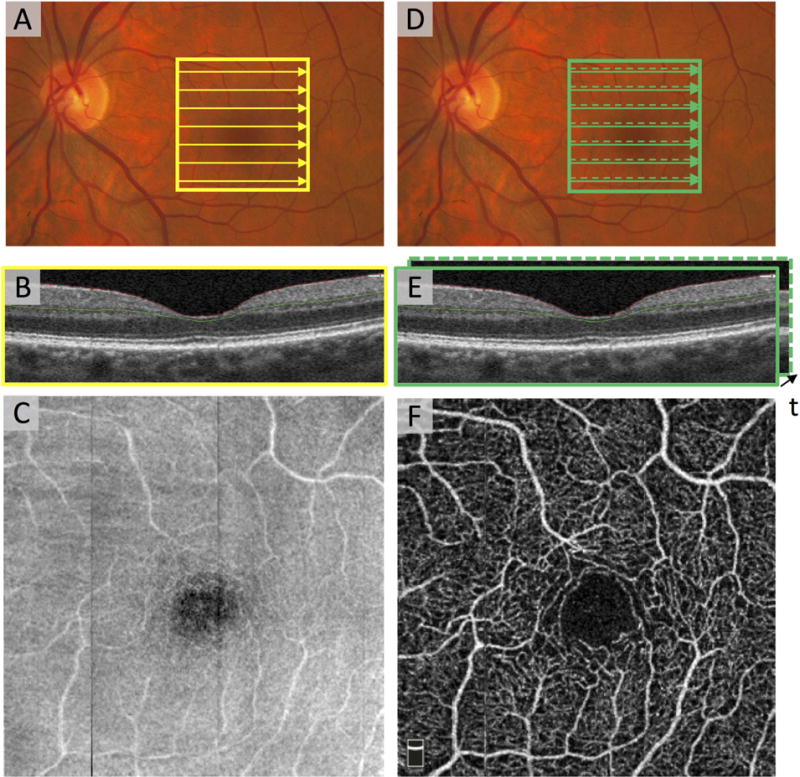
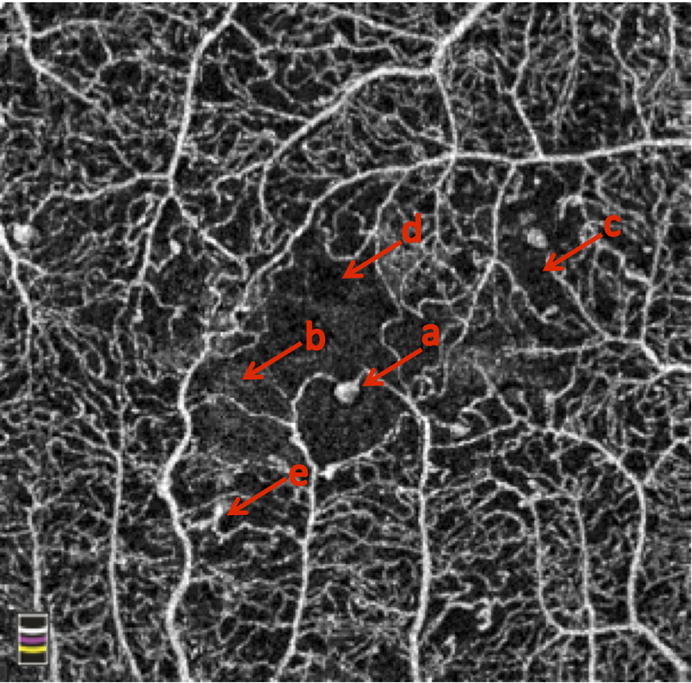
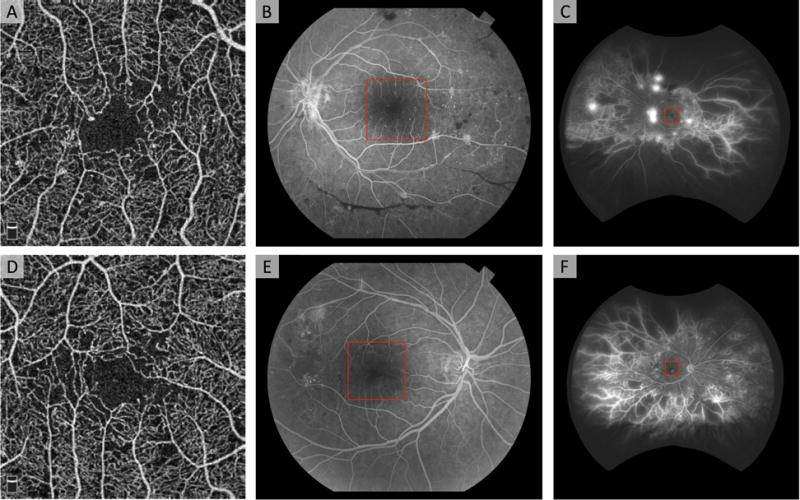
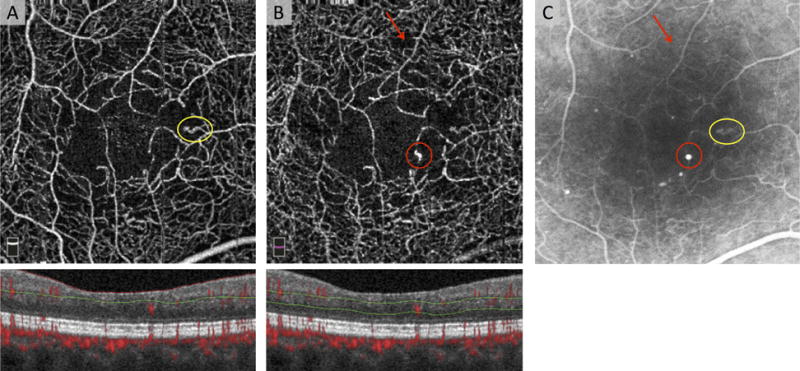
In recent years, advances in optical coherence tomography (OCT) techniques have increased our understanding of diabetic retinopathy, an important microvascular complication of diabetes. OCT angiography is a non-invasive method that visualizes the retinal vasculature by detecting motion contrast from flowing blood. Visible-light OCT shows promise as a novel technique for quantifying retinal hypoxia by measuring the retinal oxygen delivery and metabolic rates. In this article, we discuss recent insights provided by these techniques into the vascular pathophysiology of diabetic retinopathy. The next milestones for these modalities are large multicenter studies to establish consensus on the most reliable and consistent outcome parameters to study diabetic retinopathy.

Keywords: Diabetic retinopathy; Imaging; OCT; OCT angiography; Retina; Visible-light OCT.


Conflict of interest statement

Conflict of Interest: No conflicting relationship exists for all other authors.

Figures

Figure 1
Figure 1. Scanning Patterns Used in OCT and OCTA
(A) Fundus photograph of the macula and optic nerve head in a healthy eye. The solid yellow box denotes 3×3 mm2, which was imaged by OCT. The yellow arrows depict the path that the illumination beam takes as it raster scans. The scanning density along the y direction is sparse for illustration purposes. (B) The OCT B-scan corresponding to arrow across the fovea in (A). (C) The en face OCT acquired from the region in (A). (D) The solid green box indicates a region on the macula imaged with OCTA. The green solid arrow and green dashed arrow indicate the first and second B-scan locations for OCTA. (E) The two co-localized B-scans are separated in time. (F) Co-localized B-scans are fed into an OCTA algorithm to produce en face OCTA image of the region.
Figure 2
Figure 2. Common Features of Diabetic Retinopathy on OCTA
(a) microaneurysms, (b) enlarged foveal avascular zone, (c) non-perfusion, (d) edema, (e) abnormal vascular loops.
Figure 3
Figure 3. Field of View Limitations in OCTA Shown in Two Eyes with Proliferative Diabetic Retinopathy
(A, D) En face 3 × 3 mm2 OCTA image of the superficial capillary plexus reveals mild diabetic changes including enlarged foveal avascular zone, areas of non-perfusion, and microaneurysms. (B, E) Fluorescein angiography obtained with fundus camera (50° field of view) reveals hemorrhages and neovascularization (NV) in B, and non-perfusion and NV in E. (C, F) Fluorescein angiography obtained with Optos wide-field imaging (200° field of view) reveals extensive peripheral non-perfusion and NV.
Figure 4
Figure 4. OCTA and Fluorescein Angiography (FA) of Diabetic Retinopathy
OCTA of the (A) superficial capillary plexus (SCP), and (B) deep capillary plexus (DCP) with cross-sectional OCTA below including red flow overlay, and red and green segmentation boundaries. Note that many of the vessels in the SCP (A) are also seen in the DCP (B) due to projection artifact. (C) Corresponding FA. The yellow circle on in C corresponds to an abnormal, dilated capillary loop that is seen in the SCP (A). This loop is also seen in the DCP, but this is likely due to projection artifact. The red circle in C corresponds to a microaneurysm that is only visible in the DCP (B). The red arrow points to an area of capillary non-perfusion that is better delineated with OCTA, but is not appreciated as clearly on FA due to dye leakage.
Figure 5
Figure 5. Quantifying Vessel Density in OCTA Images
(A) An example of an en face 3×3 mm2 region centered on the healthy human fovea. (B) A thresholded image shows the binarized vasculature in green. (C) After skeletonization, the vessel centerlines are determined. The vessel centerlines are shown as green lines overlayed on top of the en face OCTA. (D) The vessel density is calculated from the vessel skeleton.
Figure 6
Figure 6. Parafoveal Vessel Density Decreases and Foveal Avascular Zone (FAZ) Area Increases with Worsening Diabetic Retinopathy (DR) Severity
En face OCTA of the superficial (SCP, Top Row), middle (MCP, Middle Row), and deep capillary plexus (DCP, Bottom Row) of a healthy patient (Left Column), a patient with diabetes mellitus (DM) without DR (Left Middle Column), a patient with nonproliferative (NPDR, Right Middle Column), and a patient with proliferative (PDR, Right Column). The parafovea is defined as the percent area occupied by vessels between the two yellow circles overlaid on the healthy patient SCP. The FAZ area can be automatically or manually calculated and is defined as the avascular area of the central fovea, reported in mm2 (seen on the healthy patient MCP). The vessel density and FAZ area are seen below each angiogram.
Figure 7
Figure 7. Retinal Oximetry with vis-OCT
(A) An en face vis-OCT image from a healthy rat eye. A.U.: arbitrary units. (B) A full-spectrum vis-OCT B-scan from the white dashed line in (A). (C) For the vessel within the white dashed box in (B), fourteen split-spectrum B-scans were generated by ‘splitting the spectrum.’ The border around each split-spectrum B-scan represents the approximate color corresponding to the wavelengths split from the full-spectrum. The wavelengths ranged from 523 nm to 604 nm (D) After fitting the OCT signals at the bottom of white dashed circles in (C), the oxygen saturation of hemoglobin was found. The vessel in (C) had an oxygen saturation of 0.5, which indicates that it was a vein.
Figure 8
Figure 8. Structural Imaging of the Human Macula with vis-OCT
(A) An en face vis-OCT image of the optic nerve head in a healthy 23 year old volunteer. (B) An en face vis-OCT image of the macula in the same volunteer. (C) The vis-OCT B-scan of some major vessels superior to the optic nerve head corresponding to the blue dashed line in (A). (D) The vis-OCT B-scan of the fovea corresponding to the red dashed line in (B). BV: blood vessel. NFL: nerve fiber layer. GCL: ganglion cell layer. IPL: inner plexiform layer. OPL: outer plexiform layer. ONL: outer nuclear layer. ELM: external limiting membrane. IS/OS: inner segment/outer segment junction. OS: outer segments. RPE: retina pigment epithelium. BM: Bruch’s membrane. Scale bar: 2 degrees.

References

    1. Agemy SA, Scripsema NK, Shah CM, Chui T, Garcia PM, Lee JG, Gentile RC, Hsiao YS, Zhou Q, Ko T. Retinal Vascular Perfusion Density Mapping Using Optical Coherence Tomography Angiography in Normals and Diabetic Retinopathy Patients. Retina. 2015;35(11):2353–2363. - PubMed
    1. Al-Sheikh M, Akil H, Pfau M, Sadda SR. Swept-Source Oct Angiography Imaging of the Foveal Avascular Zone and Macular Capillary Network Density in Diabetic Retinopathyoct-Angiography in Diabetic Retinopathy. Investigative Ophthalmology & Visual Science. 2016;57(8):3907–3913. - PubMed
    1. An L, Shen TT, Wang RK. Using Ultrahigh Sensitive Optical Microangiography to Achieve Comprehensive Depth Resolved Microvasculature Mapping for Human Retina. Journal of Biomedical Optics. 2011;16(10) 106013. - PMC - PubMed
    1. Arend O, Wolf S, Harris A, Reim M. The Relationship of Macular Microcirculation to Visual Acuity in Diabetic Patients. Archives of Ophthalmology. 1995;113(5):610–614. - PubMed
    1. Arend O, Wolf S, Jung F, Bertram B, Pöstgens H, Toonen H, Reim M. Retinal Microcirculation in Patients with Diabetes Mellitus: Dynamic and Morphological Analysis of Perifoveal Capillary Network. British Journal of Ophthalmology. 1991;75(9):514–518. - PMC - PubMed

MeSH terms