. 2017 Jun 28;4(6):587-599.e4.
doi: 10.1016/j.cels.2017.05.009. Epub 2017 Jun 7.

An Optimized Shotgun Strategy for the Rapid Generation of Comprehensive Human Proteomes

Affiliations

An Optimized Shotgun Strategy for the Rapid Generation of Comprehensive Human Proteomes

Dorte B Bekker-Jensen et al. Cell Syst. .

Abstract

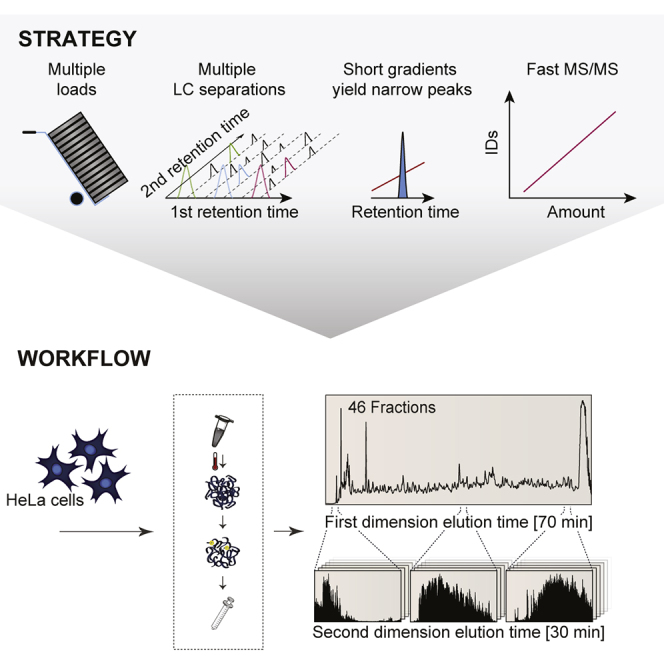
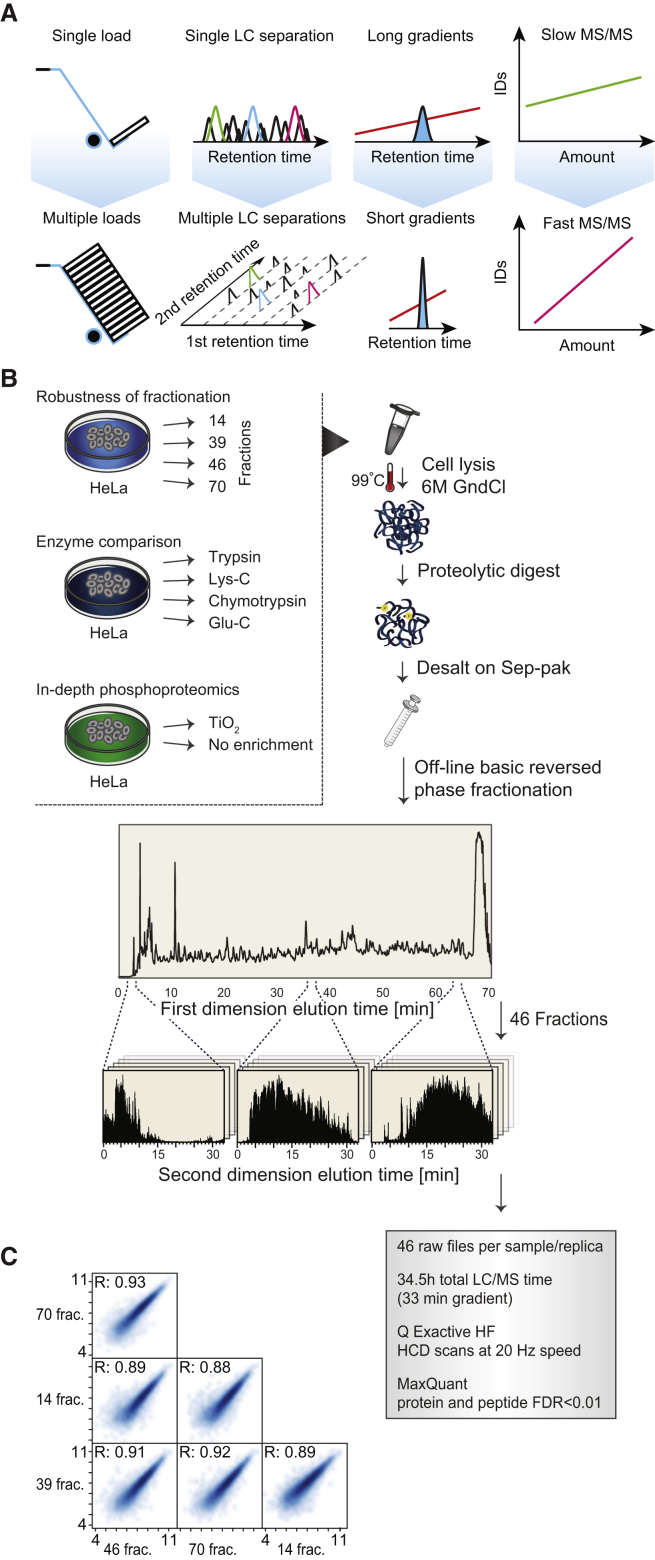
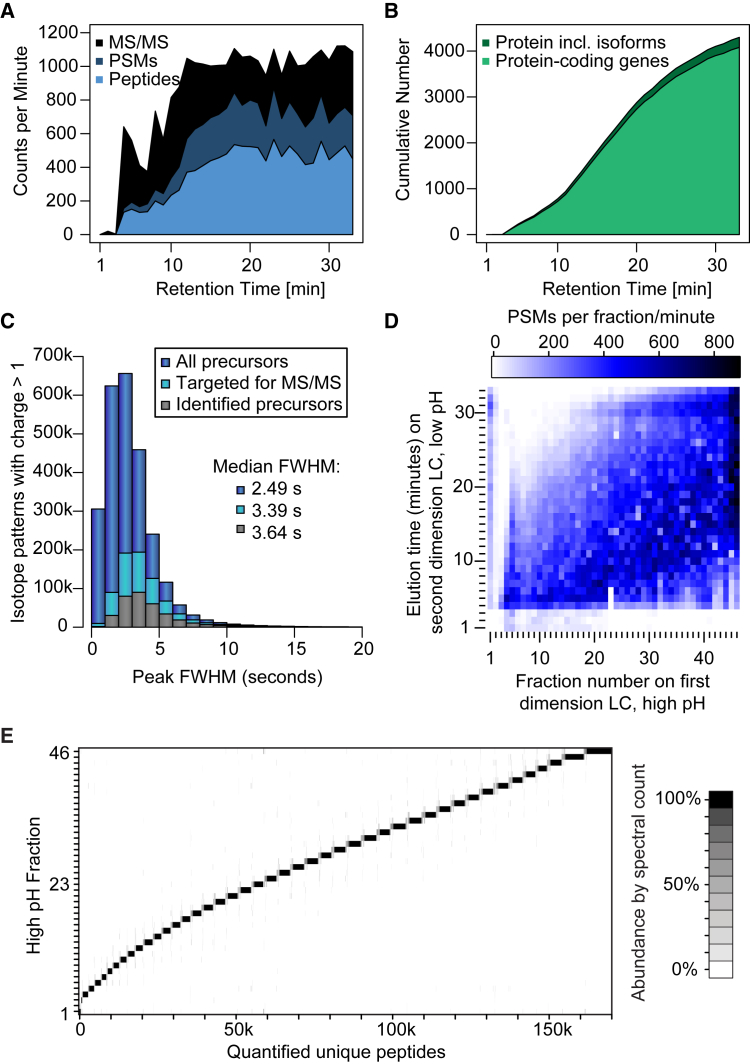
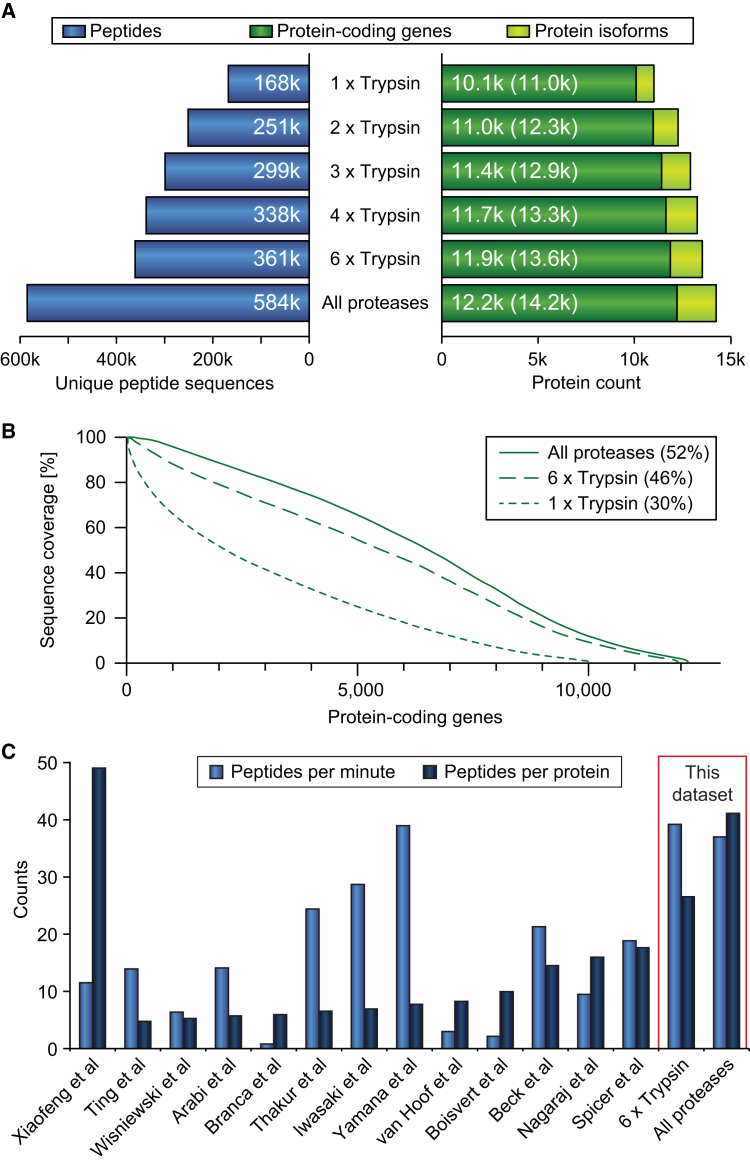
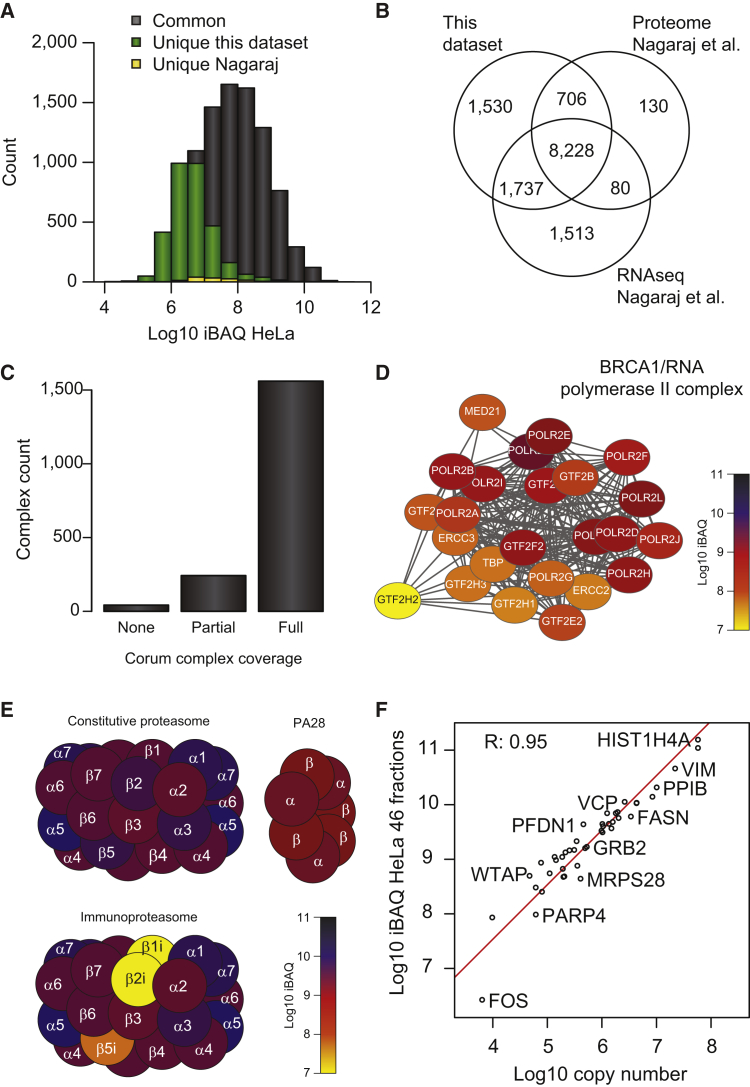
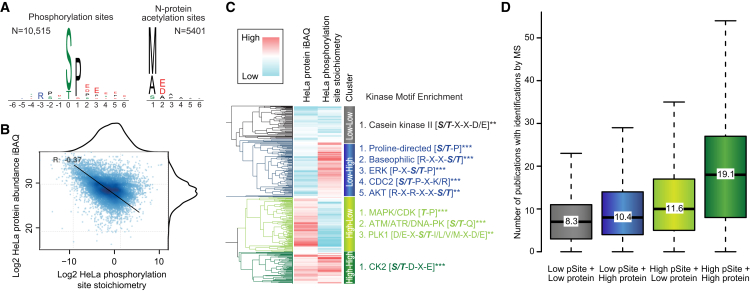
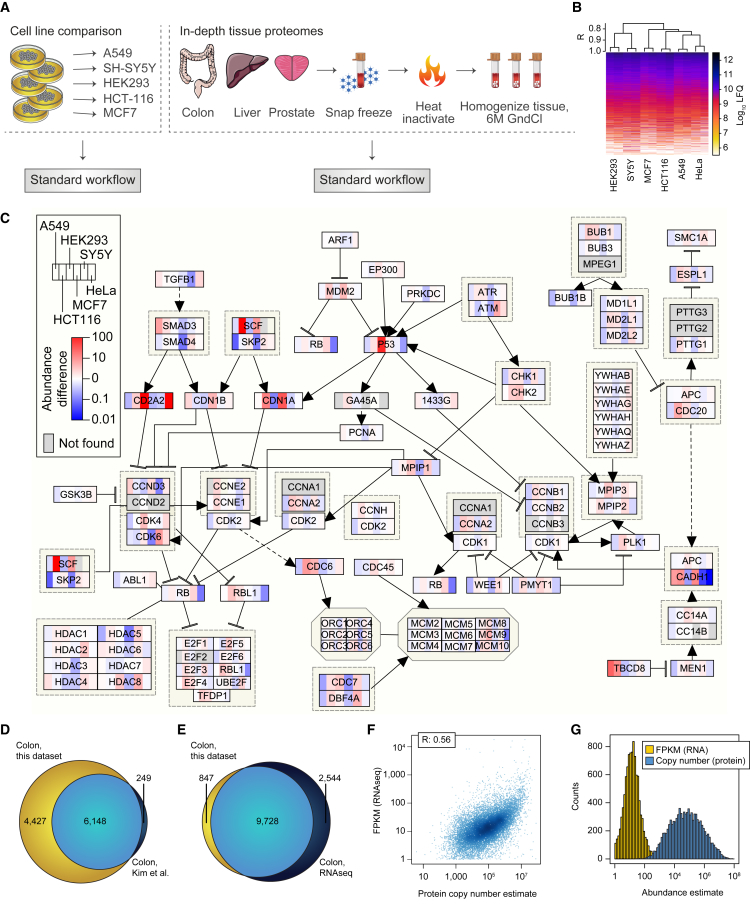
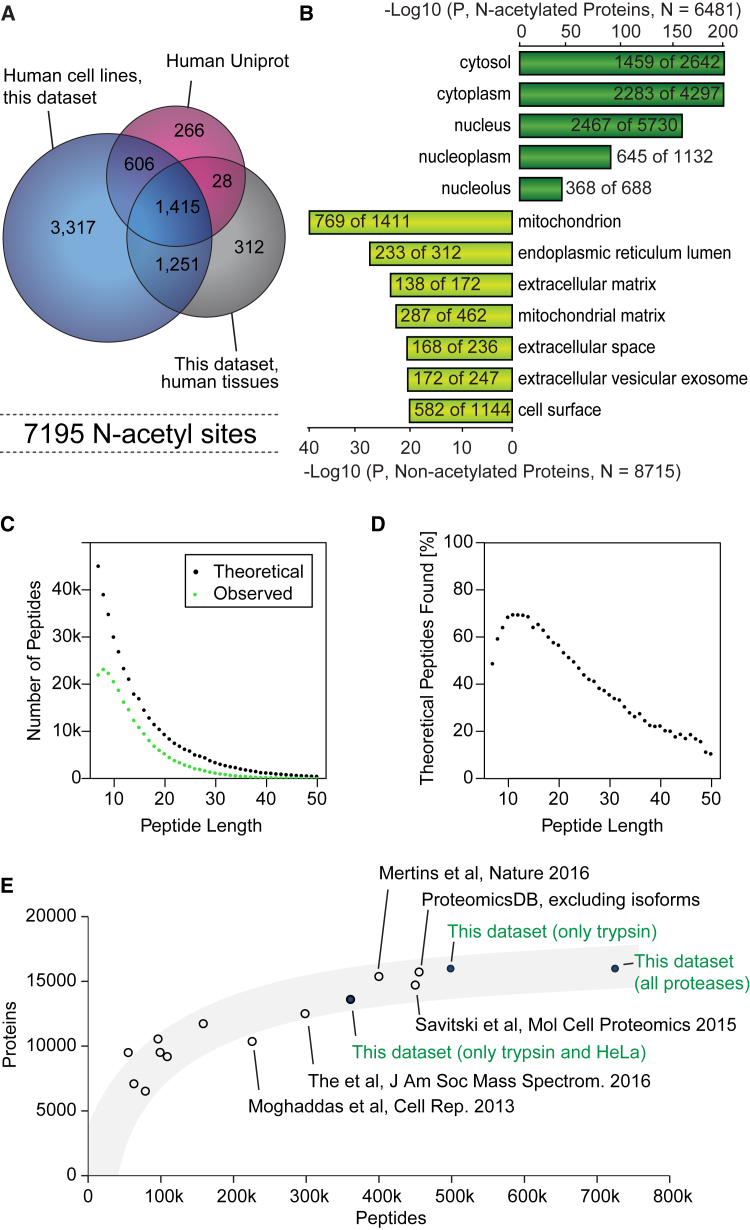
This study investigates the challenge of comprehensively cataloging the complete human proteome from a single-cell type using mass spectrometry (MS)-based shotgun proteomics. We modify a classical two-dimensional high-resolution reversed-phase peptide fractionation scheme and optimize a protocol that provides sufficient peak capacity to saturate the sequencing speed of modern MS instruments. This strategy enables the deepest proteome of a human single-cell type to date, with the HeLa proteome sequenced to a depth of ∼584,000 unique peptide sequences and ∼14,200 protein isoforms (∼12,200 protein-coding genes). This depth is comparable with next-generation RNA sequencing and enables the identification of post-translational modifications, including ∼7,000 N-acetylation sites and ∼10,000 phosphorylation sites, without the need for enrichment. We further demonstrate the general applicability and clinical potential of this proteomics strategy by comprehensively quantifying global proteome expression in several different human cancer cell lines and patient tissue samples.

Keywords: HeLa; PTM; acetylation; high pH reversed-phase fractionation; human proteome; mass spectrometry; orbitrap; patient samples; phosphorylation; proteomics.


Figures

None
Graphical abstract
Figure 1
Figure 1
Workflow Overview (A) Conceptual strategy for improving the limit of detection through multiple sample injections, increasing the peak capacity through multiple LC separations, maximizing ion flux and instrument time using short LC-MS gradients, while keeping the MS in the fastest scanning mode. (B) Experimental workflow of all HeLa experiments. (C) Quantitative reproducibility of the method.
Figure 2
Figure 2
Workflow Performance Characteristics (A) Visualization of peptide sequencing speed analyzing HpH fraction 46. (B) Cumulative number of proteins and protein-coding genes through HpH fraction 46. (C) Histogram illustrating LC peak width distributions for all multi-charged isotope patterns, targeted precursors, and identified peptides. (D) Heatmap representing the orthogonality of LC separations through binning of both dimensions by minutes. (E) Visualization of peptide overlap between HpH fractions.
Figure 3
Figure 3
Comprehensive Analysis of the HeLa Proteome (A) Identifications based on replica digests and alternative proteases for peptides, protein-coding genes, and proteins, including isoforms. (B) Comparison of sequence coverage achieved. (C) Benchmarking this HeLa dataset against other published datasets of deep single-cell proteomes. Bar chart showing comparisons of unique peptide sequences identified per minute of analysis time and peptides per protein.
Figure 4
Figure 4
Functional Analysis of the HeLa Proteome (A) Comparison of protein-coding gene abundances in HeLa identified in this dataset with the largest existing HeLa proteome published so far. (B) Comparison of protein-coding genes identified in HeLa in this dataset with previously published proteome and next-generation RNA-seq data of HeLa cells. (C) CORUM protein complex coverage of the identified proteins in this dataset. (D) Abundance of BRCA1/RNA polymerase II complex members in HeLa cells visualized according to their individual protein intensities. (E) Abundance of proteasomal proteins in HeLa visualized according to their individual protein intensities. (F) Scatterplot of HeLa protein copy-number estimation from this dataset with previously published copy numbers.
Figure 5
Figure 5
Post-Translational Modifications, PTMs, Identified in HeLa (A) Sequence logo plots of major PTMs identified in HeLa without specific enrichment. (B) Correlation between protein abundance and phosphorylation site stoichiometry. (C) Kinase motif enrichment analysis of four sub-clusters found by comparison of phosphorylation site stoichiometry and their corresponding protein abundance. (D) Boxplot analysis of citations associated with phosphorylation sites in the four sub-clusters.
Figure 6
Figure 6
Deep Proteome Analysis of Human Cell Lines and Patient Biopsies (A) Application of the standard 46 HpH fractions-based workflow to five additional human cell lines and three human tissues. (B) Hierarchical clustering and heatmap visualization of protein abundances of two replicates for each cell line. (C) Cell-cycle pathway map with proteins colored according to their relative expression between cell lines. (D) Overlap of protein-coding genes identified in colon tissue using this method with a previously published in-depth colon dataset. (E) Overlap of colon transcriptome and proteome from the same patient sample. (F) Scatterplot of colon protein copy-number estimates and RNA-seq fragments per kilobase of transcript per million mapped reads (FPKM) values. (G) Histogram of colon RNA-seq (FPKM) with corresponding proteome copy-number estimates.
Figure 7
Figure 7
Large-Scale Analysis (A) Venn diagram showing overlap between proteins with N-acetylation identified in this dataset and annotations in UniProt. (B) Cellular compartment gene ontology enrichment analysis of the N-acetylated proteome compared with the non-acetylated proteome. (C) Comparison of observed versus theoretical tryptic peptides from the 12,209 protein-coding genes found in HeLa as a function of peptide length. (D) Fractional coverage of the theoretical peptide space in HeLa. (E) Comparison of this dataset with published large-scale proteome datasets with more than 6,500 proteins.

Comment in

  • New Apex in Proteome Analysis.
    Ly T, Lamond AI. Ly T, et al. Cell Syst. 2017 Jun 28;4(6):581-582. doi: 10.1016/j.cels.2017.06.009. Cell Syst. 2017. PMID: 28662382

References

    1. Arabi A., Ullah K., Branca R.M.M., Johansson J., Bandarra D., Haneklaus M., Fu J., Aries I., Nilsson P., Den Boer M.L. Proteomic screen reveals Fbw7 as a modulator of the NF-kappa B pathway. Nat. Commun. 2012;3:976. - PMC - PubMed
    1. Batth T.S., Francavilla C., Olsen J.V. Off-line high-pH reversed-phase fractionation for in-depth phosphoproteomics. J. Proteome Res. 2014;13:6176–6186. - PubMed
    1. Beck M., Schmidt A., Malmstroem J., Claassen M., Ori A., Szymborska A., Herzog F., Rinner O., Ellenberg J., Aebersold R. The quantitative proteome of a human cell line. Mol. Syst. Biol. 2011;7:549. - PMC - PubMed
    1. Boisvert F.M., Ahmad Y., Gierlinski M., Charriere F., Lamont D., Scott M., Barton G., Lamond A.I. A quantitative spatial proteomics analysis of proteome turnover in human cells. Mol. Cell. Proteomics. 2012;11:M111. - PMC - PubMed
    1. Branca R.M.M., Orre L.M., Johansson H.J., Granholm V., Huss M., Perez-Bercoff A., Forshed J., Kall L., Lehtio J. HiRIEF LC-MSMS enables deep proteome coverage and unbiased proteogenomics. Nat. Methods. 2014;11:59–62. - PubMed

Publication types