. 2017 Jul;19(7):549-563.
doi: 10.1016/j.neo.2017.04.002. Epub 2017 Jun 9.

Heterogeneous Cadherin Expression and Multicellular Aggregate Dynamics in Ovarian Cancer Dissemination

Affiliations

Heterogeneous Cadherin Expression and Multicellular Aggregate Dynamics in Ovarian Cancer Dissemination

Yuliya Klymenko et al. Neoplasia. 2017 Jul.

Abstract

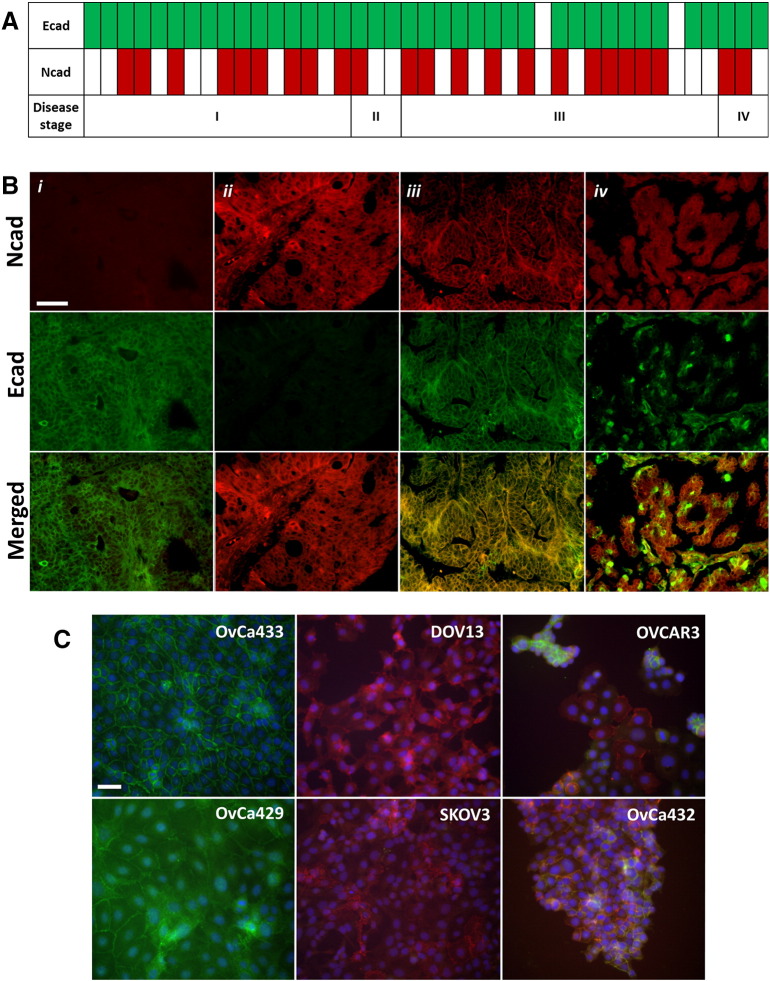
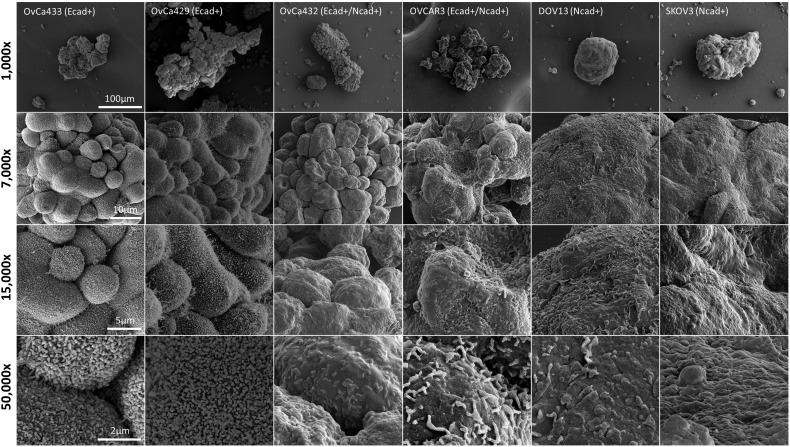
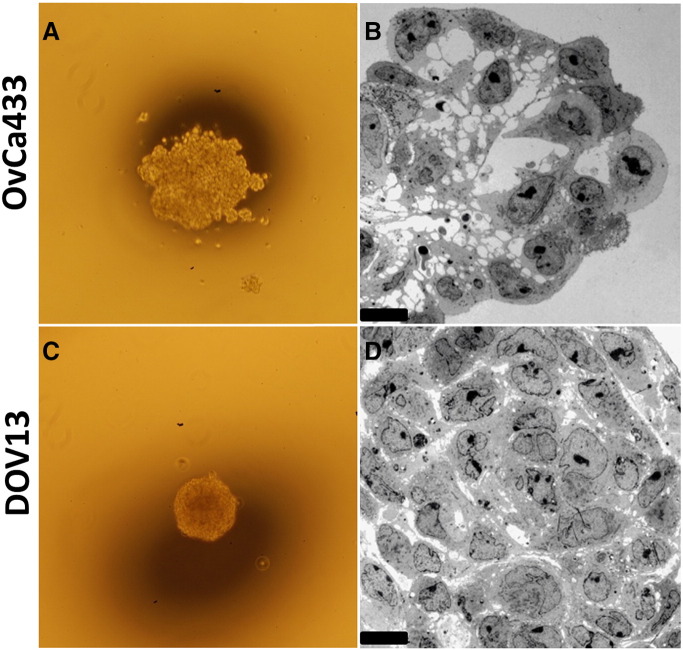
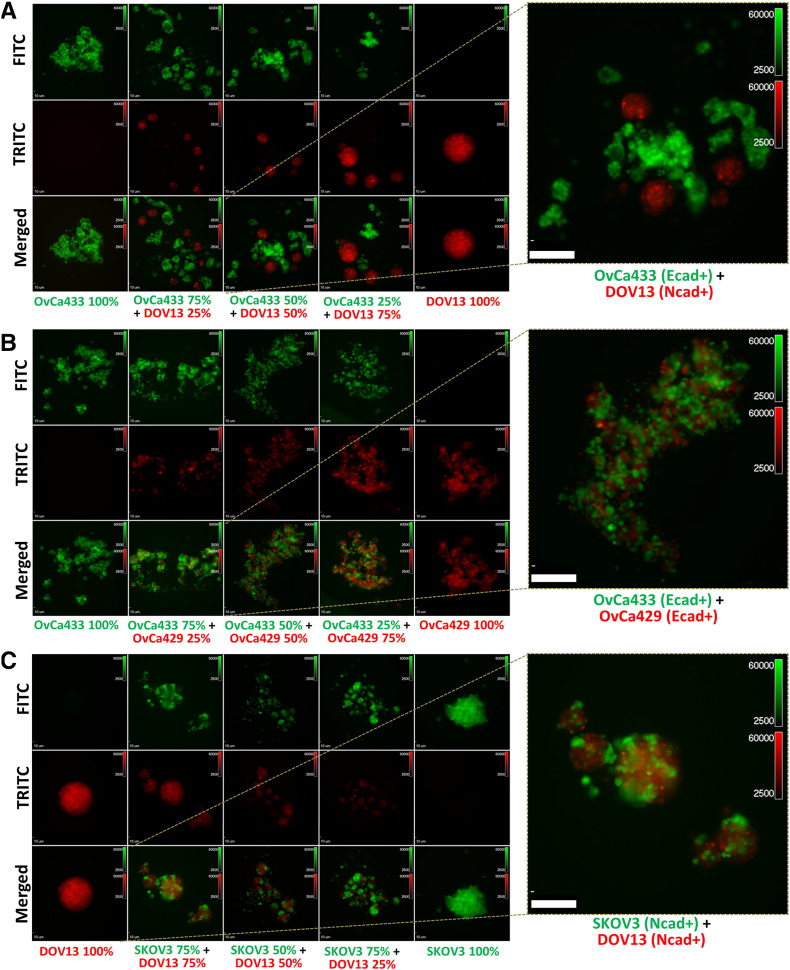
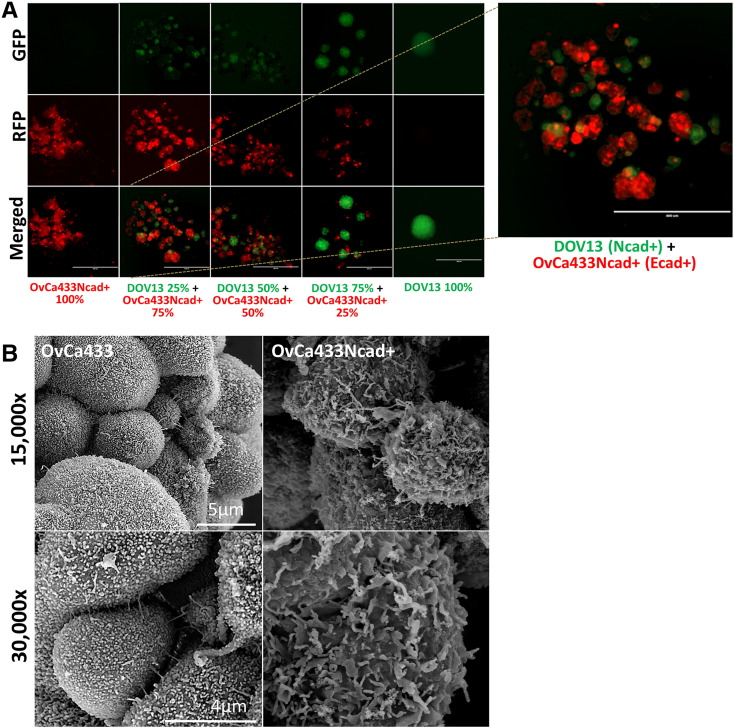
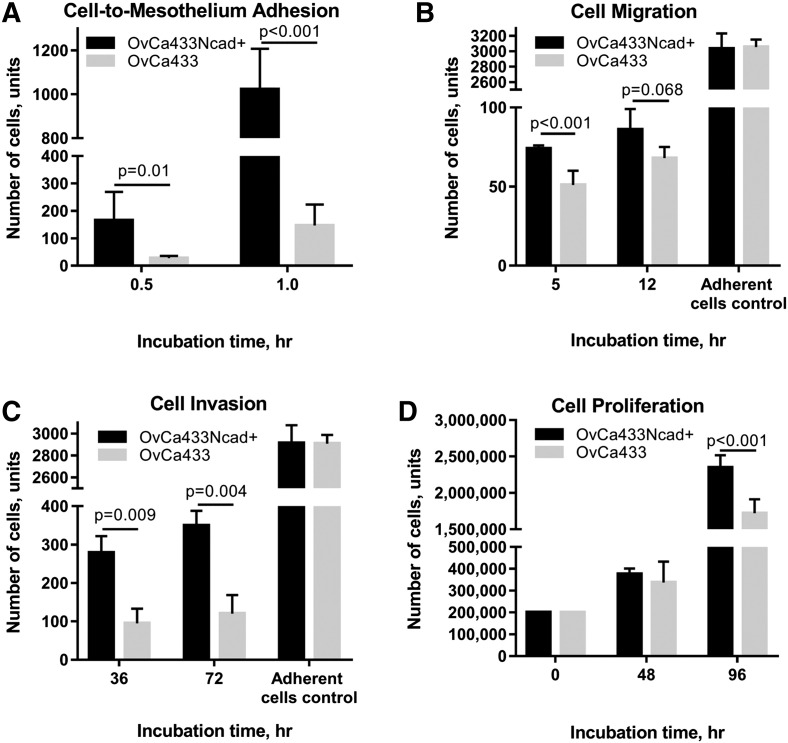
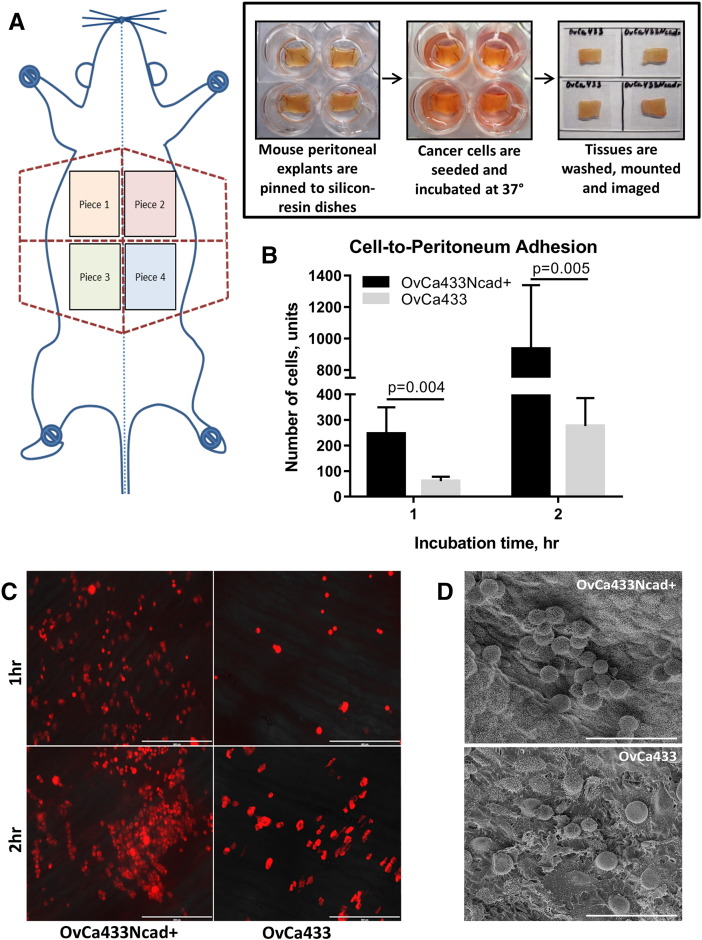
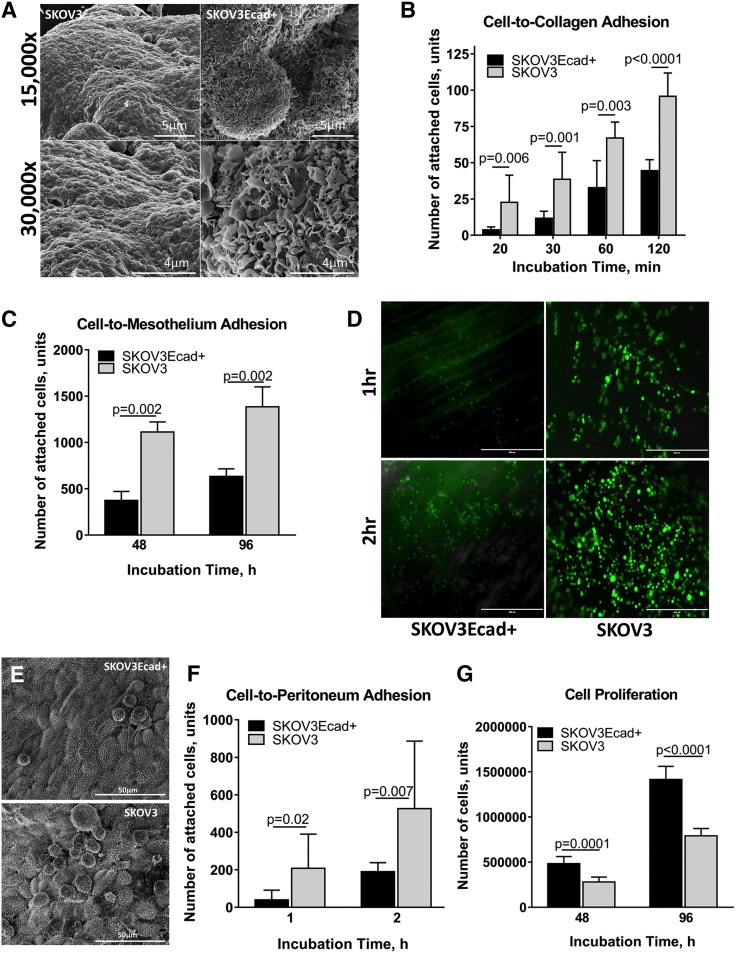
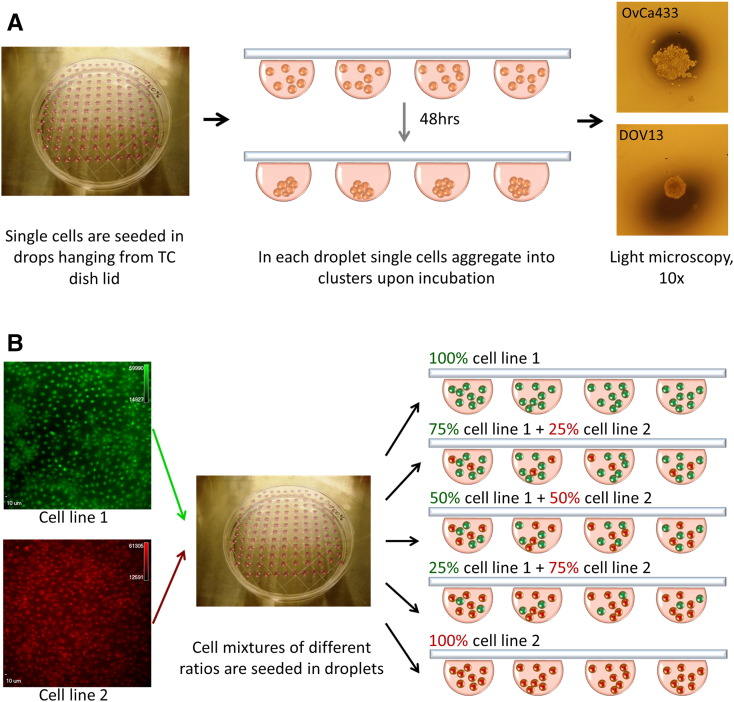
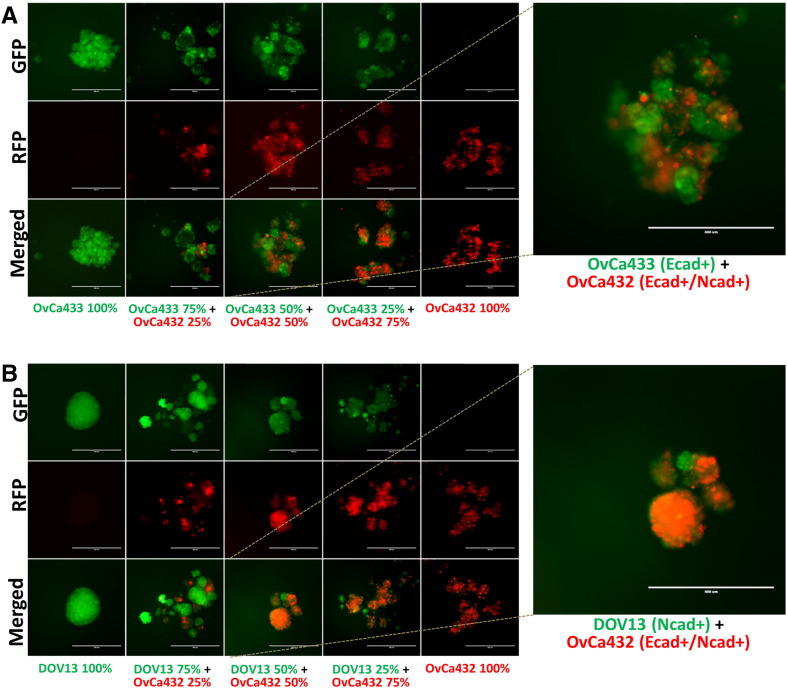
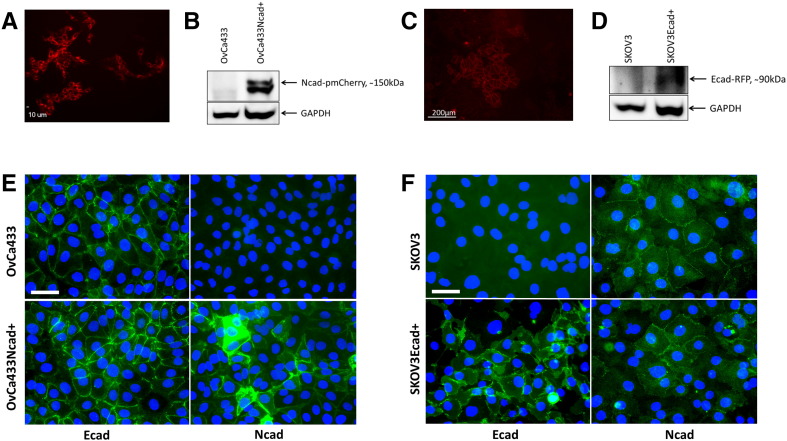
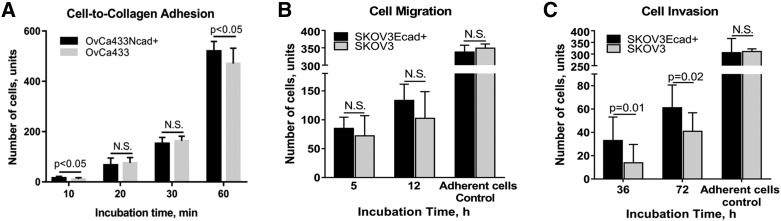
Epithelial ovarian carcinoma spreads via shedding of cells and multicellular aggregates (MCAs) from the primary tumor into peritoneal cavity, with subsequent intraperitoneal tumor cell:mesothelial cell adhesion as a key early event in metastatic seeding. Evaluation of human tumor extracts and tissues confirms that well-differentiated ovarian tumors express abundant E-cadherin (Ecad), whereas advanced lesions exhibit upregulated N-cadherin (Ncad). Two expression patterns are observed: "mixed cadherin," in which distinct cells within the same tumor express either E- or Ncad, and "hybrid cadherin," wherein single tumor cell(s) simultaneously expresses both cadherins. We demonstrate striking cadherin-dependent differences in cell-cell interactions, MCA formation, and aggregate ultrastructure. Mesenchymal-type Ncad+ cells formed stable, highly cohesive solid spheroids, whereas Ecad+ epithelial-type cells generated loosely adhesive cell clusters covered by uniform microvilli. Generation of "mixed cadherin" MCAs using fluorescently tagged cell populations revealed preferential sorting into cadherin-dependent clusters, whereas mixing of cell lines with common cadherin profiles generated homogeneous aggregates. Recapitulation of the "hybrid cadherin" Ecad+/Ncad+ phenotype, via insertion of the CDH2 gene into Ecad+ cells, resulted in the ability to form heterogeneous clusters with Ncad+ cells, significantly enhanced adhesion to organotypic mesomimetic cultures and peritoneal explants, and increased both migration and matrix invasion. Alternatively, insertion of CDH1 gene into Ncad+ cells greatly reduced cell-to-collagen, cell-to-mesothelium, and cell-to-peritoneum adhesion. Acquisition of the hybrid cadherin phenotype resulted in altered MCA surface morphology with increased surface projections and increased cell proliferation. Overall, these findings support the hypothesis that MCA cadherin composition impacts intraperitoneal cell and MCA dynamics and thereby affects ultimate metastatic success.


Figures

Figure 1
Figure 1
Human EOC tissues and cell lines demonstrate heterogeneous cadherin expression. (A) Ovarian cancer TissueScan cDNA arrays (HORT-01, OriGene) were analyzed on a Bio-Rad Thermal iCycler using an iTaq Universal SYBR Green Supermix (Bio-Rad) to test for Ecad and Ncad expression. Open rectangles show negative Ecad or Ncad expression (defined as no signal or Ct ≥ 35), and filled rectangles represent positive Ecad (green) or Ncad (red) expression (defined as Ct < 35) in human ovarian carcinoma specimens, stages I, II, III, and IV (according to International Federation of Gynecology and Obstetrics) as indicated. (B) Microarrayed human TMA ovarian cancer tissues (n=70 patients, OV809, US Biomax, Inc.) were double-stained for Ecad (green) and Ncad (red), as indicated in Methods. Representative images of ovarian serous papillary adenocarcinoma from the TMA showing examples of (i) predominant Ecad expression, (ii) predominant Ncad expression, (iii) hybrid cadherin expression (Ecad/Ncad within same cells), and (iv) mixed cadherin expression (Ecad/Ncad within different cells of the same tissue); scale bar: 50 μm. Images were obtained using a Leica DM5500 microscope. (C) EOC cell lines OvCa433, OvCa429, DOV13, SKOV3, OVCAR3, and OvCa432 were subcultured on cover slips and processed for Ecad (green) and Ncad (red) dual-label immunofluorescence, nuclei-counterstained with DAPI (blue) as stated in Methods, and imaged using an Olympus DSU-IX81 microscope. Scale bar: 50 μm.
Figure 2
Figure 2
EOC cadherin profiles correlate with MCA surface morphology. MCAs were generated from OvCa433, OvCa429, OvCa432, OVCAR3, DOV13, and SKOV3 cells, as indicated, via the hanging drop method (Supplemental Figure 1A); processed for SEM as detailed in Methods; and examined using FEI-Magellan 400 or Hitachi S-4700 field emission SEM. Representative images were taken at 1000×, 7000×, 15,000×, and 50,000× magnifications (scale bars as indicated).
Figure 3
Figure 3
Epithelial- and mesenchymal-type MCAs differ in cross-sectional ultrastructure. Representative epithelial (A-B, OvCa433) and mesenchymal (C-D, Dov13) MCAs were generated via the hanging drop method (Supplemental Figure 1A), observed under light microscope at 4× magnification (A and C), and further processed for TEM as detailed in Methods. Sections were examined under JEOL 1400 TEM (B and D). Scale bar: 10 μm.
Figure 4
Figure 4
Cadherin profiles dictate cell sorting and mixing in heterogeneous MCAs. Cells were transiently fluorescently labeled with green or red dyes as described in Methods and cocultured in hanging drops (100,000 cells/ml; Supplemental Figure 1B) at various proportions as indicated in the figure panels. (A) Green OvCa433 (Ecad+) mixed with red DOV13 (Ncad+); (B) green OvCa433 (Ecad+) mixed with red OvCa429 (Ecad+); (C) green SKOV3 (Ncad+) mixed with red DOV13 (Ncad+). MCAs were observed after 48 hours under Olympus DSU-IX81 spinning disc confocal microscope. Scale bar: 10 μm. Right panels: A representative image is shown enlarged.
Figure 5
Figure 5
Acquisition of the hybrid cadherin phenotype induces mixed aggregate formation and alters MCA surface morphology. (A) Transiently stained hybrid cadherin cell line (OvCa433Ncad+, red) and DOV13 (Ncad+, green) cells were cocultured in hanging drops (100,000 cells/ml; Supplemental Figure 1B) at the proportions indicated in the figure panel. MCAs were observed at 48 hours under AMG EVOS fluorescence microscope. Scale bar: 400 μm. Right panel: A representative image is shown enlarged. (B) OvCa433 and hybrid OvCa433Ncad+ MCAs were generated via the hanging drop method (Supplemental Figure 1A) and processed for SEM as described in Methods. Microscopy was performed using Hitachi S-4700 field emission SEM. Representative images were taken at 15,000× and 30,000× magnifications (scale bars as indicated).
Figure 6
Figure 6
Acquisition of Ncad expression promotes adhesive, migratory, invasive, and proliferative cell properties. (A) Evaluation of tumor cell:mesothelial cell adhesion: Mesomimetic cultures comprised of LP9 human mesothelial cell monolayers cultured on type I collagen gels in 24-well plates were incubated with either OvCa433-RFP (grey bars) or transiently dyed hybrid OvCa433Ncad+ cells (200,000 cells/ml) (black bars) for 0.5 or 1 hour, as indicated. After washing, adherent cells were imaged with AMG EVOS fluorescence microscope at 4× magnification × 6 fields of view; image analysis was performed using ImageJ. (B) Evaluation of tumor cell migration. OvCa433 (grey bars) and hybrid OvCa433Ncad+ cells (black bars) were preincubated in SFM for 3 hours prior to seeding onto Boyden chamber membranes (at 500,000 cells/ml, 500 μl) for 5 or 12 hours as indicated. Cells migrating to the lower side of the filter were then fixed and stained with the Diff-Quik (Siemens) and enumerated under light microscope at 10× magnification × 6 fields of view. An adherent cell control was conducted simultaneously, as described in Methods, to assess whether alterations in cell adhesion contributed to the differential migratory behavior observed. (C) Analysis of cellular invasion. OvCa433 (grey bars) and OvCa433Ncad+ cells (black bars) were incubated in SFM for 3 hours prior to seeding on top of 3D Matrigel constructs inside Boyden chambers (at 500,000 cells/ml, 500 μl) for 36 or 72 hours as indicated. Cells invading to the lower side of the filter were then fixed and stained with Diff-Quick and enumerated under the light microscope at 10× magnification × 6 fields of view. An adherent cell control was conducted simultaneously, as described in Methods, to assess whether alterations in cell adhesion contributed to the differential invasive behavior observed. (D) Analysis of cell proliferation. OvCa433 (grey bars) and OvCa433Ncad+ (black bars) cells were seeded in 35-mm dishes (200,000 cells/dish) and incubated for 48 or 96 hours as indicated prior to enumeration of cells using hemocytometry. All assays were repeated in triplicate, and statistical analysis was conducted using a Student's t test.
Figure 7
Figure 7
Acquisition of Ncad enhances adhesion to peritoneal explants. (A) Overview of ex vivo adhesion assay. Explants of peritoneal tissue were dissected and pinned “mesothelium-side-up” on optically clear Silastic resin as described in Methods for use as an adhesive substratum. Stably tagged OvCa433-RFP or transiently dyed OvCa433Ncad+ cells (as described in Methods) were incubated with peritoneal tissue explants for 1 or 2 hours as indicated, rinsed with ice-cold PBS 3 × 3 minutes, mounted inverted on glass slides, and imaged. (B-C) Adherent cells (OvCa433, grey bars; OvCa433Ncad+, black bars) were enumerated using an AMG EVOS fluorescence microscope at 4× magnification × 6 fields of view with image analysis conducted in ImageJ. The assay was repeated in triplicate, and statistical analysis was performed using a Student's t test. (D) Tissue explants from a separate replicate were subjected to SEM processing and imaged with FEI-Magellan 400 at 15,000× and 30,000× (scale bars as indicated).
Figure 8
Figure 8
Acquisition of Ecad expression alters MCA morphology, attenuates cell adhesive behavior, and increases cell proliferation. (A) SKOV3 and hybrid SKOV3Ecad+ MCAs were generated via the hanging drop method (Supplemental Figure 1A) and processed for SEM as described in Methods. Microscopy was performed using FEI-Magellan 400 with representative images taken at 15,000× and 30,000× magnifications (scale bars as indicated). (B) Evaluation of cell-to-collagen adhesion. SKOV3 (grey bars) and SKOV3Ecad+ (black bars) cells were incubated on top of type I collagen–precoated (10 μg/ml) 24-well dishes (at 100,000 cells/ml, 500 μl) for 20, 30, 60, and 120 minutes, as indicated, followed by washing, fixation, staining with Diff-Quick (Siemens), and enumeration of adherent cells under light microscope at 10× magnification × 6 fields of view. The assay was repeated in triplicate and statistical analysis performed using a student's t-test. C) Evaluation of tumor cell:mesothelial cell adhesion: Meso-mimetic cultures comprised of LP9 human mesothelial cell monolayers cultured on type I collagen gels in 24-well plates were incubated with either SKOV3-GFP (grey bars) or transiently dyed hybrid SKOV3Ecad+ cells (200,000 cells/ml) (black bars) for 0.5 or 1h, as indicated. After washing, adherent cells were imaged with AMG EVOS fluorescence microscope at 4× magnification × 6 fields of view; image analysis was performed using ImageJ. (D) Assessment of cell-to-peritoneum adhesion. Explants of peritoneal tissue were dissected and pinned “mesothelium-side-up” on optically clear Silastic resin as described in Methods for use as an adhesive substratum. Stably tagged SKOV3-GFP or transiently dyed SKOV3Ecad+ cells (as described in Methods) were incubated with peritoneal tissue explants for 1 or 2 hours as indicated, rinsed with ice-cold PBS 3 × 3 minutes, mounted inverted on glass slides, and imaged with AMG EVOS fluorescence microscope. (E) Tissue explants from a separate replicate were subjected to SEM processing and imaged with FEI-Magellan 400 at 15,000× and 30,000× (scale bars as indicated). (F) Quantitative evaluation of cell-to-peritoneum adhesion (SKOV3, grey bars; SKOV3Ecad+, black bars) was performed using an AMG EVOS fluorescence microscope at 4× magnification × 6 fields of view with image analysis conducted in ImageJ. The assay was repeated in triplicate, and statistical analysis was performed using a Student's t test. (G) Analysis of cell proliferation. SKOV3 (grey bars) and SKOV3Ecad+ (black bars) cells were seeded in 35-mm dishes (200,000 cells/dish) and incubated for 48 or 96 hours as indicated prior to enumeration of cells using hemocytometry. All assays were repeated in triplicate, and statistical analysis was conducted using a Student's t test.
Supplemental Figure 1
(A) Overview of hanging drop method of MCA formation. EOC cells were diluted to 100,000 cells/ml and seeded in 20-μl droplets on inner surface of a 150 ×25–mm tissue culture dish lid with PBS added to the dish bottom for moistening; the lid was gently inverted and placed on top of the dish; hanging drops were incubated at 37°C for 48 hours, and MCA formation was confirmed under the light microscope, 4× magnification. (B) Formation of mixed MCAs. EOC cells were transiently dyed with red or green fluorescent CellTrackers as described in Methods and diluted to a concentration of 100,000 cells/ml. Red-green cell mixtures were then generated using different proportions of each cell line as indicated and utilized to form hanging drops as summarized above.
Supplemental Figure 2
Cells were transiently fluorescently labeled with green or red dyes as described in Methods and cocultured in hanging drops (100,000 cells/ml; Supplemental Figure 1B) at various proportions as indicated in the figure panels. (A) Green OvCa433 (Ecad+) mixed with red OvCa432 (Ecad+/Ncad+); (B) green DOV13 (Ncad+) mixed with red OvCa432 (Ecad+/Ncad+). MCAs were observed after 48 hours under AMG EVOS fluorescence microscope. Scale bar: 400 μm.
Supplemental Figure 3
(A) The hybrid OvCa433Ncad+ cell line was generated via electroporation of a pmCherry:Ncad plasmid into the parental OvCa433 (Ecad+) cells utilizing the Human Keratinocyte Nucleofector kit and Nucleofector II device (Amaxa). Successfully transfected cell populations were observed under Olympus DSU-IX81 spinning disk confocal microscope (scale bar as indicated). (B) Ncad expression was confirmed by Western blotting with the primary mouse anti-Ncad antibody (Invitrogen, 1:1000 dilution) followed by peroxidase-conjugated anti-mouse secondary antibody (Sigma-Aldrich, 1:4000 dilution) and enhanced chemiluminescence detection by ImageQuant LAS4000 biomolecular imager. (C) The hybrid SKOV3Ecad+ cell line was generated via chemical transfection of an Ecad-RFP plasmid into the parental SKOV3 (Ncad+) cells utilizing the Lipofectamine 2000 reagent (Invitrogen). Successfully transfected cell populations were observed under AMG EVOS fluorescence microscope (scale bar as indicated). (D) Ecad-RFP expression was confirmed by Western blotting with the primary mouse anti-RFP antibody (GeneTex, 1:1000 dilution) followed by peroxidase-conjugated anti-mouse secondary antibody (Sigma-Aldrich, 1:4000 dilution) and enhanced chemiluminescence detection by ImageQuant LAS4000 biomolecular imager. (E) EOC OvCa433 and OvCa433Ncad+ cells were subcultured on cover slips and processed for Ecad or Ncad (green) immunofluorescence, nuclei-counterstained (blue) as stated in Methods, and imaged (Leica DM5500 microscope); scale bar: 50 μm. (F) EOC SKOV3 and SKOV3Ecad+ cells were subcultured on cover slips and processed for Ecad or Ncad (green) immunofluorescence, nuclei-counterstained (blue) as stated in Methods, and imaged (Leica DM5500 microscope); scale bar: 50 μm.
Supplemental Figure 4
(A) Evaluation of cell-to-collagen adhesion. OvCa433 (grey bars) and OvCa433Ncad+ (black bars) cells were incubated on top of type I collagen–precoated (10 μg/ml) 24-well dishes (at 100,000 cells/ml, 500 μl) for 10, 20, 30, and 60 minutes, as indicated, prior to washing, fixation, staining with Diff-Quick (Siemens), and enumeration of adherent cells under light microscope at 10× magnification × 6 fields of view. The assay was repeated in triplicate, and statistical analysis was performed using a Student's t test. (B) Evaluation of tumor cell migration. SKOV3 (grey bars) and hybrid SKOV3Ecad+ cells (black bars) were preincubated in SFM for 3 hours or overnight prior to seeding onto Boyden chamber membranes (at 500,000 cells/ml, 500 μl) for 5 or 12 hours as indicated. Cells migrating to the lower side of the filter were then fixed and stained with the Diff-Quik (Siemens) and enumerated under light microscope at 10× magnification × 6 fields of view. Adherent cell control was conducted simultaneously as described in Methods. (C) Analysis of cellular invasion. SKOV3 (grey bars) and SKOV3Ecad+ cells (black bars) were incubated in SFM for 3 hours or overnight prior to seeding on top of 3D Matrigel constructs inside Boyden chambers (at 500,000 cells/ml, 500 μl) for 36 or 72 hours as indicated. Cells invading to the lower side of the filter were then fixed and stained with Diff-Quick (Siemens) and enumerated under the light microscope at 10× magnification × 6 fields of view. Adherent cell control was conducted simultaneously as described in Methods.

References

    1. Siegel RL, Miller KD, Jemal A. Cancer statistics, 2015. CA Cancer J Clin. 2015;65(1):5–29. - PubMed
    1. Howlader N, Noone A, Krapcho M, Neyman N, Aminou R, Waldron W, Altekruse S, Kosary C, Ruhl J, Tatalovich Z. National Cancer Institute; Bethesda, MD: 2011. SEER cancer statistics review, 1975-2008; p. 19.
    1. Vaughan S, Coward JI, Bast RC, Berchuck A, Berek JS, Brenton JD, Coukos G, Crum CC, Drapkin R, Etemadmoghadam D. Rethinking ovarian cancer: recommendations for improving outcomes. Nat Rev Cancer. 2011;11(10):719–725. - PMC - PubMed
    1. Marcus CS, Maxwell GL, Darcy KM, Hamilton CA, McGuire WP. Current approaches and challenges in managing and monitoring treatment response in ovarian cancer. J Cancer. 2014;5(1):25. - PMC - PubMed
    1. Hudson LG, Zeineldin R, Stack MS. Phenotypic plasticity of neoplastic ovarian epithelium: unique cadherin profiles in tumor progression. Clin Exp Metastasis. 2008;25(6):643–655. - PMC - PubMed

MeSH terms