. 2017 Jun 15;169(7):1303-1314.e18.
doi: 10.1016/j.cell.2017.05.025. Epub 2017 Jun 8.

Cryo-EM Reveals How Human Cytoplasmic Dynein Is Auto-inhibited and Activated

Affiliations

Cryo-EM Reveals How Human Cytoplasmic Dynein Is Auto-inhibited and Activated

Kai Zhang et al. Cell. .

Abstract

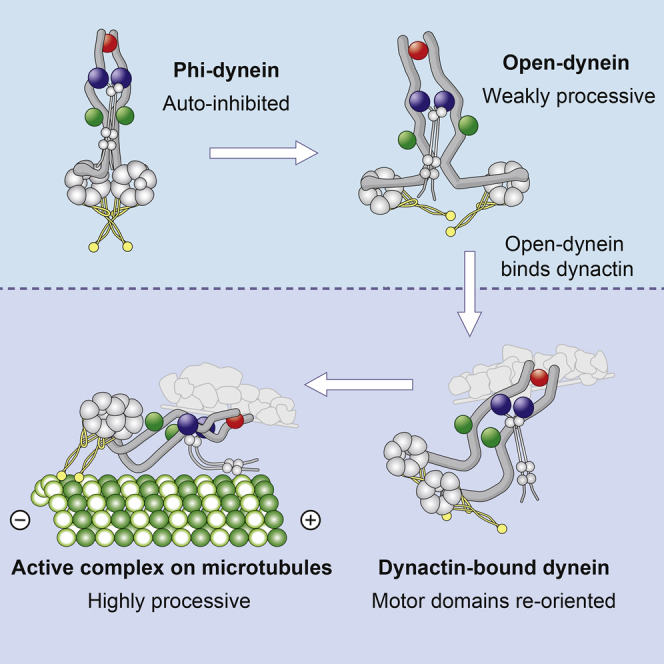
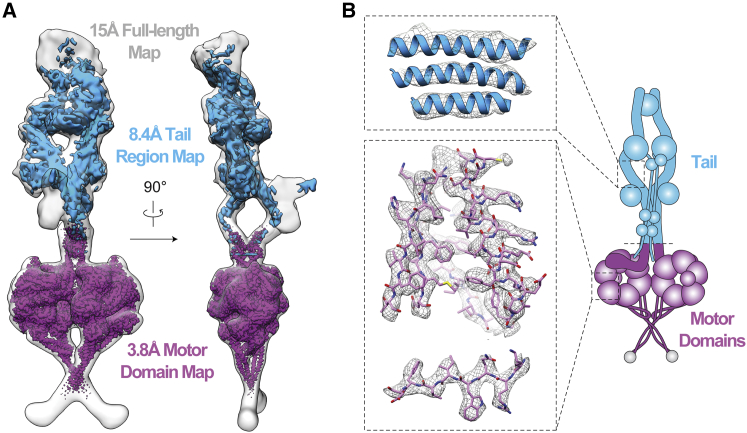
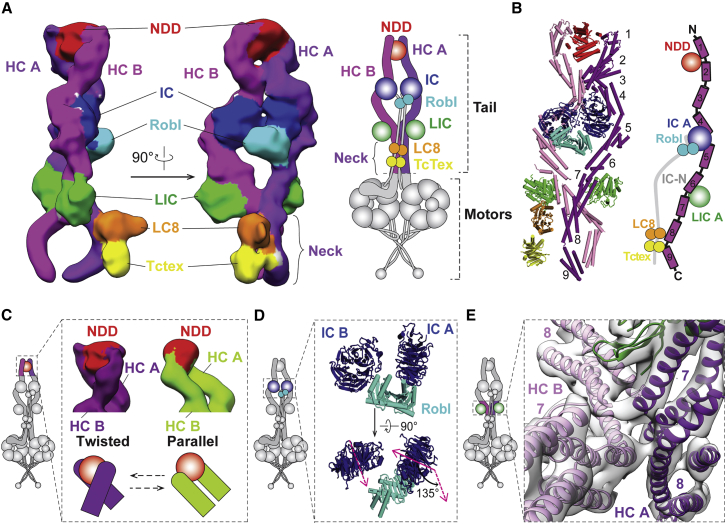
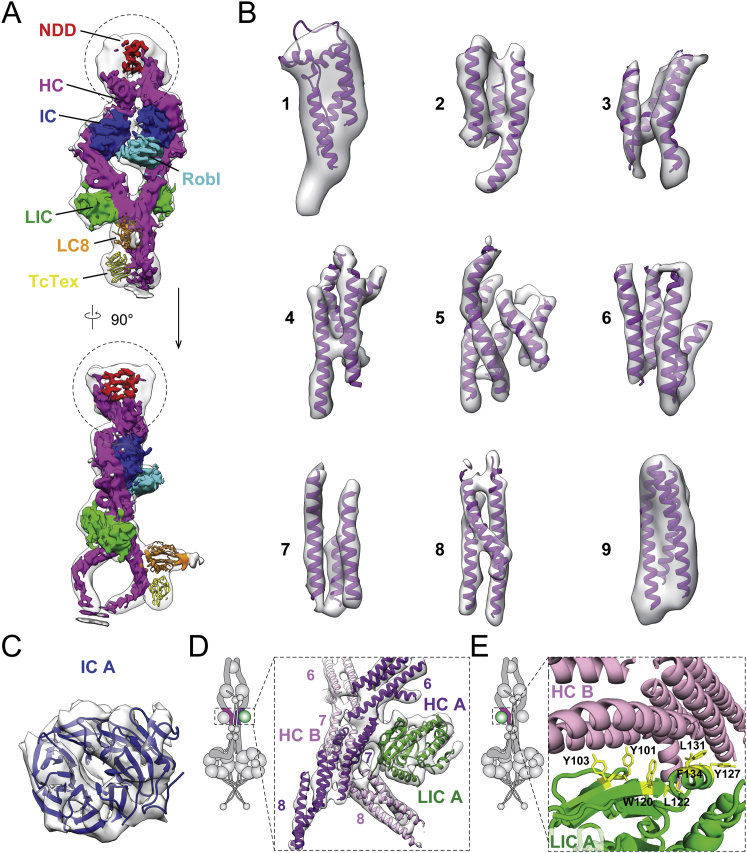
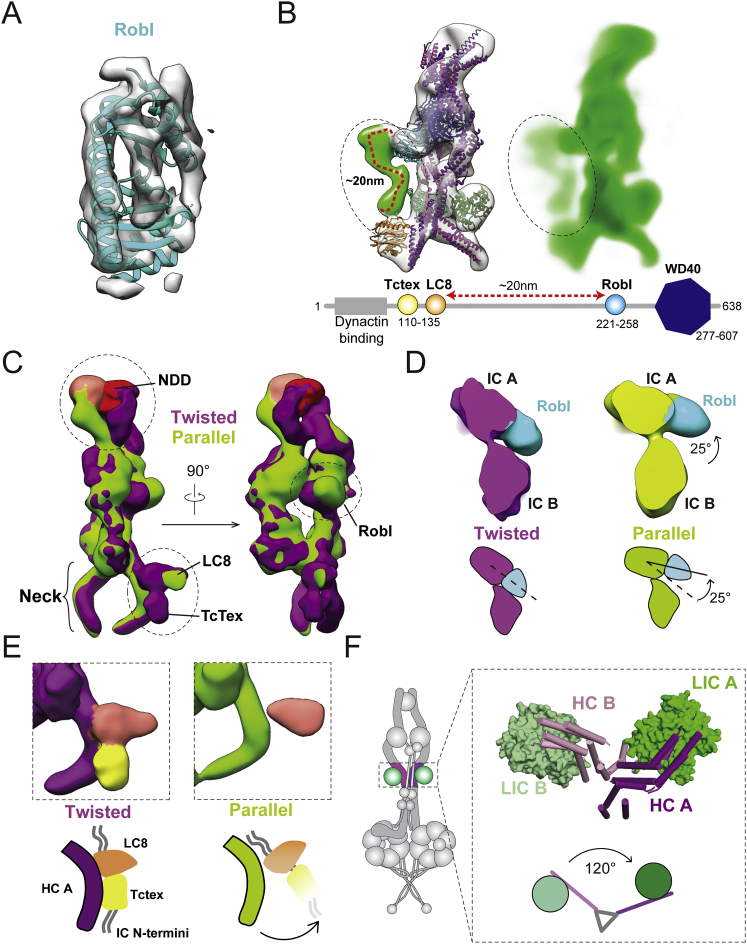
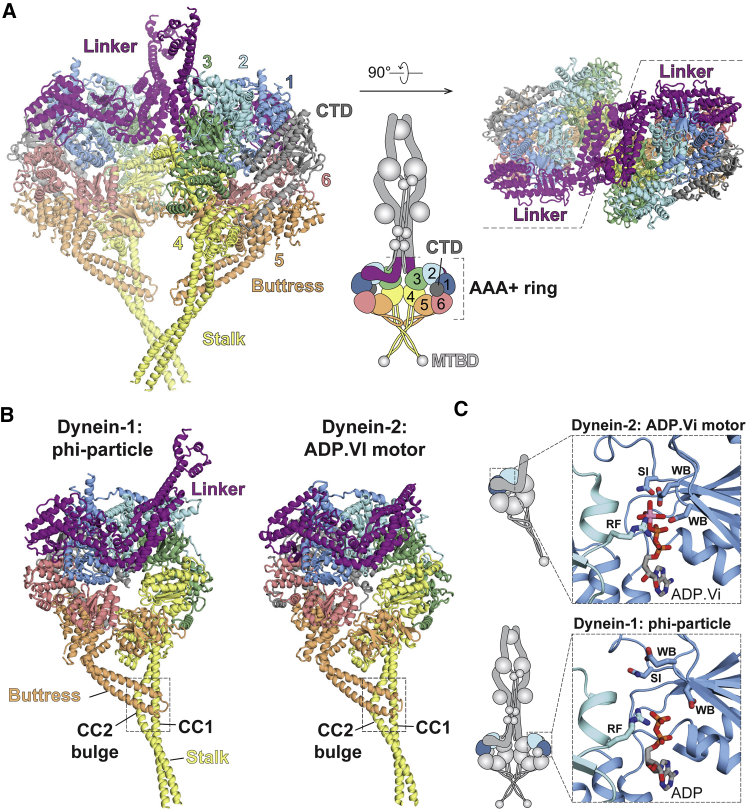
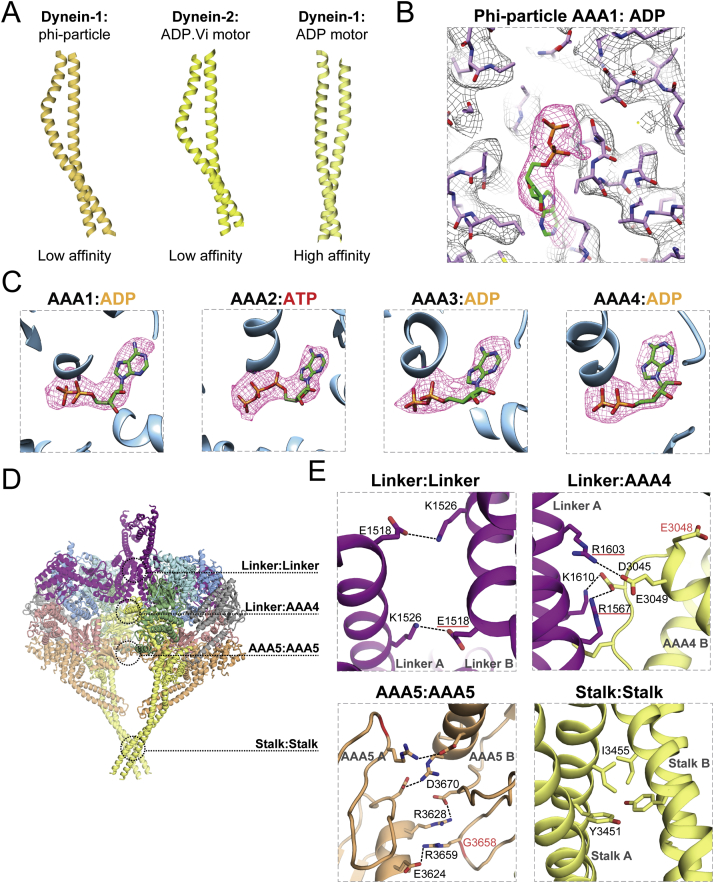
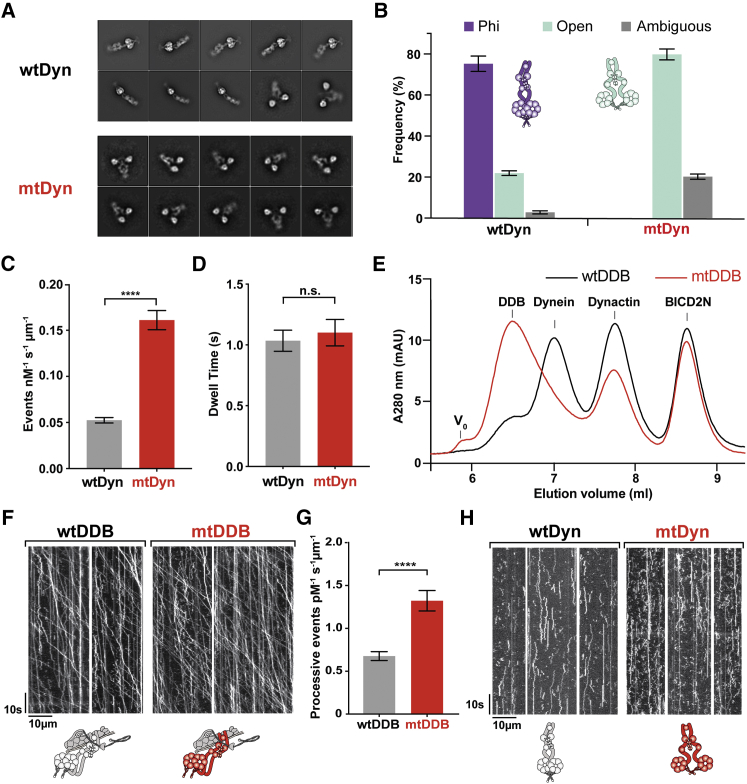
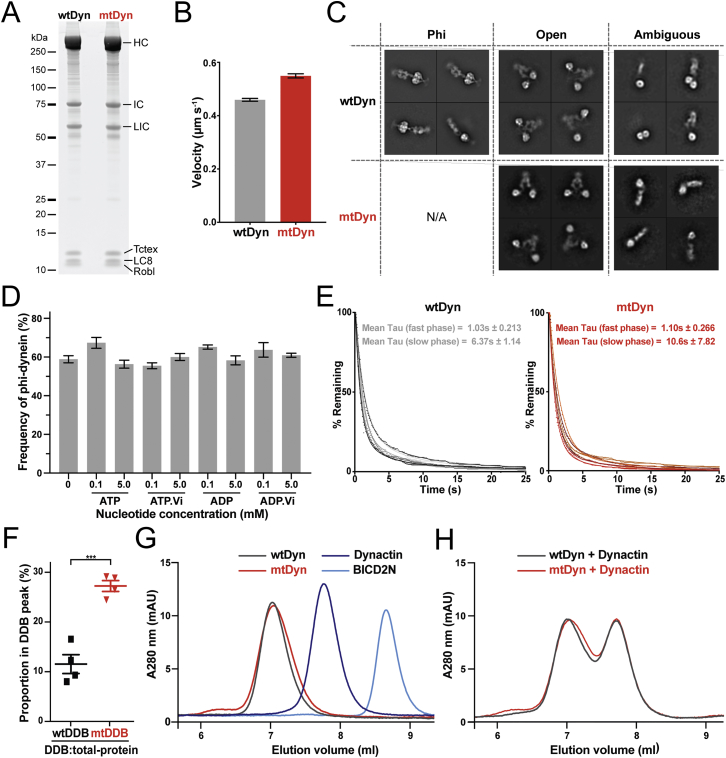
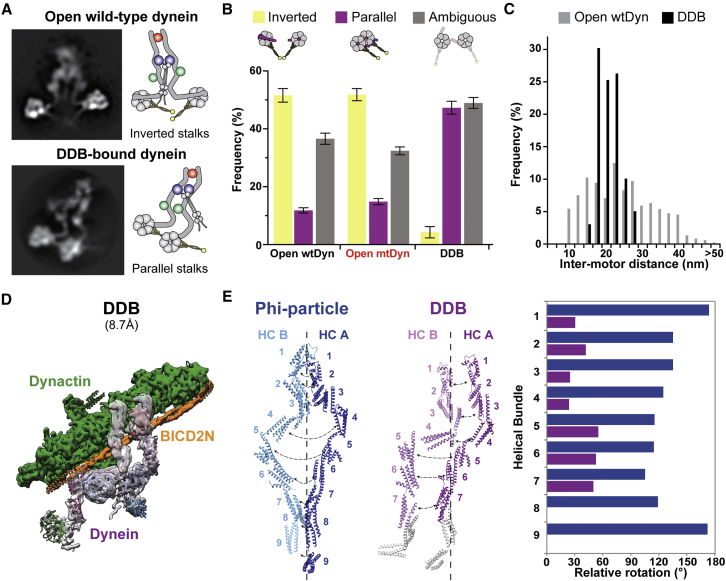
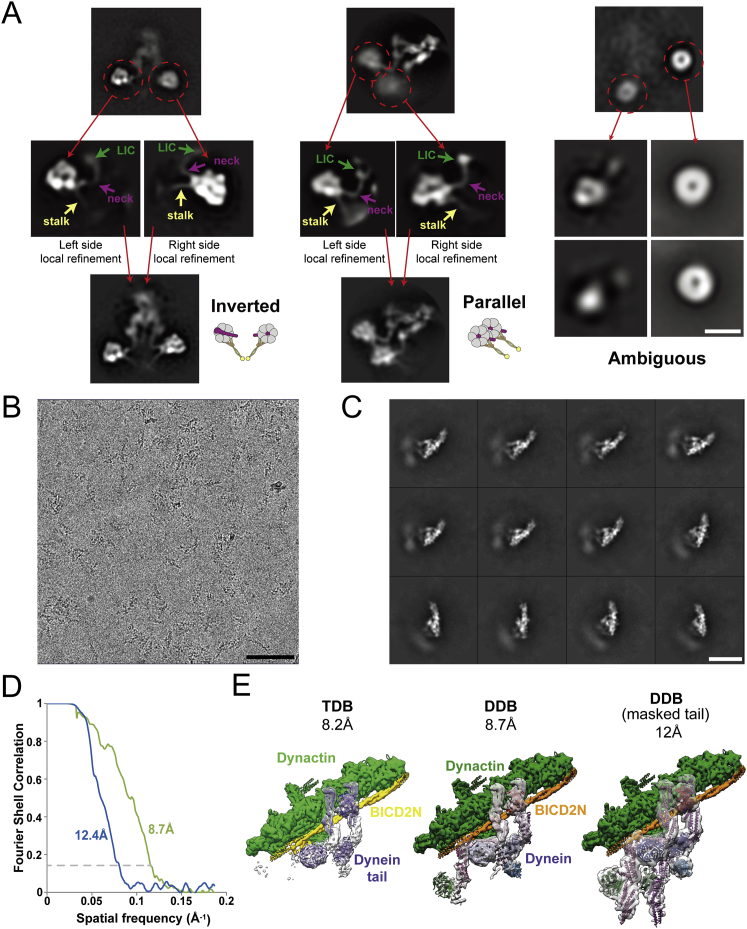
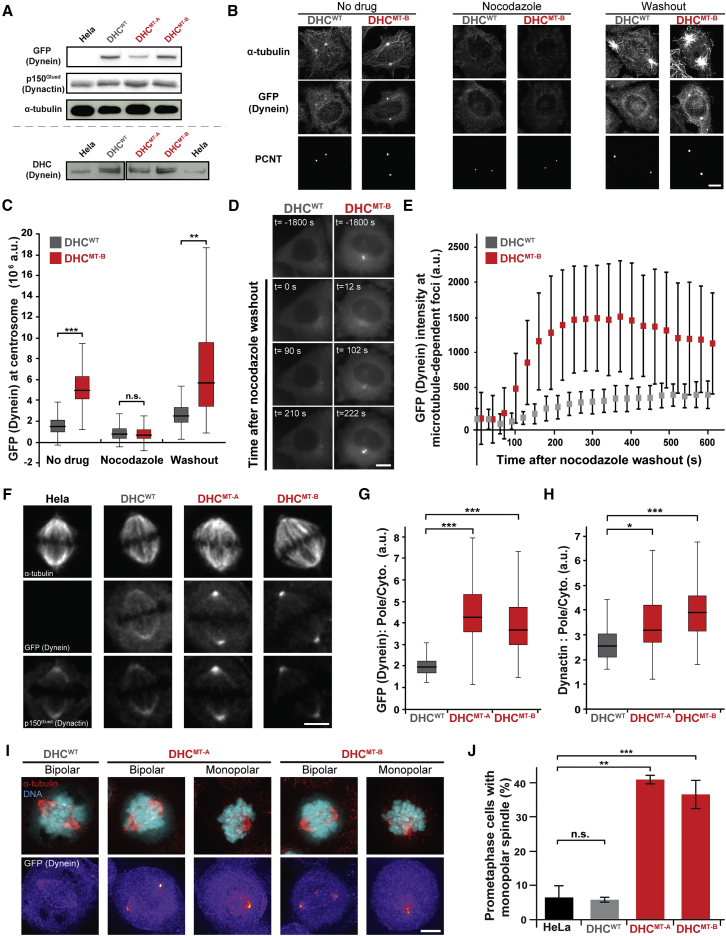
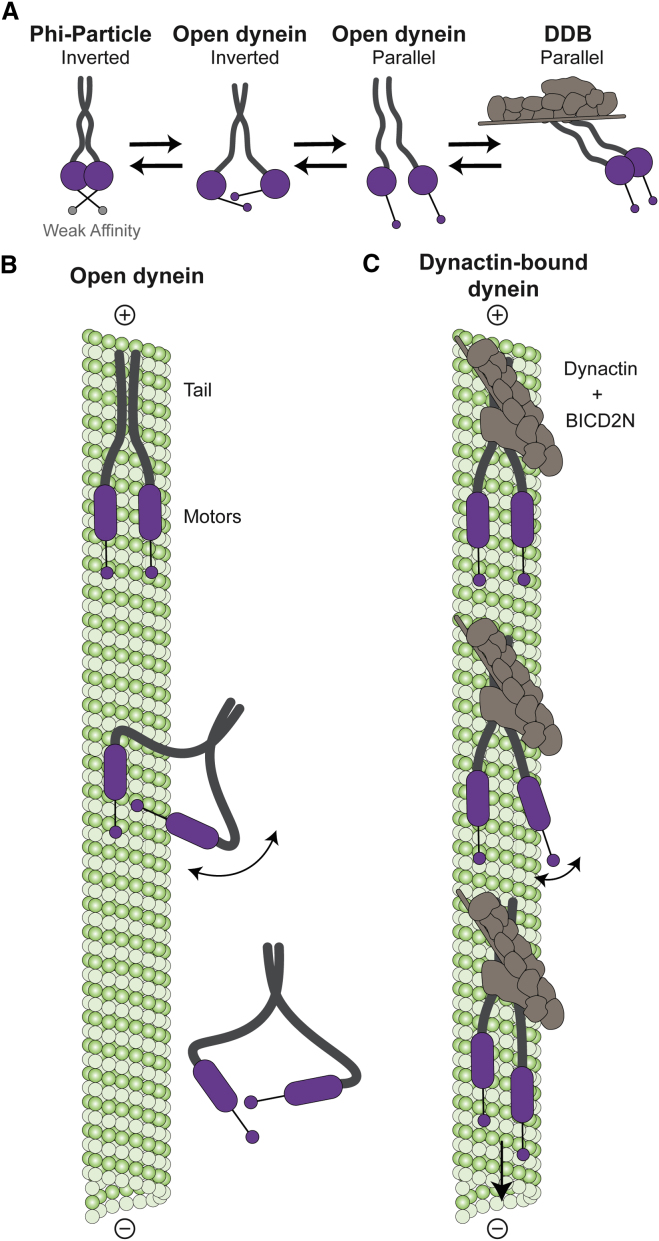
Cytoplasmic dynein-1 binds dynactin and cargo adaptor proteins to form a transport machine capable of long-distance processive movement along microtubules. However, it is unclear why dynein-1 moves poorly on its own or how it is activated by dynactin. Here, we present a cryoelectron microscopy structure of the complete 1.4-megadalton human dynein-1 complex in an inhibited state known as the phi-particle. We reveal the 3D structure of the cargo binding dynein tail and show how self-dimerization of the motor domains locks them in a conformation with low microtubule affinity. Disrupting motor dimerization with structure-based mutagenesis drives dynein-1 into an open form with higher affinity for both microtubules and dynactin. We find the open form is also inhibited for movement and that dynactin relieves this by reorienting the motor domains to interact correctly with microtubules. Our model explains how dynactin binding to the dynein-1 tail directly stimulates its motor activity.

Keywords: activation; auto-inhibition; cryo-EM; dynactin; dynein; microtubule; motor; phi-particle.


Figures

None
Graphical abstract
Figure 1
Figure 1
Cryo-EM 3D Reconstruction of Full-Length Human Dynein-1 (A) Overview of the dynein-1 phi-particle. Surface rendering of dynein-1, unsharpened and low-pass filtered to 15 Å (transparent gray) containing the 8.4 Å structure of the tail (cyan, sharpened map) and 3.8 Å structure of the self-dimerized motor domains (purple, sharpened map). (B) Representative electron density of α helices in tail and side chains in the motor domains. Cartoon colored as in (A). See also Figure S1, Table S1, and Movies S1 and S2.
Figure S1
Figure S1
Cryo-EM Image Processing Summary, Related to Figure 1 (A) Negative-stain electron micrograph of the recombinant human dynein-1. Red arrowheads indicate phi-dynein and yellow arrowheads indicates open-dynein. Scale bar 100nm. (B) Example cryoelectron micrograph of recombinant human dynein-1 used for the 3D reconstructions. Red arrowheads show examples of phi-dynein particles. Scale bar 100nm. (C) Initial 2D classification of the cryo-EM data shows that the motor domains align well, but the tail shows significant conformational flexibility with respect to the motor domains and so appears blurred. Scale bar 20nm. (D) Further 2D sub-classification reveals the relative movement between the tail and motor domains, as well as flexibility within the tail region itself. Scale bar 20nm. (E) The 2D class averages of motor domains obtained by reclassification of recentered particles which have been masked to exclude the tail. Scale bar 20nm. (F) The 2D class averages of tail obtained by reclassification of recentered particles which have been masked to exclude the motor domains. Scale bar 20nm. (G) FSC curves of the best resolved classes of the motor domain (purple) and tail (cyan). (H) Local resolution of the two cryo-EM density maps, as plotted by ResMap. Most regions of the tail are resolved to a resolution of ∼7-9Å. The motor domain resolution ranges from ∼3.3Å in the core to ∼4.3Å on the surface.
Figure 2
Figure 2
Architecture of the Dynein-1 Tail (A) An unsharpened map of the tail, low-pass filtered to 15 Å. Subunits are colored as in the cartoon. The heavy chain (HC) N-terminal dimerization domain (NDD) holds HC A and HC B together. The HCs bind the intermediate chains (IC) and light intermediate chains (LIC). The light chains Robl, LC8, and Tctex bind to the IC N-terminal extended region (gray in cartoon, not visible in the map). (B) Ribbon and cylinder representation of the tail colored as in (A). Helical bundles 1–9 and accessory chain binding sites are shown with the IC N terminus (IC-N) in cartoon of HC A (right). (C) Unsharpened maps of the tail, low-pass filtered to 15 Å, in either its twisted (dark purple) or parallel (light green) form show the NDD sitting between helical bundles 1 and 2. (D) Robl binds the N-terminal extended region of IC A and IC B holding the ICs at a 135° rotation relative to each other. Robl is closer to IC A than IC B. (E) Contact site between HC helix bundles 7 and 8. HC A, HC B, and LIC A (green) are shown in the 8.7-Å electron density map (transparent gray). See also Figures S2 and S3 and Movies S1, S3, and S4.
Figure S2
Figure S2
Architecture of the Sharpened 8.4-Å Tail Map, Related to Figure 2 (A) Segmentation and identification of all the subunits in tail as in Figure 2A, but using the sharpened 8.4Å map. The dotted circles indicate the most flexible parts of the map in which the density is over-sharpened. (B) Electron density of the nine HC helical bundles in the tail, containing the fitted (1), built (2-8) or modeled (9) helical bundles in ribbon representation. Density shown for bundles 2-8 is from the sharpened map and for bundles 1 and 9 is from the un-sharpened, low-pass filtered map. We assume all the density shown corresponds to the HC, but do not rule out the possibility some is contributed by elements in ICs and LICs. (C) Electron density map and the fitted homology model of the β-propeller WD40 domain of the IC. (D) The interaction between HC bundles 6 - 7 and the LIC. The electron density map is shown in the surface representation (transparent gray) and is fitted with the helical bundles of HC A (purple) and HC B (pink) and the homology model of human LIC (green), generated from Chaetomium thermophilum. (E) Ribbon representation of the contact region between LIC B and HC B. A series of conserved hydrophobic residues of the LIC (yellow, stick representation) are seen to interact with the HC.
Figure S3
Figure S3
Structural Details of Accessory Chain Binding, Related to Figure 2 (A) Electron density map and fitted Robl solution structure. (B) Electron density map of a typical dynein tail class showing electron density between Robl and LC8 (left). The green region was not assigned to any previously known structure, but its length (∼20nm curve) is compatible with the predicted length of the IC linker region sequence (bottom). A projected electron density representation (right) shows weak electron density in this region (dotted circle), indicating inherent flexibility. (C) A structural comparison of the two major tail conformations – parallel (green) and twisted (purple). Dotted circles correspond to areas with significant structural changes between the two conformations: N-terminal dimerization domain (top left), Robl (right), and LC8/Tctex (bottom left). (D) Close up view of Robl region as in C with cartoon to illustrate 25° rotation. (E) Close up of LC8/Tctex region as in C with cartoon to show probable movement of the LCs. (F) Cylinder and surface representation of HC contact site near the LIC. This region has 120° rotational symmetry.
Figure 3
Figure 3
Motor Dimerization Locks Phi-Dynein into a Weak Microtubule Binding State (A) The dimeric motor domains in the phi-particle from the side (left) and top (right), showing the linker (purple), ring of six AAA+ domains (colored as in cartoon), stalk (yellow), buttress (orange), and C-terminal domain (CTD, in gray). MTBD, microtubule binding domain. (B) The motor domains from the phi-particle and the crystal structure of cytoplasmic dynein-2 bound to ADP.vanadate (ADP.Vi, PDB: 4RH7). Coiled-coil helices 1 and 2 (CC1 and CC2) control microtubule affinity. Both motors display a bent linker and stalks that have low microtubule affinity due to the bulge in CC2. (C) AAA1 nucleotide binding sites are similar in ADP.Vi-bound dynein-2 and the ADP-bound dynein-1 phi-particle. The main catalytic residues are labeled: WB, Walker B; SI, Sensor-1; RF, Arginine finger. See also Figure S4.
Figure S4
Figure S4
Structural Details of the Phi-Particle Motor Domains, Related to Figure 3 (A) Comparison of coiled-coil stalks in our dynein-1 phi-particle structure (left) and crystal structures of the low microtubule affinity, ADP.Vi bound dynein-2 motor (middle, PDB: 4RH7) and the high microtubule affinity, ADP bound dynein-1 motor (right, PDB: 3VKG). (B) Stick representation of the phi-particle AAA1 active site showing the ADP electron density (red mesh) and surrounding residues (transparent mesh). (C) The electron density maps (red mesh) suggests that nucleotide binding sites AAA1, AAA3 and AAA4 contain ADP, while AAA2 contains an ATP. (D) Positions of the four main contact sites located at the interface of the motor domain dimer. (E) Enlarged views of each contact site. Electrostatic interactions between residues are marked with black dotted lines. Residues with mutations associated with human neuropathies are underlined in red (at an interface residue) or shown in red text (next to an interface residue).
Figure 4
Figure 4
Disruption of Motor Self-Dimerization Increases Microtubule and Dynactin Affinity (A) Representative 2D class averages of negative stain EM images of wild-type dynein (wtDyn) and dynein with interface mutations K1610E and R1567E (mtDyn). wtDyn predominantly adopts the phi-particle form, whereas mtDyn classes are in the open form. (B) Quantification of proportion of phi- and open-dynein in wtDyn and mtDyn. The phi-particle is disrupted in mtDyn. Mean ± SEM is shown. (C) The microtubule association rate of mtDyn is significantly higher than wtDyn. Mean number of events per micrometer microtubule per nM dynein per second is shown ± SEM. ∗∗∗∗p < 0.0001 in an unpaired, two-tailed t test. n = 42 microtubules (wtDyn), n = 29 microtubules (mtDyn), three independent experiments. (D) The average length of time spent bound to microtubules (dwell time) for isolated wtDyn and mtDyn is not significantly different. Average dwell was calculated for two-phase exponential decay fits of six repeats for each condition (±SEM). n.s. in an unpaired, two-tailed t test, n = 6. (E) Size exclusion chromatography shows that the mtDyn forms greater amounts of Dynein/Dynactin/BICD2N (DDB) complex than wtDyn. The elution volume of each component and the void volume (V0) is indicated. (F) Kymographs of TMR labeled wtDyn or mtDyn mixed with dynactin and BICD2N to form wtDDB or mtDDB show that both complexes can move processively, over long distances on microtubules. (G) mtDDB shows twice the number of processive events that wtDDB. Mean number of processive events (±SEM) are shown per micrometer microtubule per pM dynein. ∗∗∗∗p < 0.0001 in an unpaired, two-tailed t test when n = 31 microtubules (wtDDB and mtDDB). (H) Kymographs show that neither wtDyn or mtDyn move processively on microtubules in the absence of dynactin and BICD2N. This suggests both phi- and open-dynein are auto-inhibited. See also Figure S5.
Figure S5
Figure S5
Characterization of Phi-Interface Mutated Dynein, Related to Figure 4 (A) SDS-PAGE of wtDyn and mtDyn samples after SYPRO-Ruby staining show that they have similar subunit stoichiometry. (B) wtDyn and mtDyn motor velocities measured in microtubule gliding assays. Dynein was adhered non-specifically to the glass slide, with the velocity of free microtubules across the field of view determined. wtDyn n = 260 microtubules, mtDyn n = 346. Data shows mean ± SEM. (C) Representative 2D classes from negative stain images of wtDyn or mtDyn identified as being in a phi- or open- or ambiguous conformation, as used for quantification. For mtDyn, no obvious phi-particle classes were observed. Ambiguous classes are those that could not be assigned as phi- or open-dynein. (D) The frequency of phi-dynein observed after 2D classification of wtDyn incubated in the presence of indicated nucleotides. The 0 mM nucleotide sample was obtained by omitting nucleotides from SEC performed in the final step of purification. Contrary to previous reports (Torisawa et al., 2014), we did not observe a significant difference in the proportion of phi-particle in these preparations. Mean ± SEM is shown. (E) Dwell times of isolated wtDyn or mtDyn binding to microtubules were calculated by fitting a two-phase exponential decay model to each independent experiment. Data was plotted as a histogram of the percentage of particles remaining attached to the microtubule for a given amount of time after binding (Bin size = 0.125 s). The average dwell time was taken to be the average time constant of the fast phase (±SD, n > 300 events for each repeat, 6 repeats). The fast phase accounts for ∼80% of the fit. In an unpaired Student’s t test, neither the slow or fast phase fits were significantly different. (F) Analytical SEC has been repeated with 3 different preparations of wtDyn, mtDyn, Dynactin and BICD2N. The proportion of protein in the DDB complex peak relative to the total protein amount was calculated using an area under the curve analysis in GraphPad Prism. On average, wtDDB had 11.5 ± 2% protein in the DDB peak whereas mtDDB had 27.3 ± 1% (Mean ± SEM). ∗∗∗p < 0.001 in an unpaired, two-tailed t test when n = 4 for each. (G) Size exclusion chromatography (SEC) shows that the mtDyn and wtDyn elute at similar volumes. Individual traces of dynactin and BICD2N are also shown. The identity of each component was confirmed by SDS-PAGE. (H) SEC of mtDyn or wtDyn mixed with dynactin show that complex formation only occurs in the presence of BICD2N.
Figure 5
Figure 5
Dynactin Binding Reorients Dynein Motor Domains (A) 2D classification and local refinement of motor domains resolves their orientation. Representative composite images of isolated, open-dynein in negative stain EM and dynein in DDB in cryo-EM (after subtraction of dynactin density). In the dominant open-dynein conformation, the stalks point toward each other (inverted). In DDB they are parallel. Positions of the NDDs (red), ICs (dark blue), and LICs (green) are indicated in each cartoon. (B) Quantification of the proportion of dynein particles with their motor domains inverted, parallel, or in an ambiguous orientation after focused classification. Mean ± SEM is shown. (C) The distribution of distances between motor domains is greater in open-dynein than DDB. Bin size, 2.5 nm. (D) 8.7 Å cryo-EM structure of DDB. Each component is labeled. The dynein motor domains are too flexible to be resolved. (E) Relative rotation between individual helical bundles in each HC in the phi-particle and DDB. Rotation is measured around the long axis of the tail. The HCs of dynein in DDB lie more parallel than in the phi-particle. See also Figure S6 and Movies S5 and S7.
Figure S6
Figure S6
2D and 3D Analysis of Dynein When Bound to Dynactin, Related to Figure 5 (A) Local classification and refinement of each motor domain allowed us to determine the location of stalk, neck and LIC near the motor. We can therefore show that open-dynein (left) predominantly has inverted stalks while DDB-bound dynein has parallel stalks (middle). Examples of ambiguous orientation are also shown (right). Composite images generated in this process are shown below. Scale bar 20nm. (B) Representative cryo electron micrograph of the DDB complex used for the 3D reconstruction. Scale bar 100nm. (C) 2D classification of DDB complexes shows that the tail region near dynactin is stable compared to the motor domains which are more flexible and appear blurred. Scale bar 40nm. (D) The FSC curve of the 8.7Å 3D reconstruction of DDB and the 12.4Å structure of the masked tail from DDB. (E) Comparison of our DDB structures (middle and right) to the previous TDB structure (left) (EMDB: 2861). These structures are similar overall but the DDB structure (middle) contains more electron density in the HC and LIC region. The focused classification structure (right) allows us to build and almost complete model of the tail. In this case, 2D and 3D classification took place on particles that had the dynactin density subtracted. Dynactin and BICD2N are shown as in the DDB (middle) structure for reference.
Figure 6
Figure 6
Phi-Particle Disruption Changes Dynein Localization and Causes Mitotic Defects in HeLa Cells (A) Western blots of lysates from HeLa cells and clonal HeLa cell lines stably expressing dynein BAC transgenes. The DHCWT cell line expresses a wild-type GFP-dynein HC (GFP-DHC) transgene. DHCMT-A/DHCMT-B are two independent cell lines expressing mutant GFP-DHC (R1567E and K1610E). Top: Blots against GFP, p150Glued, and α-tubulin. Expression levels of GFP (dynein) are similar in DHCWT and DHCMT-B. Bottom: Blots against DHC. Expression of GFP-DHC (upper band) is similar to or lower than endogenous DHC (lower band) in transgene cell lines. GFP-DHC (upper band) is absent in HeLa lysates. (B) Immunofluorescence with antibodies against α-tubulin, GFP, and pericentrin (PCNT) on DHCWT and DHCMT-B cell lines. G2-synchronized cells were fixed either before nocodazole treatment (No drug), after 30 min with 3.3 μM nocodazole or after washout of the nocodazole for 3 min. Scale bar, 10 μm. (C) Quantification of GFP intensity around individual centrosomes in cells from (B). DHCMT-B show GFP (Dynein) enrichment compared to DHCWT. The difference is abolished by nocodazole treatment and recovers after drug washout. ∗∗∗p < 0.001, ∗∗p < 0.01 in a Kruskal-Wallis test followed by paired Wilcoxon tests. n > 86 per condition, three independent experiments. (D) Still images from movies of DHCWT and DHCMT-B cells synchronized in G2 and treated with nocodazole (3.3 μM) for 30 min before washout. Time (t) is relative to start of the washout. Scale bar, 10 μm. (E) Quantification of the GFP intensity at microtubule-dependent foci in cells from (D) show that accumulation is greater and faster in DHCMT-B. n = 10 cells per condition, Mean ± SD shown. (F) Immunofluorescence of HeLa, DHCWT, DHCMT-A, and DHCMT-B metaphase cells with antibodies against α-tubulin, GFP, and p150Glued. Scale bar, 5 μm. (G and H) The ratio of GFP (Dynein, G) or p150 (Dynactin, H) intensity at individual spindle poles divided by the corresponding intensity in the cytoplasm for DHCWT, DHCMT-A, and DHCMT-B cells. Dynein and dynactin are enriched at spindle poles of DHCMT-A/B cells. ∗∗∗p < 0.001, p < 0.025 in a Kruskal-Wallis test followed by paired Wilcoxon tests. n > 120 spindle poles per condition from three independent experiments. (I) Cells imaged with DAPI (DNA) and α-tubulin antibodies (top row) or GFP (bottom row; displayed with a “fire” lookup table) showing representative prometaphase phenotypes in DHCWT, DHCMT-A, and DHCMT-B cells. Scale bar, 5 μm. (J) Quantification of the average percentage of prometaphase cells with monopolar spindles in HeLa, DHCWT, and DHCMT-A/B cells shows that mutation of the phi-dynein interface leads to an increase in mitotic defects. Mean ± SD is shown, ∗∗∗p < 0.001, ∗∗p < 0.01 in a paired Student’s t test. n > 235 cells from three experiments.
Figure 7
Figure 7
Model for How Dynactin Activates Processive Movement of Single Dyneins (A) Isolated dynein exists in either the phi-particle (motors dimerized, low affinity for the microtubule) or the open form (increased microtubule affinity). In open-dynein, there is an equilibrium between forms where the motor domain stalks are inverted or parallel. Dynactin and cargo adaptor stabilize open-dynein in its parallel state. (B) Open-dynein binds microtubules (green) with both motor domains (purple). During stepping the free motor domain is slow to rebind due to its preferred inverted orientation and large range of movement. Dissociation of dynein from the microtubule is likely. (C) In DDB, the dynein motor domains prefer a parallel orientation and are relatively constrained. DDB therefore moves processively because rebinding of a stepping motor is more likely than dissociation of the whole complex.

References

    1. Amos L.A. Brain dynein crossbridges microtubules into bundles. J. Cell Sci. 1989;93:19–28. - PubMed
    1. Bai X.C., Rajendra E., Yang G., Shi Y., Scheres S.H. Sampling the conformational space of the catalytic subunit of human γ-secretase. eLife. 2015;4:e11182. - PMC - PubMed
    1. Belyy V., Schlager M.A., Foster H., Reimer A.E., Carter A.P., Yildiz A. The mammalian dynein-dynactin complex is a strong opponent to kinesin in a tug-of-war competition. Nat. Cell Biol. 2016;18:1018–1024. - PMC - PubMed
    1. Bird A.W., Erler A., Fu J., Hériché J.-K., Maresca M., Zhang Y., Hyman A.A., Stewart A.F. High-efficiency counterselection recombineering for site-directed mutagenesis in bacterial artificial chromosomes. Nat. Methods. 2011;9:103–109. - PubMed
    1. Brown A., Long F., Nicholls R.A., Toots J., Emsley P., Murshudov G. Tools for macromolecular model building and refinement into electron cryo-microscopy reconstructions. Acta Crystallogr. D Biol. Crystallogr. 2015;71:136–153. - PMC - PubMed

MeSH terms