

Downregulation of miR-503 Promotes ESCC Cell Proliferation, Migration, and Invasion by Targeting Cyclin D1
- PMID: 28602785
- PMCID: PMC5487524
- DOI: 10.1016/j.gpb.2017.04.003
Downregulation of miR-503 Promotes ESCC Cell Proliferation, Migration, and Invasion by Targeting Cyclin D1
Abstract
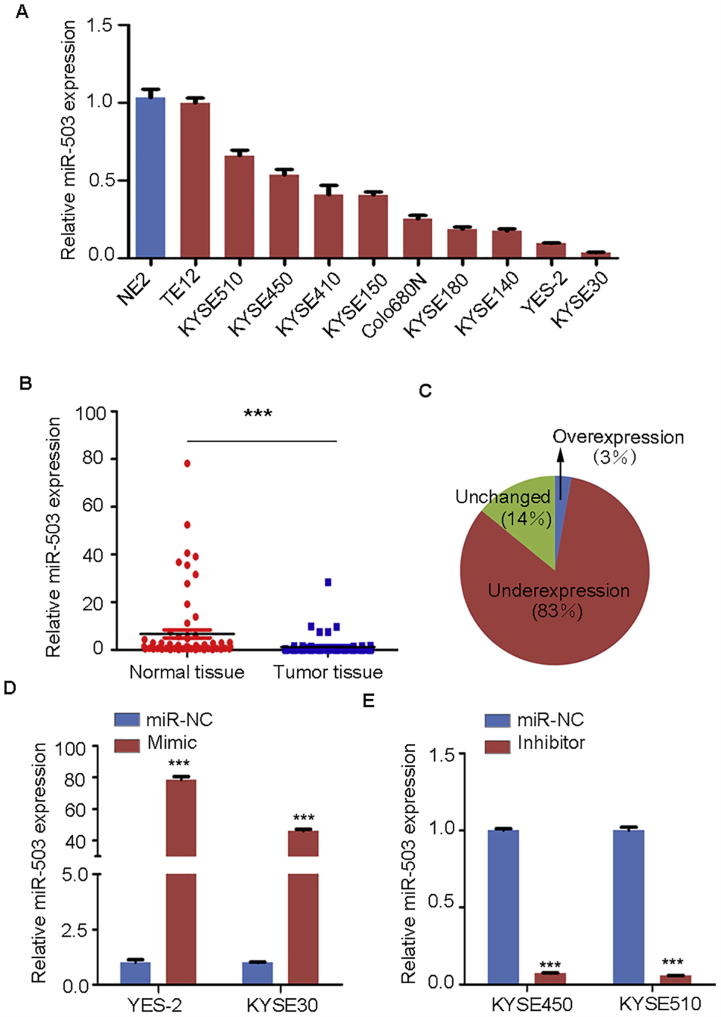
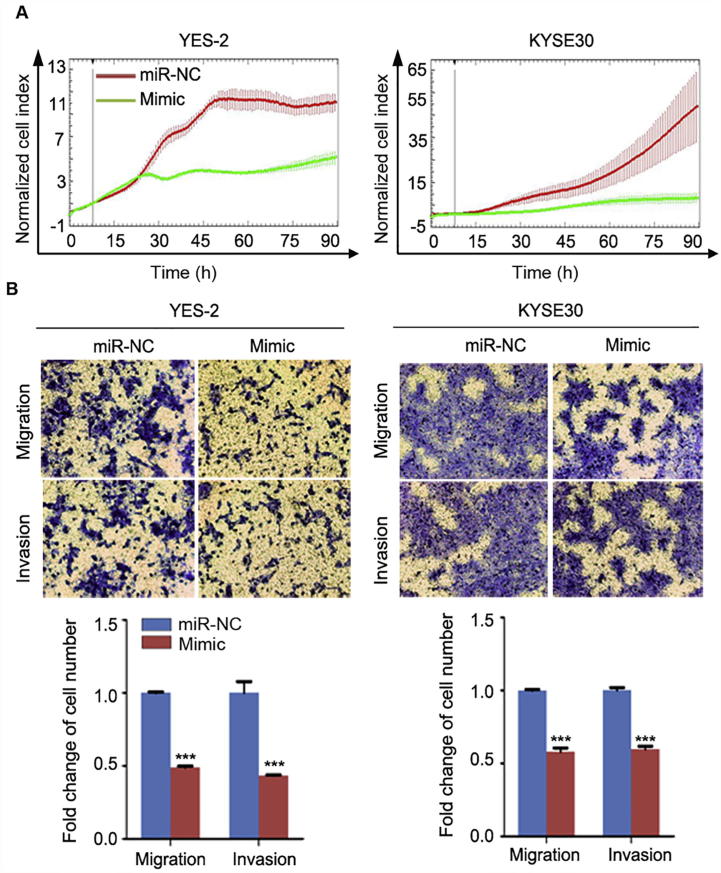
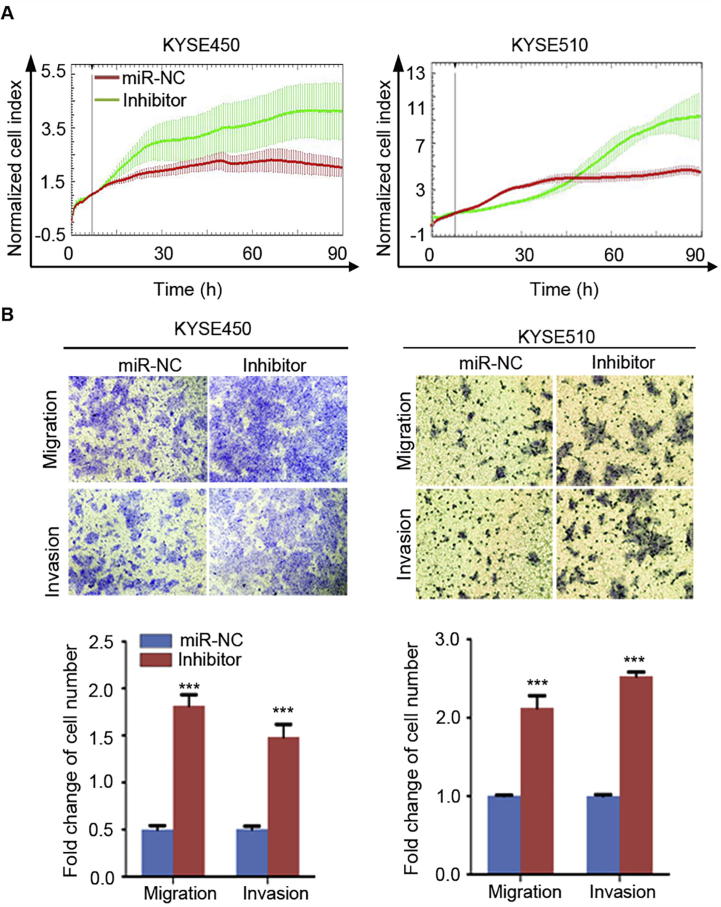
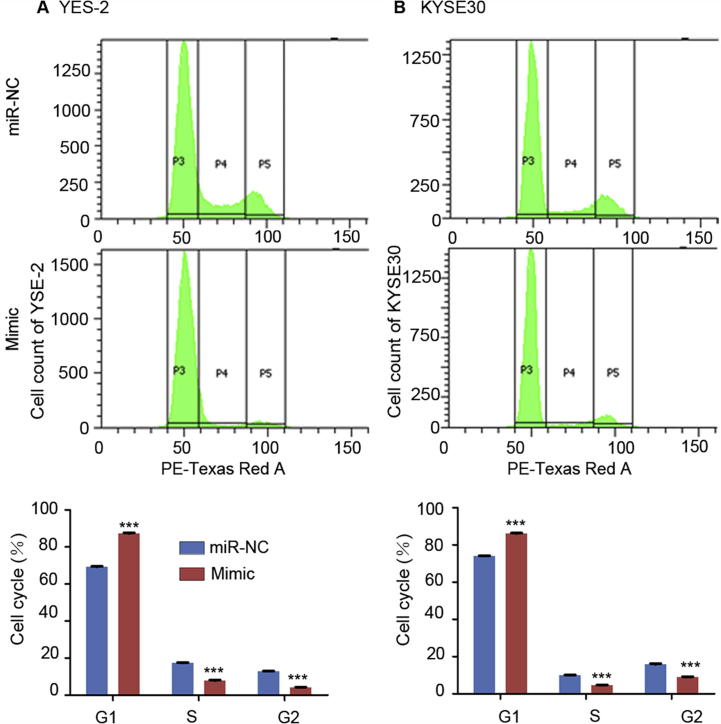
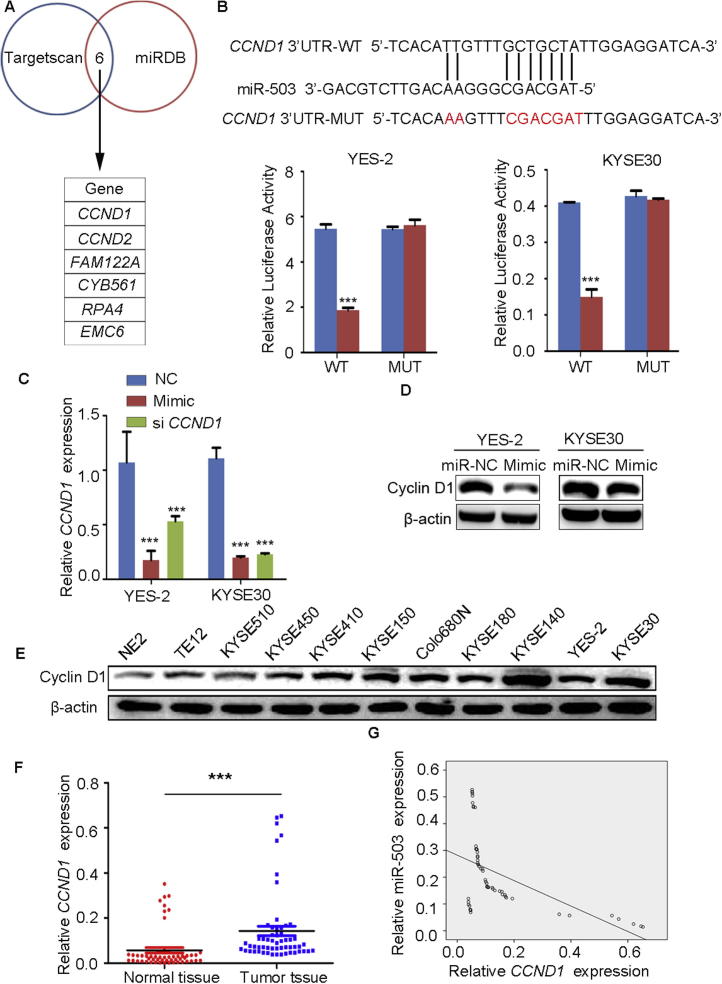
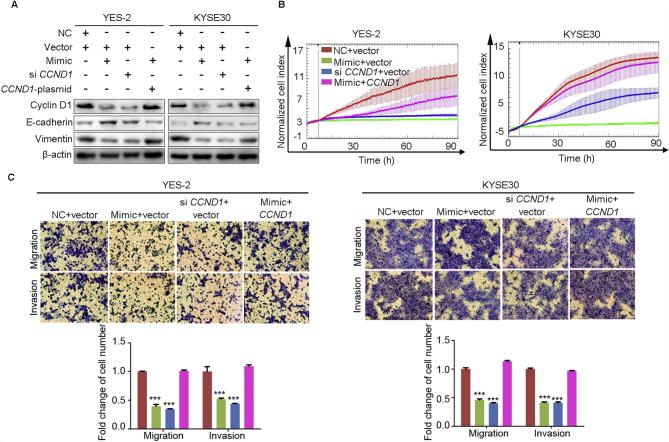
Esophageal squamous cell carcinoma (ESCC) is one of the most aggressive cancers in China, but the underlying molecular mechanism of ESCC is still unclear. Involvement of microRNAs has been demonstrated in cancer initiation and progression. Despite the reported function of miR-503 in several human cancers, its detailed anti-oncogenic role and clinical significance in ESCC remain undefined. In this study, we examined miR-503 expression by qPCR and found the downregulation of miR-503 expression in ESCC tissue relative to adjacent normal tissues. Further investigation in the effect of miR-503 on ESCC cell proliferation, migration, and invasion showed that enhanced expression of miR-503 inhibited ESCC aggressive phenotype and overexpression of CCND1 reversed the effect of miR-503-mediated ESCC cell aggressive phenotype. Our study further identified CCND1 as the target gene of miR-503. Thus, miR-503 functions as a tumor suppressor and has an important role in ESCC by targeting CCND1.
Keywords: Cyclin D1; Esophageal squamous cell carcinoma; Migration and invasion; Proliferation; miR-503.
Copyright © 2017 Beijing Institute of Genomics, Chinese Academy of Sciences and Genetics Society of China. Production and hosting by Elsevier B.V. All rights reserved.
Figures
Similar articles
-
MiR-455-3p acts as a prognostic marker and inhibits the proliferation and invasion of esophageal squamous cell carcinoma by targeting FAM83F.Eur Rev Med Pharmacol Sci. 2017 Jul;21(14):3200-3206. Eur Rev Med Pharmacol Sci. 2017. PMID: 28770965
-
The CADM2/Akt pathway is involved in the inhibitory effect of miR-21-5p downregulation on proliferation and apoptosis in esophageal squamous cell carcinoma cells.Chem Biol Interact. 2018 May 25;288:76-82. doi: 10.1016/j.cbi.2018.04.021. Epub 2018 Apr 19. Chem Biol Interact. 2018. PMID: 29680210
-
miR-1 suppresses the growth of esophageal squamous cell carcinoma in vivo and in vitro through the downregulation of MET, cyclin D1 and CDK4 expression.Int J Mol Med. 2016 Jul;38(1):113-22. doi: 10.3892/ijmm.2016.2619. Epub 2016 May 31. Int J Mol Med. 2016. PMID: 27247259 Free PMC article.
-
miR-483-3p plays an oncogenic role in esophageal squamous cell carcinoma by targeting tumor suppressor EI24.Cell Biol Int. 2016 Apr;40(4):448-55. doi: 10.1002/cbin.10585. Epub 2016 Feb 4. Cell Biol Int. 2016. PMID: 26801660
-
Genetic steps in the development of squamous cell carcinoma of the esophagus.Mutat Res. 2000 Apr;462(2-3):335-42. doi: 10.1016/s1383-5742(00)00019-3. Mutat Res. 2000. PMID: 10767643 Review.
Cited by
-
LncRNA DLGAP1-AS2 regulates miR-503/cyclin D1 to promote cell proliferation in non-small cell lung cancer.BMC Pulm Med. 2021 Aug 28;21(1):277. doi: 10.1186/s12890-021-01633-0. BMC Pulm Med. 2021. PMID: 34454450 Free PMC article.
-
Identification of cyclin D1 as a major modulator of 3-nitropropionic acid-induced striatal neurodegeneration.Neurobiol Dis. 2022 Jan;162:105581. doi: 10.1016/j.nbd.2021.105581. Epub 2021 Dec 3. Neurobiol Dis. 2022. PMID: 34871739 Free PMC article.
-
The Role and Interactions of Programmed Cell Death 4 and its Regulation by microRNA in Transformed Cells of the Gastrointestinal Tract.Front Oncol. 2022 Jun 29;12:903374. doi: 10.3389/fonc.2022.903374. eCollection 2022. Front Oncol. 2022. PMID: 35847932 Free PMC article. Review.
-
MicroRNA-153-3p regulates cell proliferation and cisplatin resistance via Nrf-2 in esophageal squamous cell carcinoma.Thorac Cancer. 2020 Mar;11(3):738-747. doi: 10.1111/1759-7714.13326. Epub 2020 Feb 3. Thorac Cancer. 2020. PMID: 32012470 Free PMC article.
-
miR-143 inhibits migration and invasion through regulating LASP1 in human esophageal cancer.Int J Clin Exp Pathol. 2019 Feb 1;12(2):466-476. eCollection 2019. Int J Clin Exp Pathol. 2019. PMID: 31933851 Free PMC article.
References
-
- Hosch S.B., Stoecklein N.H., Pichlmeier U., Rehders A., Scheunemann P., Niendorf A. Esophageal cancer: the mode of lymphatic tumor cell spread and its prognostic significance. J Clin Oncol. 2001;19:1970–1975. - PubMed
-
- Song Y., Li L., Ou Y., Gao Z., Li E., Li X. Identification of genomic alterations in oesophageal squamous cell cancer. Nature. 2014;509:91–95. - PubMed
-
- Shi X.F., Wang H., Xiao F.J., Yin Y., Xu Q.Q., Ge R.L. miRNA-486 regulates angiogenic activity and survival of mesenchymal stem cells under hypoxia through modulating Akt signal. Biochem Biophys Res Commun. 2016;470:670–677. - PubMed
MeSH terms
Substances
LinkOut - more resources
Full Text Sources
Other Literature Sources
Medical
Research Materials
