. 2017 Sep:106:9-25.
doi: 10.1016/j.fgb.2017.05.007. Epub 2017 Jun 9.

Species boundaries in the human pathogen Paracoccidioides

Affiliations

Species boundaries in the human pathogen Paracoccidioides

David A Turissini et al. Fungal Genet Biol. 2017 Sep.

Abstract

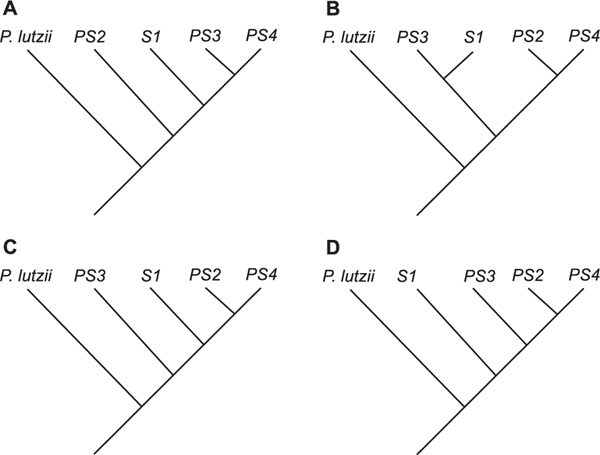
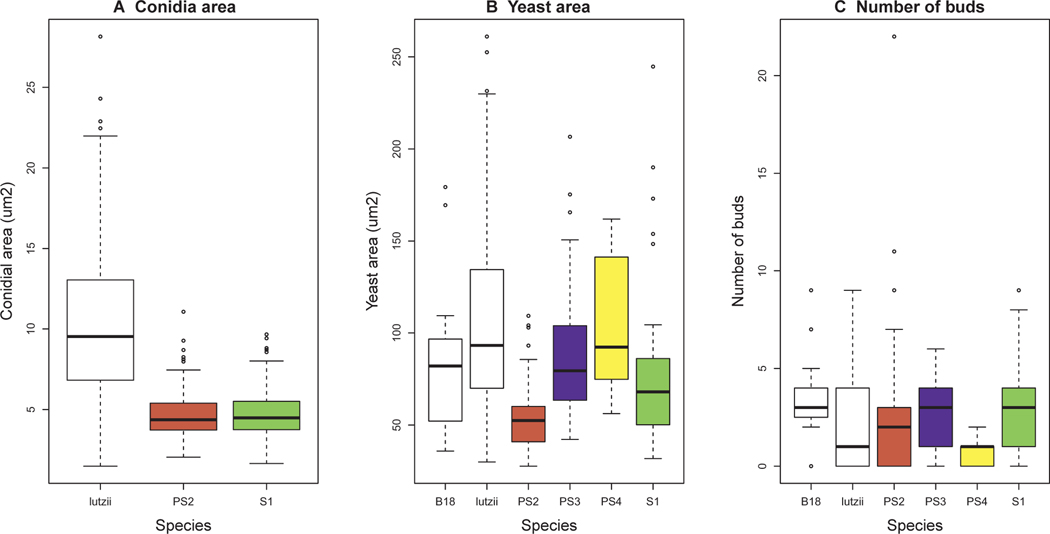
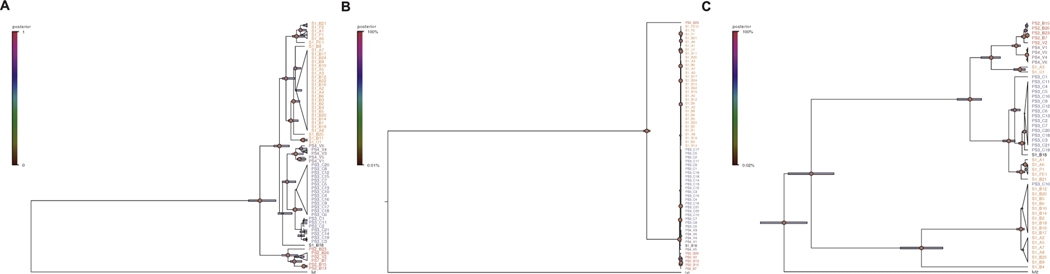
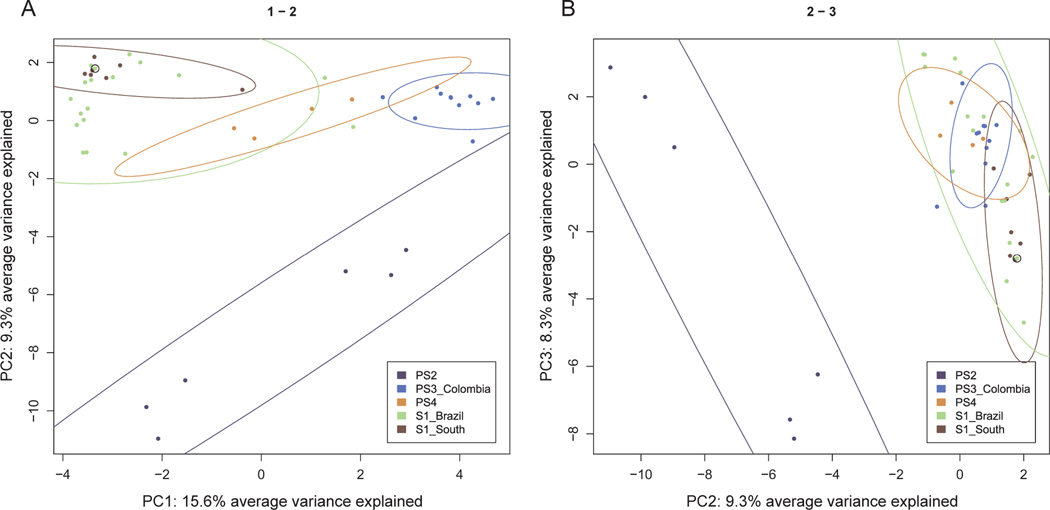
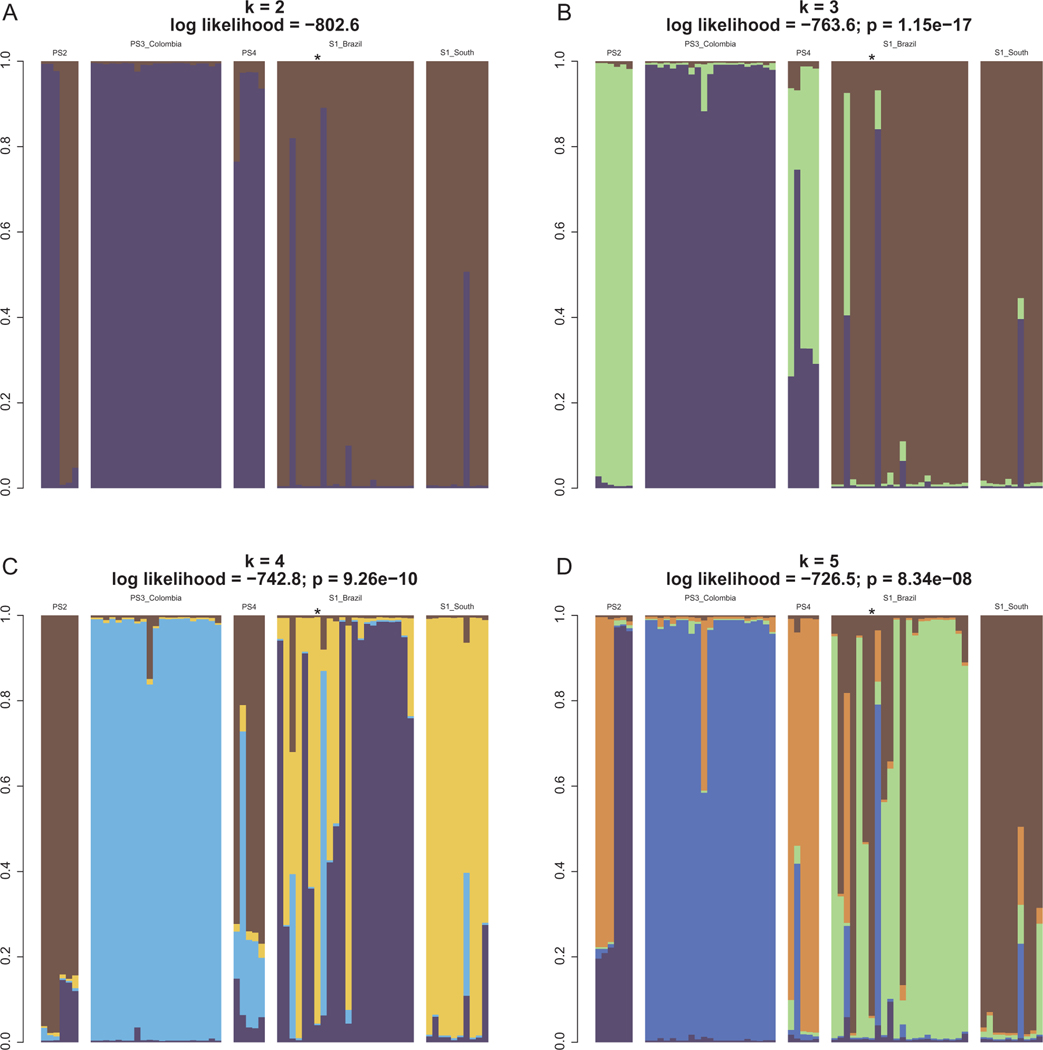
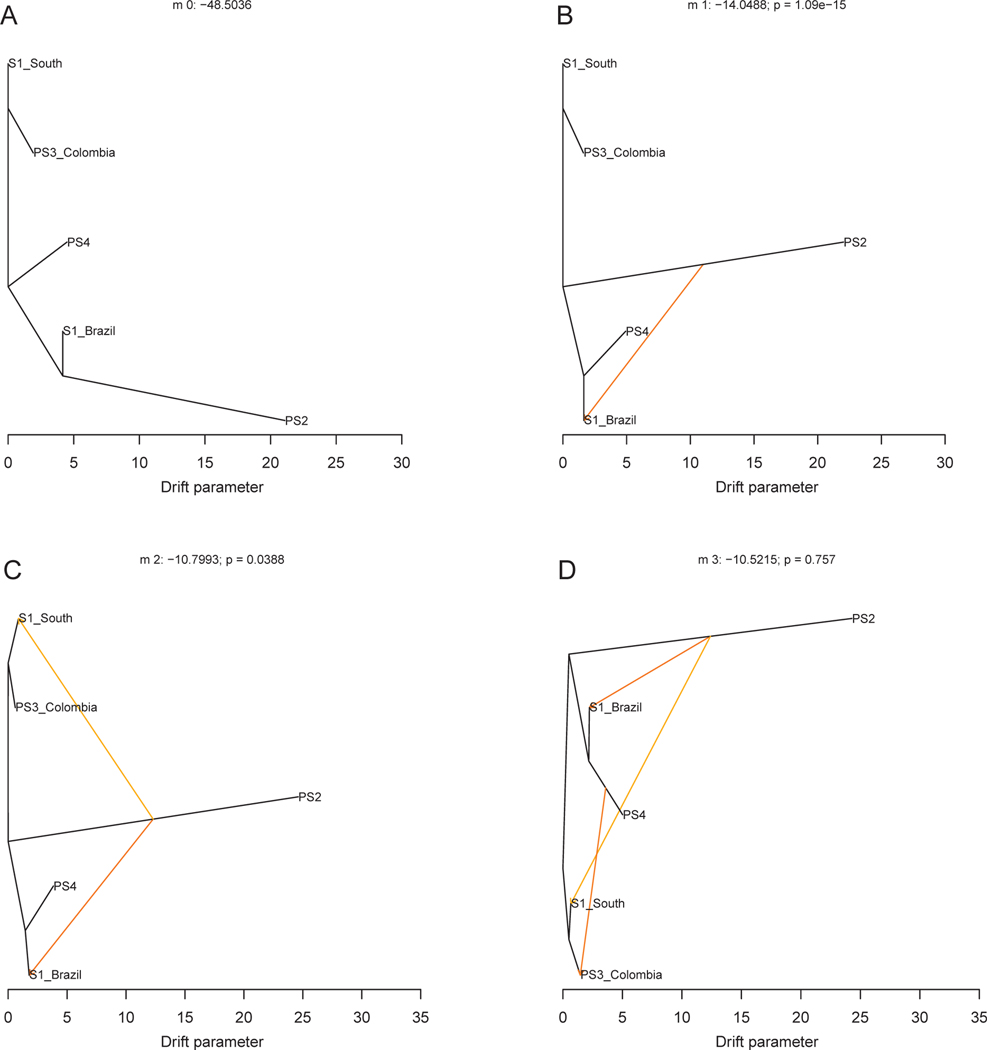
The use of molecular taxonomy for identifying recently diverged species has transformed the study of speciation in fungi. The pathogenic fungus Paracoccidioides spp has been hypothesized to be composed of five phylogenetic species, four of which compose the brasiliensis species complex. Nuclear gene genealogies support this divergence scenario, but mitochondrial loci do not; while all species from the brasiliensis complex are differentiated at nuclear coding loci, they are not at mitochondrial loci. We addressed the source of this incongruity using 11 previously published gene fragments, 10 newly-sequenced nuclear non-coding loci, and 10 microsatellites. We hypothesized and further demonstrated that the mito-nuclear incongruence in the brasiliensis species complex results from interspecific hybridization and mitochondrial introgression, a common phenomenon in eukaryotes. Additional population genetic analyses revealed possible nuclear introgression but much less than that seen in the mitochondrion. Our results are consistent with a divergence scenario of secondary contact and subsequent mitochondrial introgression despite the continued persistence of species boundaries. We also suggest that yeast morphology slightly-but significantly-differs across all five Paracoccidioides species and propose to elevate four of these phylogenetic species to formally described taxonomic species.

Keywords: Introgression; Paracoccidioides spp; Speciation.


Figures

Fig. 1.
Fig. 1.
Four possible topologies used to quantify the level of discordance between nuclear and mitochondrial loci. Topology A shows the hypothesized species tree derived from nuclear loci. Trees B-D show P2 and PS4 as sisters, consistent with shared genetic variation dictated by geography. The topologies were used to perform the AU test and the results are shown in Table 5.
Fig. 2.
Fig. 2.
Species of the Paracoccidioides brasiliensis complex differ in their mean values for three morphological traits. Each panel shows boxplots with the distribution of the three traits with the median marked by the thickest line and the 25% and 75% percentiles marked by the edges of the box. A. Conidial area. At least 20 individuals were measured per species. Data were taken from Teixeira et al. (2009) which measured only three of the five Paracoccidioides species. B. Yeast cell area. We measured two lines for each species and at least 20 cells per line. C. Number of budding cells. We measured two lines for each species and at least 23 number of individuals per line. Boxes are color-coded using the same notation as Fig. 1 with P. lutzii drawn as a white box and B18 shown as a grey box.
Fig. 3.
Fig. 3.
Rooted phylograms for the species of the Paracoccidioides brasiliensis complex using coding three types of molecular data. A. Nuclear concatenated coding loci. B. Noncoding nuclear concatenated loci. C. Mitochondrial concatenated loci. We built Bayesian-based topologies depicting the phylogenetic relationships among Paracoccidioides isolates. The topologies are rooted with P. lutzii (lut). The number above each branch indicates the support of a given branch (only branches with a posterior probability higher than 0.75) were retained. Terminal branches are color coded: PS3, blue; PS2: red; PS4: purple; S1: orange. The Bayesian posterior probability supporting each node is shown next to the relevant node and is color coded (see legend). Paracoccidioides lutzii (lut) and the isolate B18 are not color coded. Cladograms of each data type are shown in ***Figures S1–S3.
Fig. 4.
Fig. 4.
Principal component analysis for the Paracoccidioides brasiliensis species complex. The genetic variance in the genus Paracoccidioides as determined by microsatellite markers largely separates the four cryptic species in the genus. Individuals of S1 are shown in blue, PS2 in orange, PS3 in green, and PS4 in purple. 95% confidence ellipses are drawn for each species. A. Principal components (PC) 1 and 2 are shown and the percentage of variance explained by each eigenvalue is shown within parentheses on each axis. B. PC3 and PC4. No principal component explained more than 16% of the variance. Isolate B18 is marked with a green circle.
Fig. 5.
Fig. 5.
STRUCTURE analysis for the Paracoccidioides brasiliensis species complex. Each isolate is represented by a vertical bar. The length of the colored segments represents the probability of belonging to a given cluster. A. K = 2. B. K = 3. C. K = 4. D. K = 5. The logL value and the p-value of the LRT test is shown on the title of each panel. ΔK values overwhelming support the existence of five clusters corresponding to the four species of the brasiliensis species complex, with S1 having two well-structured populations. Results for other K assignments are shown in ***Figure S1. Isolate B18 is marked with an asterisk.
Fig. 6.
Fig. 6.
Treemix results show genetic differentiation between species from the Paracoccidioides brasiliensis species complex. A. Best fitting genealogy without admixture for Paracoccidioides populations calculated from the variance-covariance matrix of allele frequencies. at nine microsatellites. We estimated the likelihood of three demographic scenarios with 1 to 3 migration events (m). B. m = 1. C. m = 2. D. m = 3. To determine the best fitting demographic scenario we used LRTs to compare nested models (one migration vs. two migrations, two migrations vs. three migrations). We also used wAIC to find the best supported migration scenario (See text). The title of each panel contains the number of migrations, the likelihood, and the associated p-value when comparing that demographic scenario with the previous one. The best fitting demographic history involved two migration events from PS2 to the two subpopulations of S1 (panel B).

Similar articles

Cited by

References

    1. Abbott R, Albach D, Ansell S, et al., 2013. Hybridization and speciation. J. Evol. Biol 26, 229–246. - PubMed
    1. Ajello L, Cheng S-L, 1967. Sexual reproduction in Histoplasma capsulatum. Mycologia 59, 689. - PubMed
    1. Akaike H, 1974. A new look at the statistical model identification. IEEE Trans. Autom. Control 19, 716–723.
    1. Almeida AJ, Cunha C, Carmona JA, et al., 2009. Cdc42p controls yeast-cell shape and virulence of Paracoccidioides brasiliensis. Fungal Genet. Biol 46, 919–926. - PubMed
    1. Almeida AJ, Matute DR, Carmona JA, et al., 2007. Genome size and ploidy of Paracoccidioides brasiliensis reveals a haploid DNA content: flow cytometry and GP43 sequence analysis. Fungal Genet. Biol 44, 25–31. - PubMed

Substances

LinkOut - more resources