

Physiological Signal-Based Method for Measurement of Pain Intensity
- PMID: 28603478
- PMCID: PMC5445136
- DOI: 10.3389/fnins.2017.00279
Physiological Signal-Based Method for Measurement of Pain Intensity
Abstract
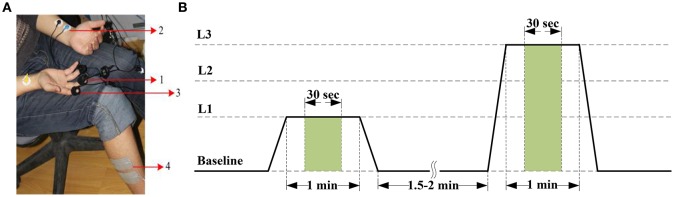
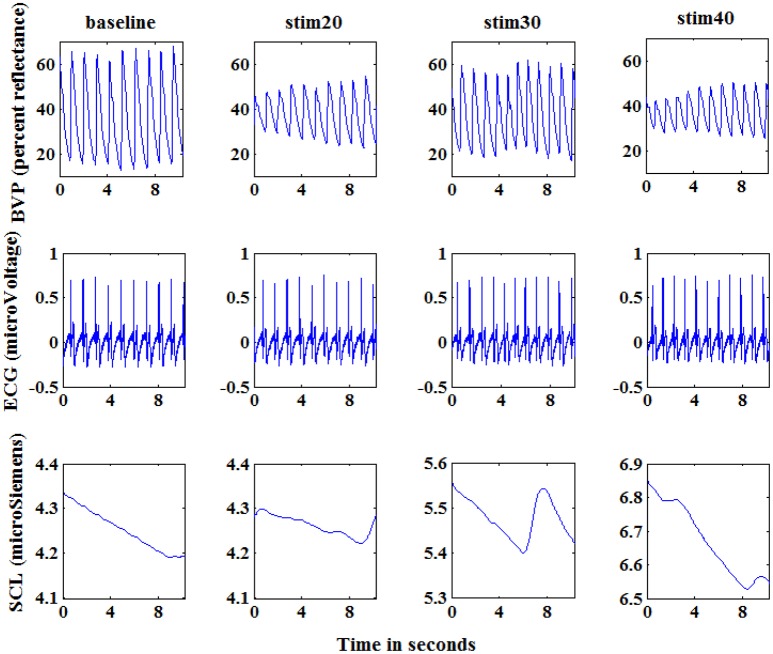
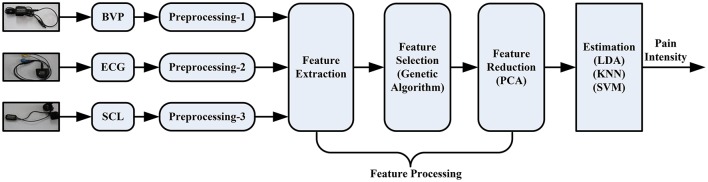
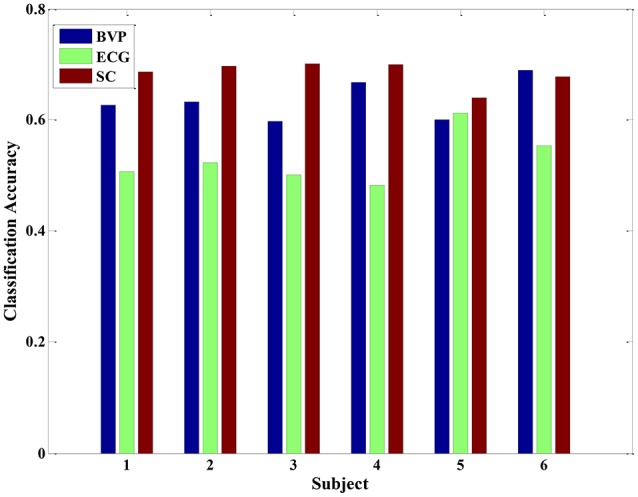
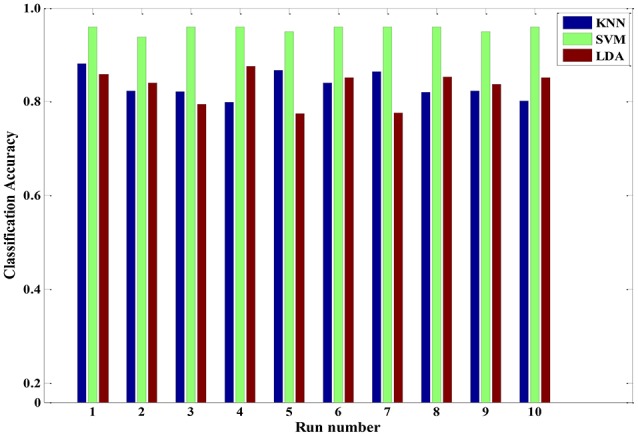
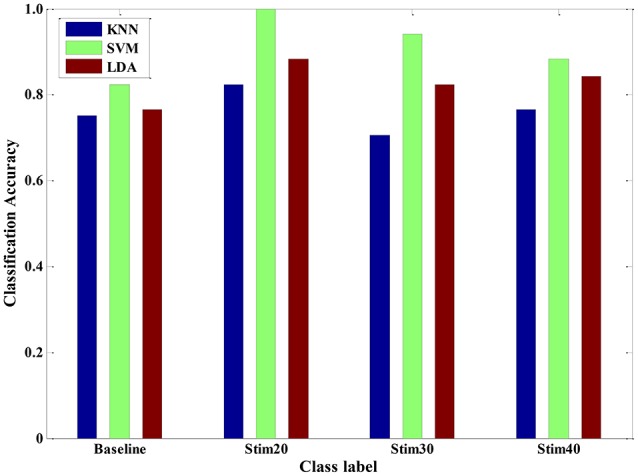
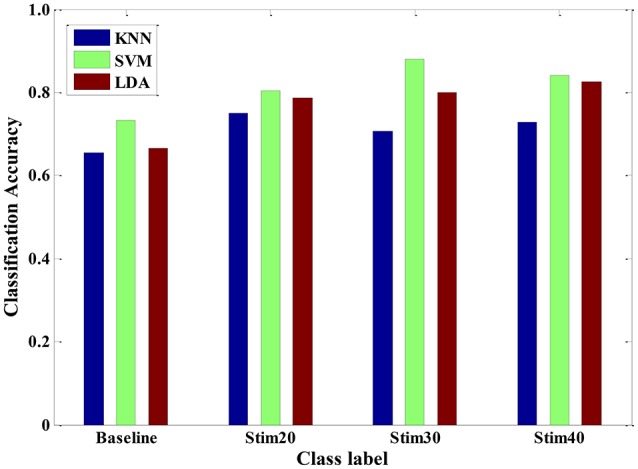
The standard method for prediction of the absence and presence of pain has long been self-report. However, for patients with major cognitive or communicative impairments, it would be better if clinicians could quantify pain without having to rely on the patient's self-description. Here, we present a newly pain intensity measurement method based on multiple physiological signals, including blood volume pulse (BVP), electrocardiogram (ECG), and skin conductance level (SCL), all of which are induced by external electrical stimulation. The proposed pain prediction system consists of signal acquisition and preprocessing, feature extraction, feature selection and feature reduction, and three types of pattern classifiers. Feature extraction phase is devised to extract pain-related characteristics from short-segment signals. A hybrid procedure of genetic algorithm-based feature selection and principal component analysis-based feature reduction was established to obtain high-quality features combination with significant discriminatory information. Three types of classification algorithms-linear discriminant analysis, k-nearest neighbor algorithm, and support vector machine-are adopted during various scenarios, including multi-signal scenario, multi-subject and between-subject scenario, and multi-day scenario. The classifiers gave correct classification ratios much higher than chance probability, with the overall average accuracy of 75% above for four pain intensity. Our experimental results demonstrate that the proposed method can provide an objective and quantitative evaluation of pain intensity. The method might be used to develop a wearable device that is suitable for daily use in clinical settings.
Keywords: feature extraction; feature selection and reduction; pain intensity quantification; pattern classification; physiological signals.
Figures
Similar articles
-
Experimental Exploration of Multilevel Human Pain Assessment Using Blood Volume Pulse (BVP) Signals.Sensors (Basel). 2023 Apr 14;23(8):3980. doi: 10.3390/s23083980. Sensors (Basel). 2023. PMID: 37112321 Free PMC article.
-
Computer-assisted lip diagnosis on Traditional Chinese Medicine using multi-class support vector machines.BMC Complement Altern Med. 2012 Aug 16;12:127. doi: 10.1186/1472-6882-12-127. BMC Complement Altern Med. 2012. PMID: 22898352 Free PMC article.
-
A PCA aided cross-covariance scheme for discriminative feature extraction from EEG signals.Comput Methods Programs Biomed. 2017 Jul;146:47-57. doi: 10.1016/j.cmpb.2017.05.009. Epub 2017 May 24. Comput Methods Programs Biomed. 2017. PMID: 28688489
-
Exploration of physiological sensors, features, and machine learning models for pain intensity estimation.PLoS One. 2021 Jul 9;16(7):e0254108. doi: 10.1371/journal.pone.0254108. eCollection 2021. PLoS One. 2021. PMID: 34242325 Free PMC article.
-
Classification of normal and diseased liver shapes based on Spherical Harmonics coefficients.J Med Syst. 2014 May;38(5):20. doi: 10.1007/s10916-014-0020-6. Epub 2014 Apr 24. J Med Syst. 2014. PMID: 24760223
Cited by
-
Multimodal physiological sensing for the assessment of acute pain.Front Pain Res (Lausanne). 2023 Jun 19;4:1150264. doi: 10.3389/fpain.2023.1150264. eCollection 2023. Front Pain Res (Lausanne). 2023. PMID: 37415829 Free PMC article.
-
Assessment of Outliers and Detection of Artifactual Network Segments Using Univariate and Multivariate Dispersion Entropy on Physiological Signals.Entropy (Basel). 2021 Feb 20;23(2):244. doi: 10.3390/e23020244. Entropy (Basel). 2021. PMID: 33672557 Free PMC article.
-
Continuous Pain Assessment Using Ensemble Feature Selection from Wearable Sensor Data.Proceedings (IEEE Int Conf Bioinformatics Biomed). 2019 Nov;2019:569-576. doi: 10.1109/bibm47256.2019.8983282. Epub 2020 Feb 6. Proceedings (IEEE Int Conf Bioinformatics Biomed). 2019. PMID: 32793402 Free PMC article.
-
Using the Electrocardiogram for Pain Classification under Emotional Contexts.Sensors (Basel). 2023 Jan 28;23(3):1443. doi: 10.3390/s23031443. Sensors (Basel). 2023. PMID: 36772482 Free PMC article.
-
Experimental Exploration of Multilevel Human Pain Assessment Using Blood Volume Pulse (BVP) Signals.Sensors (Basel). 2023 Apr 14;23(8):3980. doi: 10.3390/s23083980. Sensors (Basel). 2023. PMID: 37112321 Free PMC article.
References
-
- Bro R., Smilde A. K. (2014). Principal component analysis. Anal. Methods 6, 2812–2831. 10.1039/c3ay41907j - DOI
LinkOut - more resources
Full Text Sources
Other Literature Sources
Medical
Research Materials
Miscellaneous