

Can the agricultural AquaCrop model simulate water use and yield of a poplar short-rotation coppice?
- PMID: 28603557
- PMCID: PMC5439494
- DOI: 10.1111/gcbb.12422
Can the agricultural AquaCrop model simulate water use and yield of a poplar short-rotation coppice?
Abstract
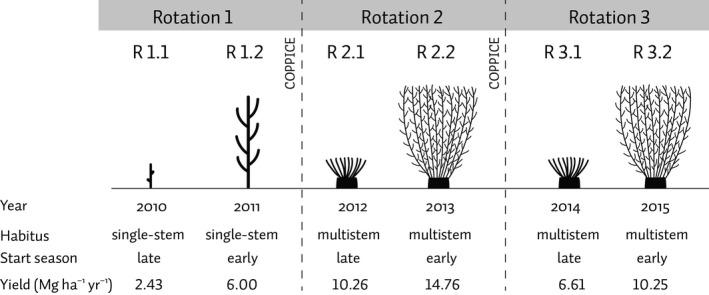
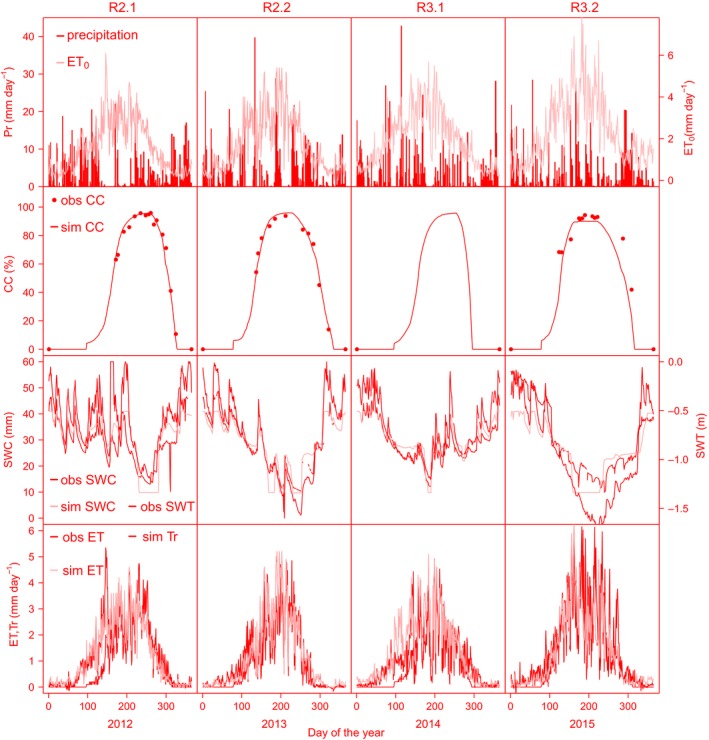
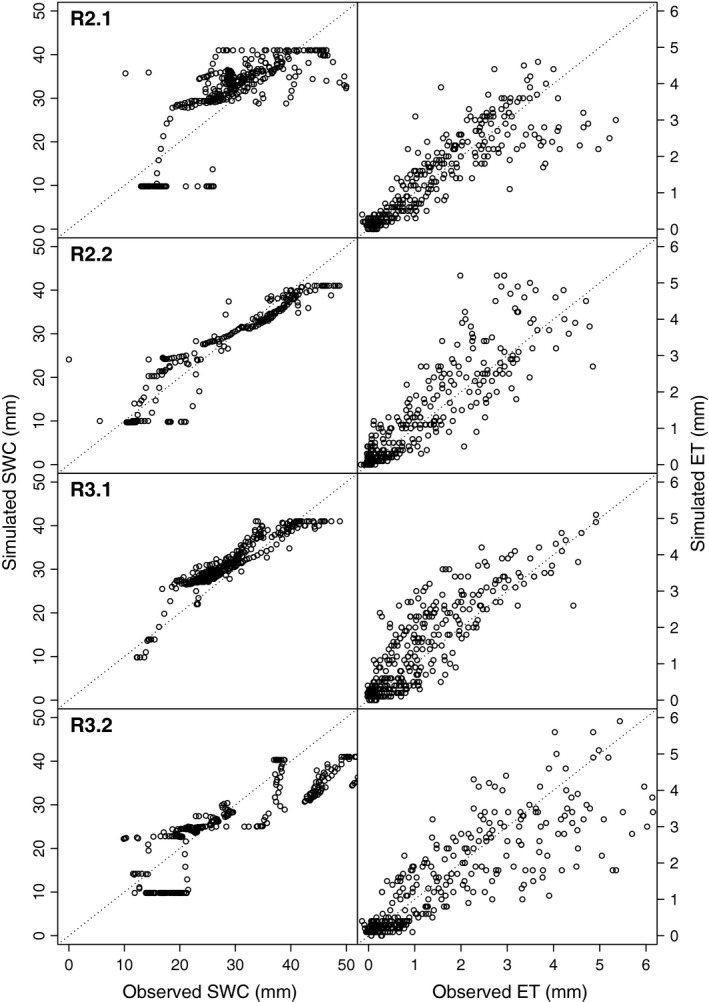
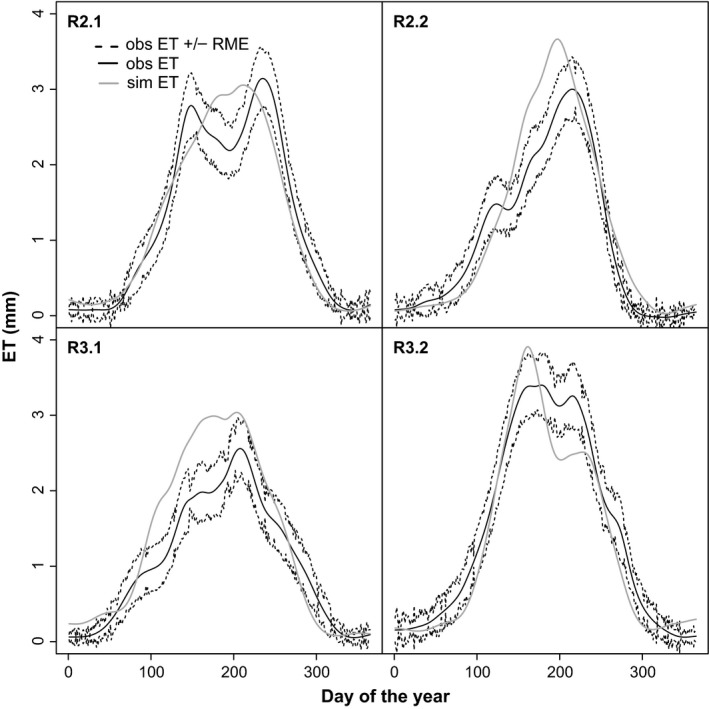
We calibrated and evaluated the agricultural model AquaCrop for the simulation of water use and yield of a short-rotation coppice (SRC) plantation with poplar (Populus) in East Flanders (Belgium) during the second and the third rotation (first 2 years only). Differences in crop development and growth during the course of the rotations were taken into account during the model calibration. Overall, the AquaCrop model showed good performance for the daily simulation of soil water content (R2 of 0.57-0.85), of green canopy cover (R2 > 0.87), of evapotranspiration (ET; R2 > 0.76), and of potential yield. The simulated, total yearly water use of the SRC ranged between 55% and 85% of the water use of a reference grass ecosystem calculated under the same environmental conditions. Crop transpiration was between 67% and 93% of total ET, with lower percentages in the first than in the second year of each rotation. The observed (dry mass) yield ranged from 6.61 to 14.76 Mg ha-1 yr-1. A yield gap of around 30% was observed between the second and the third rotation, as well as between simulated and observed yield during the third rotation. This could possibly be explained by the expansion of the understory (weed) layer; the relative cover of understory weeds was 22% in the third year of the third rotation. The agricultural AquaCrop model simulated total water use and potential yield of the operational SRC in a reliable way. As the plantation was extensively managed, potential effects of irrigation and/or fertilization on ET and on yield were not considered in this study.
Keywords: POPFULL; Populus; bioenergy; harvestable biomass prediction; soil water content; yield gap.
Figures
References
-
- Adler PR, Del Grosso SJ, Patron WJ (2007) Life‐cycle assessment of net greenhouse‐gas flux for bioenergy cropping systems. Ecological Applications, 17, 675–691. - PubMed
-
- AEBIOM (2012) European bioenergy outlook. Statistical Report, European Biomass Association, Brussels, 123 pp.
-
- Allen RG, Pereira LS, Raes D, Smith M (1998) Crop evapotranspiration: guidelines for computing crop water requirements. FAO Irrigation and drainage paper No. 56. FAO, Rome, Italy.
-
- Allen SJ, Hall RL, Rosier PTW (1999) Transpiration by two poplar varieties grown as coppice for biomass production. Tree Physiology, 19, 493–501. - PubMed
-
- Amichev BY, Johnston M, Van Rees KCJ (2010) Hybrid poplar growth in bioenergy production systems: biomass prediction with a simple process‐based model (3PG). Biomass and Bioenergy, 34, 687–702.
LinkOut - more resources
Full Text Sources
Other Literature Sources
Research Materials
Miscellaneous