. 2017 Jun 30;127(7):2647-2661.
doi: 10.1172/JCI91948. Epub 2017 Jun 12.

Targeting neuronal gap junctions in mouse retina offers neuroprotection in glaucoma

Targeting neuronal gap junctions in mouse retina offers neuroprotection in glaucoma

Abram Akopian et al. J Clin Invest. .

Abstract

The progressive death of retinal ganglion cells and resulting visual deficits are hallmarks of glaucoma, but the underlying mechanisms remain unclear. In many neurodegenerative diseases, cell death induced by primary insult is followed by a wave of secondary loss. Gap junctions (GJs), intercellular channels composed of subunit connexins, can play a major role in secondary cell death by forming conduits through which toxic molecules from dying cells pass to and injure coupled neighbors. Here we have shown that pharmacological blockade of GJs or genetic ablation of connexin 36 (Cx36) subunits, which are highly expressed by retinal neurons, markedly reduced loss of neurons and optic nerve axons in a mouse model of glaucoma. Further, functional parameters that are negatively affected in glaucoma, including the electroretinogram, visual evoked potential, visual spatial acuity, and contrast sensitivity, were maintained at control levels when Cx36 was ablated. Neuronal GJs may thus represent potential therapeutic targets to prevent the progressive neurodegeneration and visual impairment associated with glaucoma.


Conflict of interest statement

Conflict of interest: The authors have declared that no conflict of interest exists.

Figures

Figure 1
Figure 1. Blockade of GJs suppresses gross retinal injury in glaucomatous eyes.
(A) Photomicrograph shows accumulation of microbeads in the iridocorneal angle and Schlemm’s canal (SC) 8 weeks after intracameral injection. Scale bar: 100 μm. (B) C57BL/6 mouse data showing sustained IOP elevation 8 weeks after initial microbead injection followed by a second injection at week 4 (arrow) in comparison with control eyes (sham injection of PBS). MFA application did not affect the elevated IOP observed in microbead-injected eyes (n = 10 eyes per group). (C) Elevation of IOP in different mouse strains following microbead injections (n = 10 eyes per group). Sham injections produced no elevation of IOP. (D) Thickness of individual retinal layers in glaucomatous retinas with or without MFA treatment (n = 6 retinas per group). MFA application prevents thinning of layers in glaucomatous eyes. (E) Thickness of retinal layers in CxWT mice with and without microbead injections (n = 6 retinas per group). (F) Preservation of retinal layer thickness in glaucomatous retinas of Cx36–/– or Cx36–/– Cx45–/– mice (n = 6 retinas per group). Data are presented as mean ± SEM. *P < 0.05, Student’s t test for B, C, and E and 1-way ANOVA followed by Tukey’s multiple comparisons test for D and F.
Figure 2
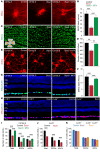
Figure 2. Reactive gliosis in retinas of microbead-injected mice is significantly reduced by GJ blockade/ablation.
(A) Confocal images of retinal layers stained for GFAP, SMI32, and DAPI in control and glaucomatous retinas. Scale bar: 50 μm in all panels. Z-stack: 7 sections, 3-μm steps. (B) GFAP expression in the retinal layers of CxWT and Cx36–/– mouse retinas under different conditions (n = 6 retinas per group). (C) GFAP labeling in retinal sections from control and microbead-injected CxWT (n = 5 retinas), Cx36–/– (n = 5 retinas), and Cx36–/– Cx45–/– mice (n = 3 retinas). GFAP expression is presented as percentage of immunolabeling per area. Data are presented as mean ± SEM. **P < 0.01, ***P < 0.001, 1-way ANOVA followed by Tukey’s multiple comparisons test.
Figure 3
Figure 3. Blockade or ablation of GJs protects RGCs and their axons in experimental glaucoma.
(A) Immunofluorescence images of SMI32-positive axons in whole-mount retinas of C57BL/6 mice under control conditions and 8 weeks after microbead injections with or without MFA treatment (n = 6 retinas per group). Scale bar: 200 μm for all panels. (B) SMI32-labeled axons as percentage of coverage per 300 × 300 μm retinal area from each quadrant, averaged across retinas. (C) Confocal images of whole-mount retinas with BRN3A-labeled RGCs under conditions represented in A. All images and measures were taken from the midperiphery of the retina, 1.5–2.0 mm from the optic disk (inset). Scale bar: 100 μm for all panels. (D) Quantification of RGCs performed for 600 × 600 μm area in 4 quadrants from the midperipheral retina and averaged for retinas per each control and experimental condition (n = 3 retinas per group). (E) Images of SMI32-positive α-RGC somata and dendrites under conditions described in A (n = 6 retinas per group). Scale bar: 25 μm for all panels. Z-stack: 15 sections, 2-μm steps. (F) Quantification of SMI32-positive α-RGC somata under conditions represented in E. (G) C57BL/6 retinal sections processed for BRN3A immunoreactivity and counterstained with DAPI in control and MFA-treated or untreated glaucomatous eyes. Scale bar: 50 μm for all panels. Z-stack: 5 sections, 2-μm steps. (H) Images of retinal sections from control and microbead-injected eyes of CxWT and Cx36–/– mice. Scale bar: 50 μm for all panels. (I) Number of DAPI-stained (total) cells, BRN3A-positive RGCs, and dACs in the GCL of retinas from C57BL/6 mice under conditions described in E (n = 14 retinas for all counts). (J) Number of total cells, RGCs, and dACs in the GCL of CxWT in control eyes and 8 weeks after microbead injection (n = 10 retinas per group). Z-stack: 5 sections, 2-μm steps. (K) Number of total cells, RGCs, and dACs in the GCL of Cx36–/– (n = 12 retinas) and Cx36–/– Cx45–/– (n = 5 retinas) mice in controls and 8 weeks after microbead injection. All data are presented as mean ± SEM. ***P < 0.001, **P > 0.01, Student’s t test for J and 1-way ANOVA followed by Tukey’s multiple comparisons test for B, D, F, I, and K.
Figure 4
Figure 4. GJ blockade or ablation protects ACs in glaucomatous eyes.
(AC) Representative images of vertical sections of CxWT mouse retinas immunostained for GABA and counterstained for DAPI under control conditions and 8 weeks after microbead injections with or without MFA treatment. Scale bar: 50 μm for all panels. Z-stack: 5 sections, 2-μm steps. (D and E) Representative images of vertical sections of Cx36–/– mouse retinas immunostained for GABA and counterstained for DAPI under control conditions and 8 weeks after microbead injections. Z-stack: 5 sections, 2-μm steps. (FH) Representative images of vertical sections of CxWT mouse retinas immunostained for CR and counterstained for DAPI under control and glaucomatous conditions with or without MFA treatment. Scale bar: 50 μm for all panels. Z-stack: 5 sections, 2-μm steps. (I and J) Representative images of vertical sections of Cx36–/– mouse retinas immunostained for CR and counterstained for DAPI under control conditions and 8 weeks after microbead injections with or without MFA treatment. Z-stack: 5 sections, 2-μm steps. (K) Quantification of the number of GABA-positive ACs in the INL and GCL of retinas from CxWT mice under control and experimental conditions as presented in AC (n = 12 retinas per group). (L) Quantification of the number of GABA-positive ACs in the INL and GCL of retinas from control and microbead-injected Cx36–/– (n = 10 retinas per group) and Cx36–/– Cx45–/– mice (n = 8 retinas). (M) Quantification of the number of CR-positive cells in the INL and GCL of CxWT mouse retinas under conditions detailed in FH (n = 10 retinas per group). (N) Quantification of the number of CR-positive cells in the INL and GCL of retinas from control and microbead-injected Cx36–/– (n = 10 retinas) and Cx36–/– Cx45–/– mice (n = 8 retinas). Results are presented as mean ± SEM. *P < 0.05, **P < 0.01, ***P < 0.001, 1-way ANOVA followed by Tukey’s multiple comparisons test.
Figure 5
Figure 5. Expression of Cx36 is upregulated in experimental glaucoma.
(AC) Representative images of vertical sections of C57BL/6 mouse retinas immunostained for Cx36 and counterstained with DAPI under control condition and 8 weeks after microbead injection with or without MFA treatment. Scale bar: 50 μm for all panels. (D and E) Quantification of the Cx36 immunolabeled plaques revealed a significant upregulation in the IPL of the glaucomatous retina specifically in the sublamina-a. No significant change in Cx36 expression or distribution was observed in glaucomatous retinas of MFA-treated mice. Plaque counts were performed per 16 × 300 μm area for sublamina-a and 33 × 300 μm area for sublamina-b in at least 8 sections and averaged across retinas (5 retinas per group). (F and G) Representative images of vertical retinal sections immunostained for Cx45 from control and glaucomatous mice. Scale bar: 50 μm in both panels. (H) Quantification of the number of Cx45 immunoreactive plaques in the IPL of control and glaucomatous retinas (n = 4 retinas per group). Plaques were counted per 50 × 300 μm area covering both sublamina (a+b) of the IPL. Z-stack: 5 sections, 0.7-μm steps for all images. All data are presented as mean ± SEM. *P < 0.05, ***P < 0.001, Student’s t test.
Figure 6
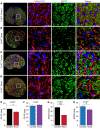
Figure 6. Ablation of neuronal Cx36 protects the optic nerve in experimental glaucoma.
(A) Representative cross-sectional images of the glial lamina region of the optic nerve from control CxWT animals immunostained for GFAP, SMI32, and DAPI. Magnified images of the area outlined in the left panel show the immunolabeling pattern for GFAP and SMI32. Scale bars: 100 μm for all panels in the left column and 25 μm for panels in all other columns. (B) Representative cross-sectional images of the glial lamina region of the optic nerve from CxWT animals 8 weeks after initial microbead injection. Conventions are the same as in A. (C) Representative cross-sectional images of the glial lamina region of the optic nerve from Cx36–/– mice under control conditions. Conventions are the same as in A. (D) Representative cross-sectional images of the glial lamina region of the optic nerve from Cx36–/– animals 8 weeks after initial microbead injection. Conventions are the same as in A. (E) Quantification of GFAP labeling in the cross sections of optic nerves of CxWT mice under control and glaucomatous conditions (n = 5 optic nerves per group). (F) Quantification of GFAP labeling in the cross sections of optic nerves of Cx36–/– mice under control and glaucomatous conditions (n = 5 optic nerves per group). (G) Quantification of SMI32 labeling in the cross sections of optic nerves of CxWT mice under control and glaucomatous conditions (n = 5 optic nerves per group). (H) Quantification of SMI32 labeling in the cross sections of Cx36–/– mice under control and glaucomatous conditions (n = 5 optic nerves per group). Z-stack: 5 sections, 0.7-μm steps for all images. Data are presented as mean ± SEM. *P < 0.05, ***P < 0.001, Student’s t test.
Figure 7
Figure 7. Blockade of neuronal gap junctions preserves retina and optic nerve function in glaucoma.
(A) pSTR of scotopic ERG from C57BL/6 mice under control conditions and 8 weeks after initial microbead injection with and without MFA. Histogram of the pSTR peak amplitude under different conditions (n = 17 eyes per condition). (B) pSTR from CxWT mice. Histogram of pSTR peak amplitude changes under different conditions (n = 9 eyes per condition). (C) pSTR from Cx36-/- mice. Histogram of pSTR peak amplitude changes under different conditions (n = 15 eyes per condition). Light intensity = –4.3 log scot. cd·s/m2 for panels A–C. (D) OPs of the scotopic ERG from C57BL/6 mice. Histogram of OP summed amplitude under different conditions (n = 14 eyes per condition). (E) OPs of CxWT mice. Histogram of OP summed amplitude from control (n = 10 eyes) and glaucomatous mice (n = 8 eyes). (F) OPs recorded in Cx36-/- mice. Histogram of OP summed amplitude from control (n = 15 eyes) and glaucomatous (n = 14 eyes) mice. Light intensity = –0.4 log scot. cd·s/m2 for panels D–F. (G) Photopic VEPs from control and glaucomatous C57BL/6 mice. Histogram of VEP peak amplitude in control (n = 9 mice) and glaucomatous mice (n = 7 mice). (H) VEPs from CxWT mice. Histogram of VEP peak amplitude under different conditions (n = 5 mice per condition). (I) VEPs from Cx36-/- mice. Histogram of VEP peak amplitude under different conditions (n = 5 mice per condition). Light intensity = 1.85 log cd·s/m2 for panels G–I. Data presented as mean ± SEM. *P < 0.05, **P < 0.01, ***P < 0.001, Student’s t-test for B, C, E–I and 1-way ANOVA followed by Tukey’s multiple comparison test for A and D.
Figure 8
Figure 8. Ablation of GJs prevents a decline in behavioral measures of spatial vision in glaucomatous eyes.
(AC) Performance of CxWT mice (n = 5 animals per condition), and Cx36–/– mice (n = 4 animals per condition) under control and glaucomatous (8 weeks after initial bead injection) conditions, on a discrimination task between sinusoidal grating and gray visual stimuli. Grating frequencies (fs) were 0.1, 0.3, and 0.5 cpd, presented at contrasts ranging from 20% to 100%. (D) Changes in spatial acuity, based on a threshold performance of 75%, calculated from data in A obtained at 100% contrast. Induction of glaucoma produced a decline in discrimination performance of CxWT mice for all gratings, indicating reduced spatial acuity. In contrast, there was no change in the discrimination performance of microbead-injected Cx36–/– mice, indicating a preservation of spatial acuity. All data are presented as mean ± SEM. **P < 0.01, ***P < 0.001, 1-way ANOVA followed by Tukey’s multiple comparisons test.

References

    1. Quigley HA. Neuronal death in glaucoma. Prog Retin Eye Res. 1999;18(1):39–57. doi: 10.1016/S1350-9462(98)00014-7. - DOI - PubMed
    1. Schwartz M. Neurodegeneration and neuroprotection in glaucoma: development of a therapeutic neuroprotective vaccine: the Friedenwald lecture. Invest Ophthalmol Vis Sci. 2003;44(4):1407–1411. doi: 10.1167/iovs.02-0594. - DOI - PubMed
    1. Chang EE, Goldberg JL. Glaucoma 2.0: neuroprotection, neuroregeneration, neuroenhancement. Ophthalmology. 2012;119(5):979–986. doi: 10.1016/j.ophtha.2011.11.003. - DOI - PMC - PubMed
    1. Tian K, Shibata-Germanos S, Pahlitzsch M, Cordeiro MF. Current perspective of neuroprotection and glaucoma. Clin Ophthalmol. 2015;9:2109–2118. - PMC - PubMed
    1. Shih GC, Calkins DJ. Secondary neuroprotective effects of hypotensive drugs and potential mechanisms of action. Expert Rev Ophthalmol. 2012;7(2):161–175. doi: 10.1586/eop.12.13. - DOI - PMC - PubMed