. 2017 Jun 12;22(6):972.
doi: 10.3390/molecules22060972.

Baccharis trimera (Less.) DC Exhibits an Anti-Adipogenic Effect by Inhibiting the Expression of Proteins Involved in Adipocyte Differentiation

Affiliations

Baccharis trimera (Less.) DC Exhibits an Anti-Adipogenic Effect by Inhibiting the Expression of Proteins Involved in Adipocyte Differentiation

Daniele de Souza Marinho do Nascimento et al. Molecules. .

Abstract

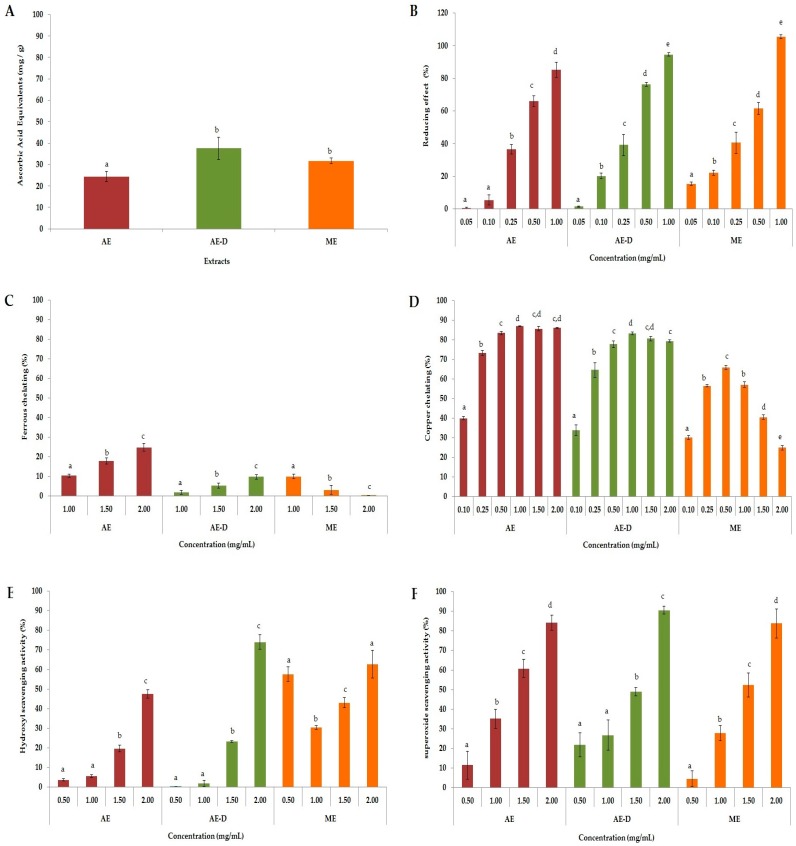
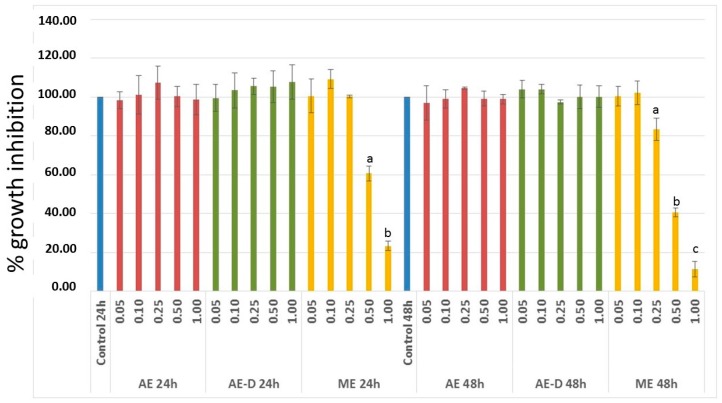
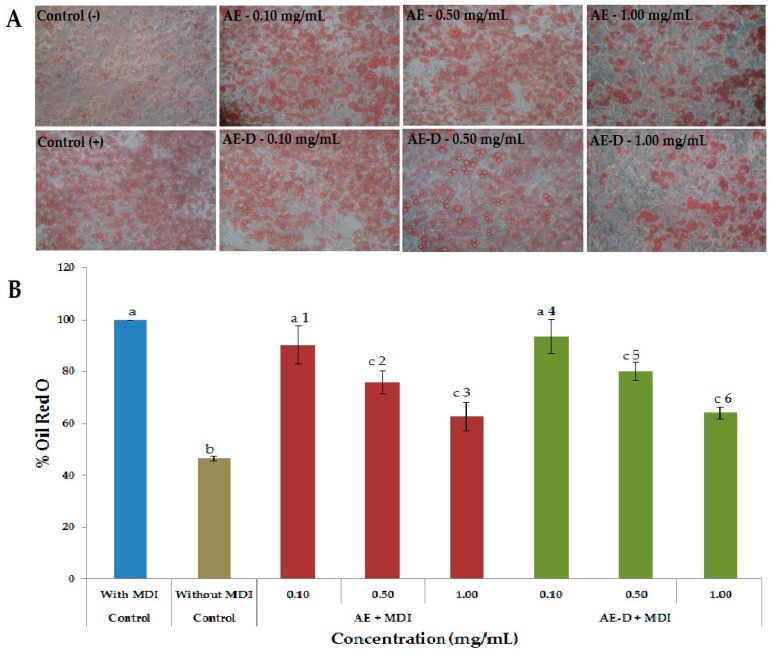
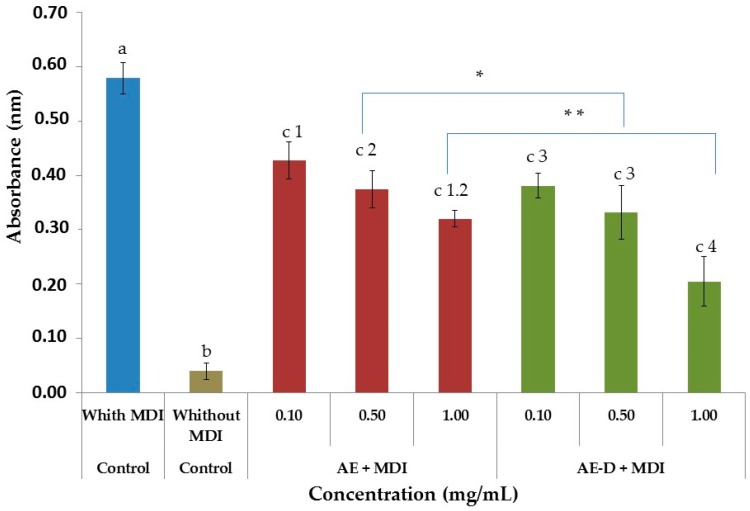
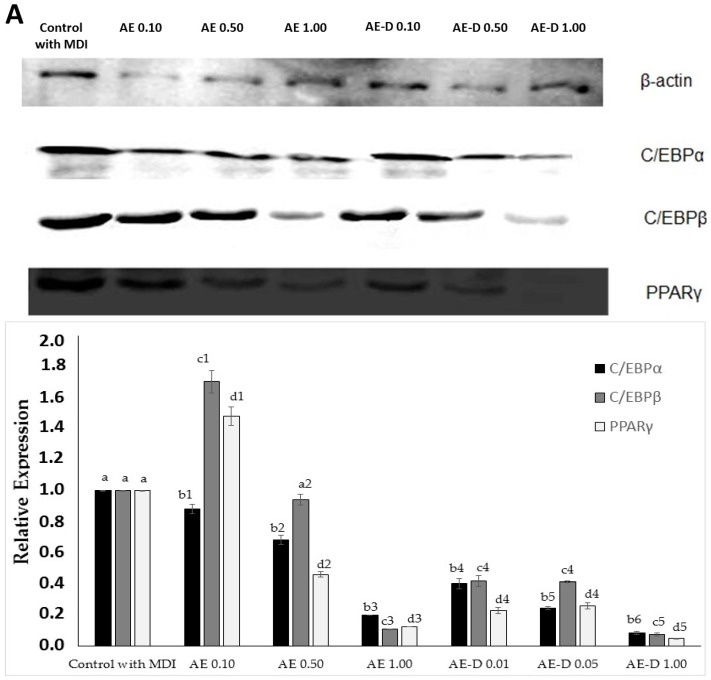
Baccharis trimera (Less.) DC (gorse) is a plant popularly used for the treatment of obesity. In this study, we prepared three B. trimera extracts aqueous extract (AE), decoction (AE-D), and methanol extract (ME) and investigated their antioxidant effects in six different tests and their anti-adipogenic effect in 3T3-L1 cells. The extracts showed a dose-dependent antioxidant activity in all tests. AE was the most potent antioxidant in copper and ferric ion chelation assays, whereas AE-D was the most potent in superoxide and hydroxyl radical scavenging assays, reducing power assay, and total antioxidant capacity analysis. Only ME showed a cytotoxic effect against 3T3-L1 cells. Lipid accumulation decreased in 3T3-L1 adipocytes in the presence of AE and AE-D extracts (0.5 to 1.0 mg/mL). In addition, the extracts dramatically attenuated the levels of adipogenic transcriptional factors, including CCAAT enhancer-binding protein α (C/EBPα), CCAAT enhancer-binding protein β (C/EBPβ), and gamma receptors by peroxisome proliferators (PPARγ), during adipogenesis. AE-D (1.0 mg/mL) caused an approximately 90% reduction in the levels of these molecules. We propose that B. trimera has an anti-adipogenic effect and could be used in the development of functional foods.

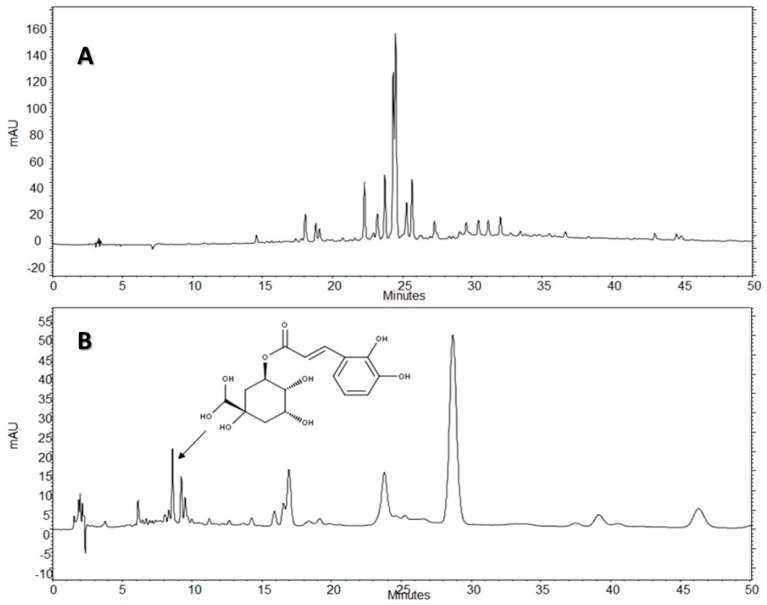
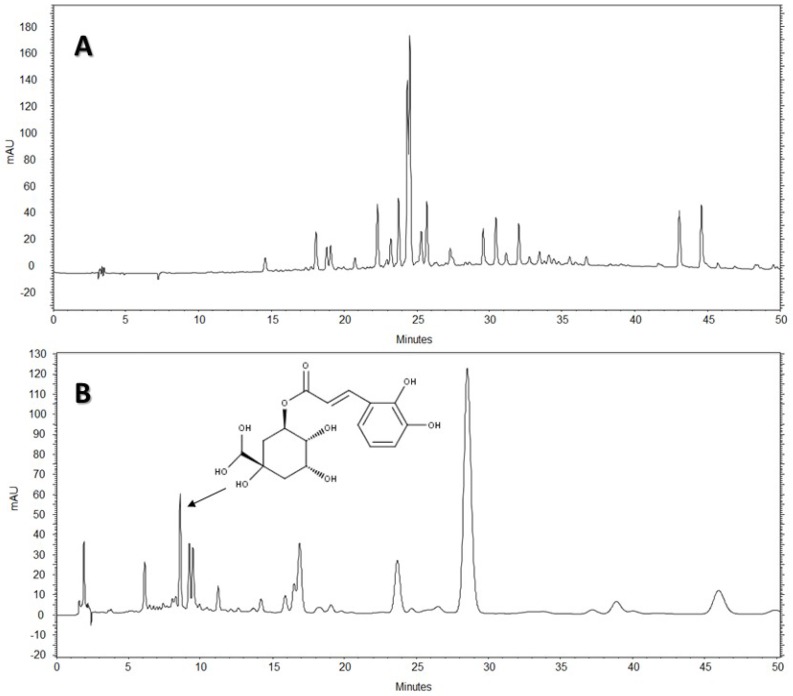
Keywords: adipogenesis; antioxidant; chlorogenic acid.


Conflict of interest statement

The authors declare no conflict of interest.

Figures

Figure 1
Figure 1
Antioxidant activities of AE (aqueous extract), AE-D (aqueous extract from decoction) and ME (methanol extract): (A) total antioxidant capacity; (B) reducing power; (C) ferrous chelating; (D) copper chelating; (E) hydroxyl radical scavenging; and (F) superoxide radical scavenging. Letters a,b,c,d represent the presence of significant difference between different concentration of the same extract as determined using one-way analyses of variance (ANOVA) followed by the Student’s t-test (p < 0.05).
Figure 2
Figure 2
The effect of aqueous extract (AE), decoction extract (AE-D), and methanol extract (ME) on 3T3-L1 cell proliferation. 3T3-L1 cell proliferation was carried out in the presence or absence of extracts (0, 0.05, 0.1, 0.25, 0.5, and 1 mg/mL). The rate of cell proliferation inhibition was determined using BrdU. The results are expressed as mean ± SD of four determinations. Letters a,b,c, indicate significantly differences between different concentrations and the control according to one way analysis of variance (ANOVA) followed by the Student’s t-test (p < 0.05).
Figure 3
Figure 3
Adipocytes stained with the dye Oil Red O after 15 days after the onset of differentiation. (A) Intracellular lipid accumulation in 3T3-L1 cells treated with adipogenic medium (MDI) and different concentrations of AE or AE-D. After 15 days of treatment the cells were stained with oil Red O, observed with a microscope and photographed (20× magnification). (B) Baccharis trimera extracts inhibited the differentiation of 3T3-L1 preadipocytes into mature adipocytes. Oil Red O dye was used to stain the adipocytes 15 days after treatment with the extracts. Stained oil droplets were dissolved with isopropanol and evaluated by spectrophotometric analysis at 510 nm. The optical density in cells treated only with MDI was taken as 100% of relative lipid content. Values are expressed as mean ± standard deviation (n = 3). Letters a,b,c indicate significant differences between different concentrations with the control. Numbers 1,2,3,4,5,6 indicate significantly differences between different concentrations of same extract according to one-way analysis of variance (ANOVA) followed by the Student’s t-test (p < 0.05).
Figure 4
Figure 4
Induction of hydrolysis of intracellular lipids by Baccharis trimera aqueous extract (AE) and aqueous extract with decoction (AE-D). The induction of intracellular lipids hydrolysis was determined by quantification of glycerol released into the culture medium. An aliquot of the culture medium after the last change of medium was used to quantify free glycerol. Values are expressed as mean ± standard deviation (n = 3). Letters a,b,c indicate significant differences between different concentrations with the control. Numbers 1,2,3,4 indicate significant differences between different concentrations of same extract. * and ** indicate significant differences between AE 0.5 mg/mL and AE-D 0.5 mg/mL and between AE 1.0 mg/mL and AE-D 1.0 mg/mL according to one-way analysis of variance (ANOVA) followed by the Student’s t-test (p < 0.05).
Figure 5
Figure 5
Effects of Baccharis trimera aqueous extract (AE) and AE with decoction (AE-D), both with adipogenic growth medium (MDI), on the expression of adipocyte markers. (A) Equal amounts of protein (50 µg) of cell lysate were analyzed by Western blotting to detect β-actin, CCAAT enhancer-binding protein α (C/EBPα), CCAAT enhancer-binding protein β (C/EBPβ), and gamma receptors by peroxisome proliferators (PPARγ) levels; (B) The graph of the protein relative expressions was obtained as described in materials and methods. Control, Control with MDI. Values are expressed as mean ± standard deviation (n = 3). Letters a,b,c,d indicate significant differences between different concentrations and the control. Numbers 1,2,3,4,5 indicate significant differences between each protein analyzed in the different concentrations between each extract as calculated by one-way analysis of variance (ANOVA) followed by the Student’s t-test (p < 0.05).
Figure 6
Figure 6
Chromatogram from a high performance liquid chromatography with diode array detector (HPLC-DAD) trial of the aqueous extract with decoction (AE-D) of Baccharis trimera: (A) Method 1; and (B) Method 2. SP: column C18 Phenomenex-Luna® (250 × 4.6 mm, 5 µm); Mobile phase: acetonitrile gradient: acetic acid 0.3%; Detection: 340 nm. Chlorogenic acid was identified (arrow).
Figure 7
Figure 7
Results from high-performance liquid chromatography with diode array detector (HPLC-DAD) of the aqueous extract (AE) of Baccharis trimera: (A) Method 1; and (B) Method 2. SP: column C18 Phenomenex-Luna® (250 × 4.6 mm, 5 µm); Mobile phase: acetonitrile gradient: acetic acid 0.3%; Detection: 340 nm. Chlorogenic acid was identified (arrow).

References

    1. WHO Obesity and Overweight. [(accessed on 1 August 2016)]; Available online: http://www.who.int/mediacentre/factsheets/fs311/en/
    1. Ross M.G., Desai M. Developmental programming of offspring obesity, adipogenesis, and appetite. Clin. Obstet. Gynecol. 2013;53:529–536. doi: 10.1097/GRF.0b013e318299c39d. - DOI - PMC - PubMed
    1. Fève B. Adipogenesis: Cellular and molecular aspects. Best Pract. Res. Clin. Endocrinol. Metab. 2005;19:483–499. doi: 10.1016/j.beem.2005.07.007. - DOI - PubMed
    1. Siersbaek R., Nielsen R., Mandrup S. Transcriptional networks and chromatin remodeling controlling adipogenesis. Trends Endocrinol. Metab. 2012;23:56–64. doi: 10.1016/j.tem.2011.10.001. - DOI - PubMed
    1. Siersbaek R., Mandrup S. Transcriptional networks controlling adipocyte differentiation. Cold Spring Harb. Symp. Quant Biol. 2011;76:247–255. doi: 10.1101/sqb.2011.76.010512. - DOI - PubMed

LinkOut - more resources