. 2017 Jun 9;49(6):e344.
doi: 10.1038/emm.2017.74.

Upregulation of mitochondrial NAD+ levels impairs the clonogenicity of SSEA1+ glioblastoma tumor-initiating cells

Affiliations

Upregulation of mitochondrial NAD+ levels impairs the clonogenicity of SSEA1+ glioblastoma tumor-initiating cells

Myung Jin Son et al. Exp Mol Med. .

Abstract

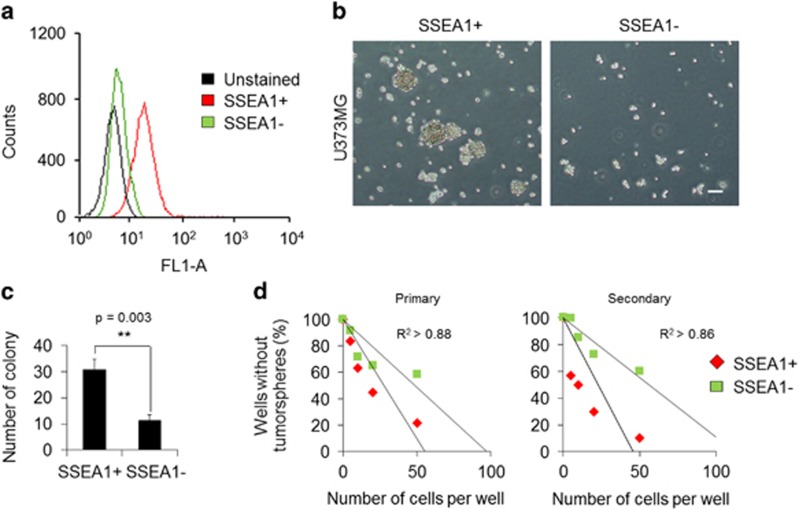
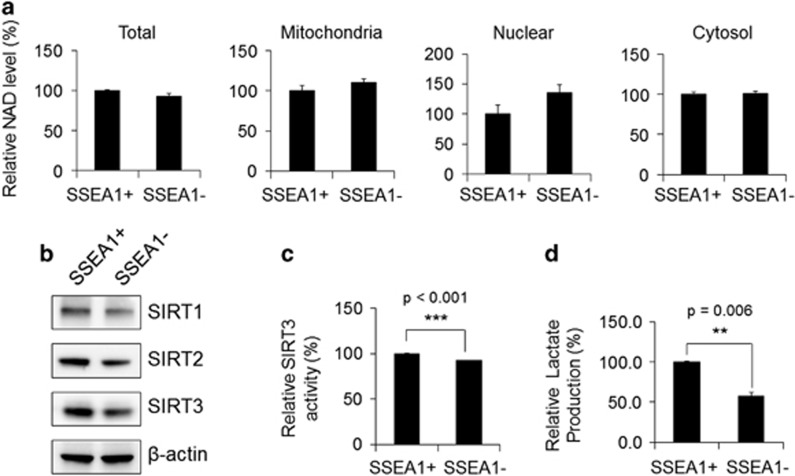
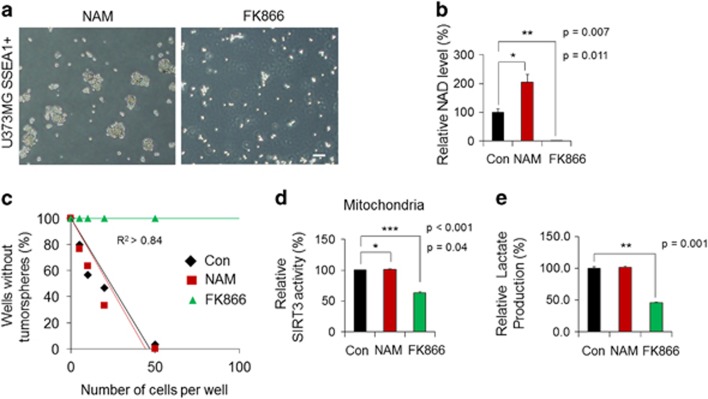
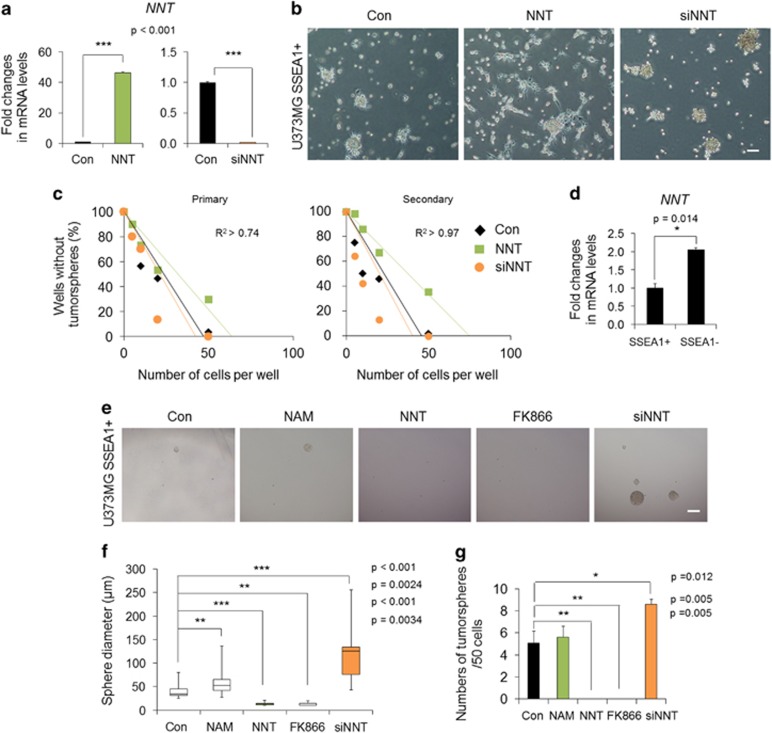
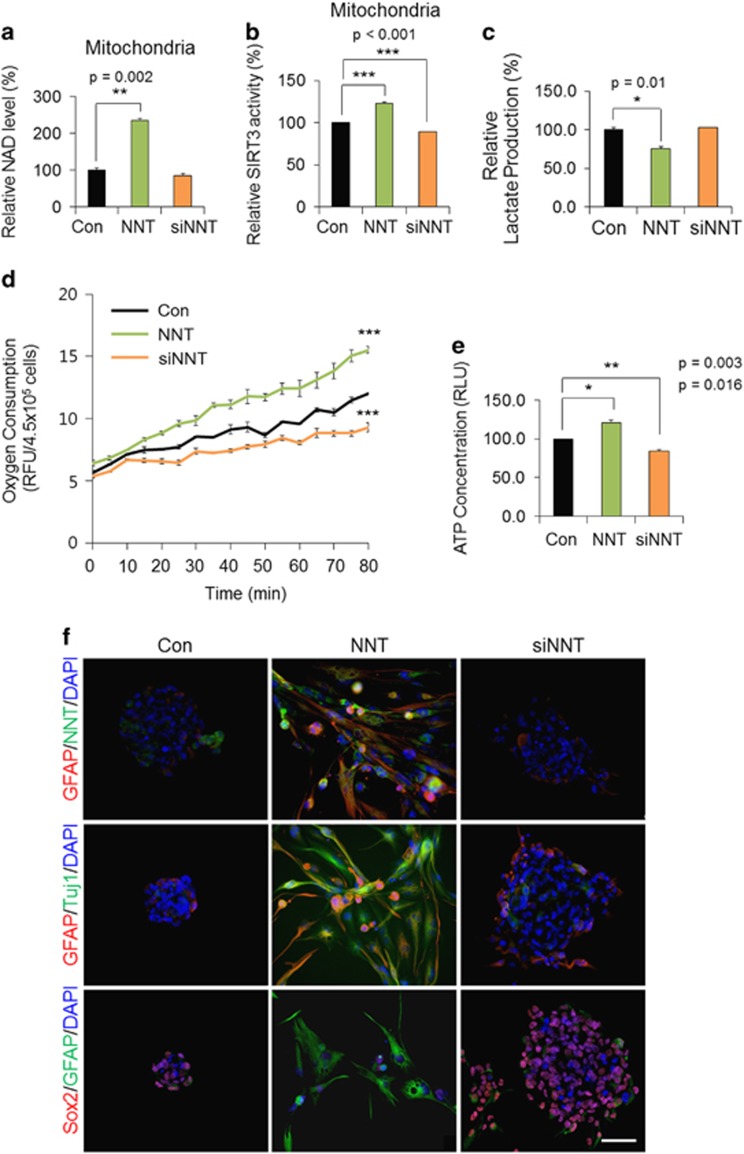
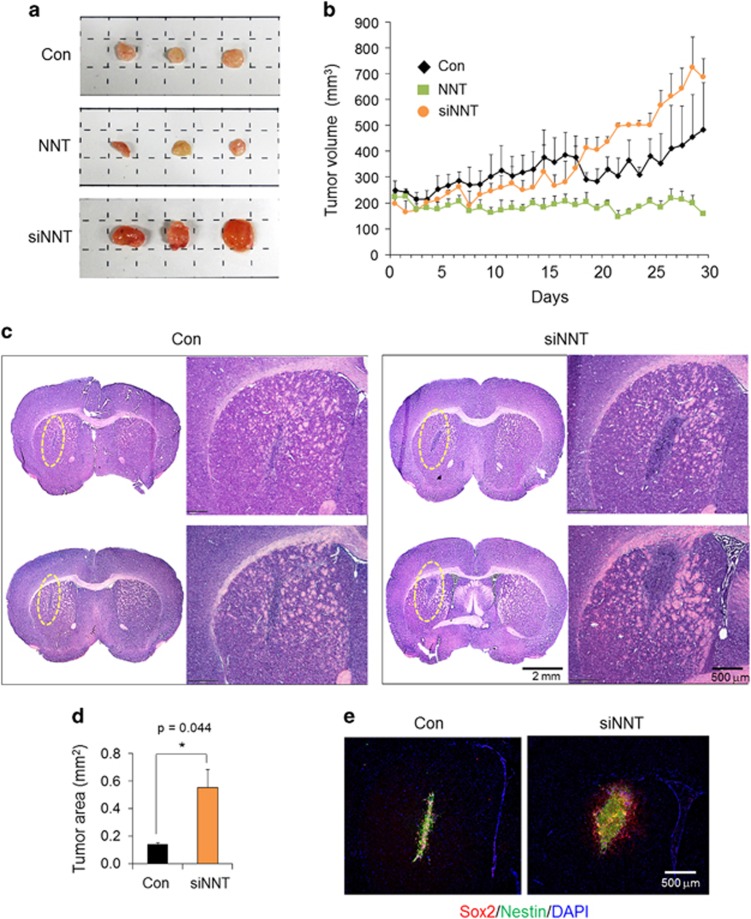
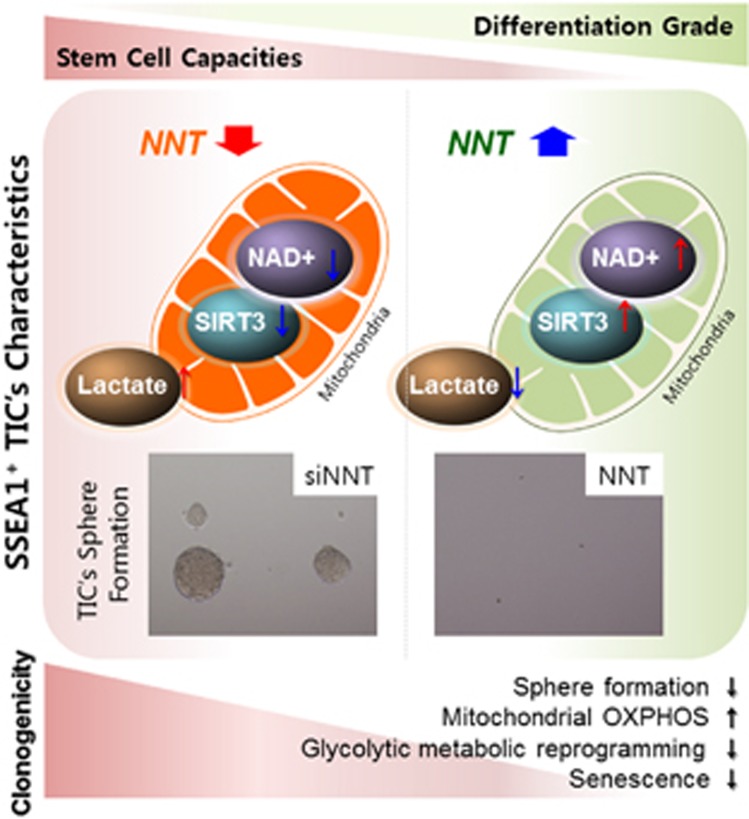
Emerging evidence has emphasized the importance of cancer therapies targeting an abnormal metabolic state of tumor-initiating cells (TICs) in which they retain stem cell-like phenotypes and nicotinamide adenine dinucleotide (NAD+) metabolism. However, the functional role of NAD+ metabolism in regulating the characteristics of TICs is not known. In this study, we provide evidence that the mitochondrial NAD+ levels affect the characteristics of glioma-driven SSEA1+ TICs, including clonogenic growth potential. An increase in the mitochondrial NAD+ levels by the overexpression of the mitochondrial enzyme nicotinamide nucleotide transhydrogenase (NNT) significantly suppressed the sphere-forming ability and induced differentiation of TICs, suggesting a loss of the characteristics of TICs. In addition, increased SIRT3 activity and reduced lactate production, which are mainly observed in healthy and young cells, appeared following NNT-overexpressed TICs. Moreover, in vivo tumorigenic potential was substantially abolished by NNT overexpression. Conversely, the short interfering RNA-mediated knockdown of NNT facilitated the maintenance of TIC characteristics, as evidenced by the increased numbers of large tumor spheres and in vivo tumorigenic potential. Our results demonstrated that targeting the maintenance of healthy mitochondria with increased mitochondrial NAD+ levels and SIRT3 activity could be a promising strategy for abolishing the development of TICs as a new therapeutic approach to treating aging-associated tumors.


Conflict of interest statement

The authors declare no conflict of interest.

Figures

Figure 1
Figure 1
The SSEA1+ population from U373MG glioma cells was more clonogenic than the SSEA1 population. (a) The purity of the SSEA1+ population sorted by immunomagnetic selection was confirmed by flow cytometer. (b) Representative cell morphology of each population three days after cell sorting is shown. (c) Total numbers of colonies were determined in SSEA1+ versus SSEA1 populations using the soft-agar colony-forming assay. (d) Numbers of wells without tumor spheres were quantified in SSEA1+ versus SSEA1 populations using the limiting dilution sphere-forming assay (primary). Serial secondary sphere forming assay was performed (secondary). **P<0.01 (Student’s t-test). Scale bar=50 μm.
Figure 2
Figure 2
Nicotinamide adenine dinucleotide (NAD+) levels, SIRT3 expression and activity, and lactate production in SSEA1+ and SSEA1 populations from U373MG glioma cells are shown. (a) SSEA1+ and SSEA1 populations were sorted from U373MG glioma cells (total, unfractionated) and then fractionated into mitochondrial, nuclear and cytosolic fractions. The NAD+ levels in each lysate were quantified. (b) Western blot analysis of SIRT1, 2 and 3 in total protein of each subpopulations. β-Actin was used as an internal control. (c) SIRT3 enzyme activity and (d) lactate contents in each population were determined. **P<0.01; ***P<0.001 (Student’s t-test).
Figure 3
Figure 3
Adequate intracellular nicotinamide adenine dinucleotide (NAD+) levels are required to maintain the identity of tumor-initiating cells. (a) U373MG SSEA1+ cells were sorted and then incubated with 1 mM of nicotinamide (NAM; NAD+ precursor) or 0.1 nM of FK866 (inhibitor of NAD+ biosynthesis). Representative cell images at 48 h after treatment are shown. (b) The NAD+ levels in each lysate were quantified. (c) Clonogenicity was determined in each condition using limiting dilution analysis. (d) SIRT3 enzyme activity in the mitochondrial fraction and (e) lactate production in each condition were determined. *P<0.05; **P<0.01; ***P<0.001 (Student’s t-test). Scale bar=50 μm.
Figure 4
Figure 4
The effect of nicotinamide nucleotide transhydrogenase (NNT) overexpression or knockdown on clonogenicity of SSEA1+ tumor-initiating cells (TICs) is shown. (a) U373MG SSEA1+ cells were sorted and then transduced with retroviral NNT or transfected with short interfering RNA for NNT (siNNT). Overexpression or knockdown of NNT was confirmed by real-time PCR analysis. (b) Representative morphology of each population at 3 days after treatment is shown. Scale bar=50 μm. (c) Clonogenicity of each condition was compared using primary and secondary limiting dilution analysis. (d) Basal expression of NNT in each subpopulation was examined by real-time PCR analysis. (e) Representative sphere images, (f) the diameter of spheres, (g) sphere numbers per well (initial seeding number=50 cells) in each condition were quantitated at the end point of the limiting dilution analysis (4-week incubation). Box plots indicate the median and 25th and 75th percentiles. Whiskers indicate the minimum and maximum values. Nicotinamide (NAM, 1 mM) and FK866 (0.1 nM) were used as the comparison groups. *P<0.05; **P<0.01; ***P<0.001 (Student’s t-test). Scale bar=200 μm.
Figure 5
Figure 5
The effect of nicotinamide nucleotide transhydrogenase (NNT) overexpression or knockdown in SSEA1+ tumor-initiating cells is shown. Mitochondria were fractionated from retroviral NNT-overexpressed or siNNT-transfected U373MG SSEA1+ cells, and (a) nicotinamide adenine dinucleotide (NAD+) levels and (b) SIRT3 enzyme activity were determined at 3 days after treatment. (c) Lactate production was examined in the total lysate in each condition. (d) Each condition at 3 days after culture, the oxygen consumption was measured in over 80 min using an oxygen probe and (e) the ATP concentration in cells of each group was determined. (f) Immunocytochemistry of each condition was fixed at 7 days after treatment. Antibodies used in each condition are shown on the left. 4,6-Diamidino-2-phenylindole (DAPI) staining (blue) was used to identify nuclei.
Figure 6
Figure 6
The tumorigenic potential of nicotinamide nucleotide transhydrogenase (NNT) overexpression or knockdown in SSEA1+ tumor-initiating cells is shown. (a) Control (Con), retroviral NNT-transduced or short interfering RNA for NNT (siNNT)-transfected U373MG SSEA1+ cells were injected subcutaneously and tumors were excised at 6 weeks after injection. Representative images of excised tumor mass in each group were shown. (b) Tumor volume was measured daily after tumor mass detected. (c) Intracranial orthotopic injection of control or siNNT-transfected U373MG SSEA1+ cells. Representative hematoxylin and eosin images of each two mice brain (upper and lower) and higher magnification of each section (each right in group). (d) Tumor area was quantified. (e) Immunohistochemistry of Sox2 and Nestin in each brain. 4,6-Diamidino-2-phenylindole (DAPI) staining (blue) was used to identify nuclei. *P<0.05; **P<0.01; ***P<0.001 (Student’s t-test).
Figure 7
Figure 7
A proposed model for the importance of the maintenance of mitochondrial fitness in the prevention of tumor initiation is shown. An increase of mitochondrial NAD+ level with NNT overexpression impairs SSEA1+ tumor-initiating cell’s (TIC’s) characteristics such as sphere-forming ability and glycolytic metabolic reprogramming to produce lactate.

References

    1. Canto C, Menzies KJ, Auwerx J. NAD(+) metabolism and the control of energy homeostasis: a balancing act between mitochondria and the nucleus. Cell Metab 2015; 22: 31–53. - PMC - PubMed
    1. Yang Y, Sauve AA. NAD+ metabolism: bioenergetics, signaling and manipulation for therapy. Biochim Biophys Acta 2016; 1864: 1787–1800. - PMC - PubMed
    1. Verdin E. The many faces of sirtuins: coupling of NAD metabolism, sirtuins and lifespan. Nat Med 2014; 20: 25–27. - PubMed
    1. Schultz MB, Sinclair DA. Why NAD(+) declines during aging: it’s destroyed. Cell Metab 2016; 23: 965–966. - PMC - PubMed
    1. Ying W, Alano CC, Garnier P, Swanson RA. NAD+ as a metabolic link between DNA damage and cell death. J Neurosci Res 2005; 79: 216–223. - PubMed

Publication types

MeSH terms