. 2017 Jun 12:8:15824.
doi: 10.1038/ncomms15824.

Genetic diagnosis of Mendelian disorders via RNA sequencing

Affiliations

Genetic diagnosis of Mendelian disorders via RNA sequencing

Laura S Kremer et al. Nat Commun. .

Abstract

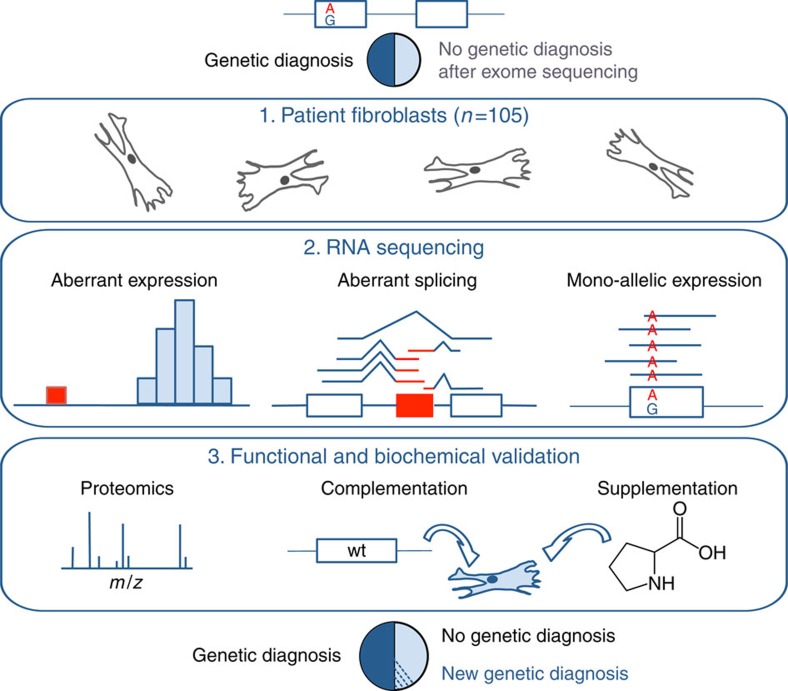
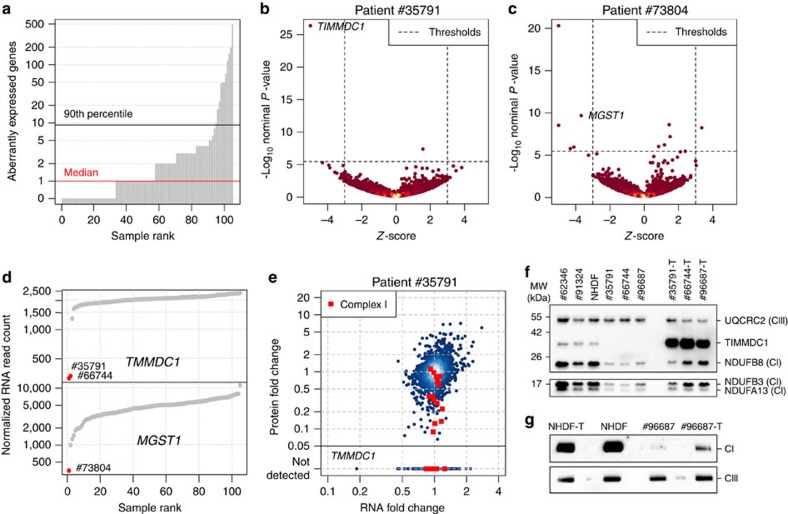
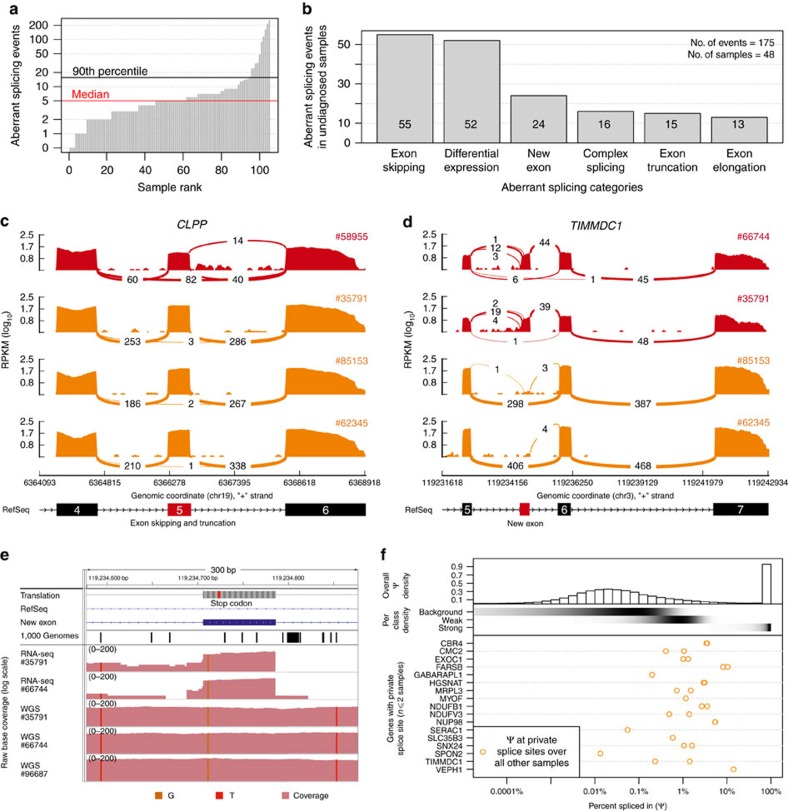
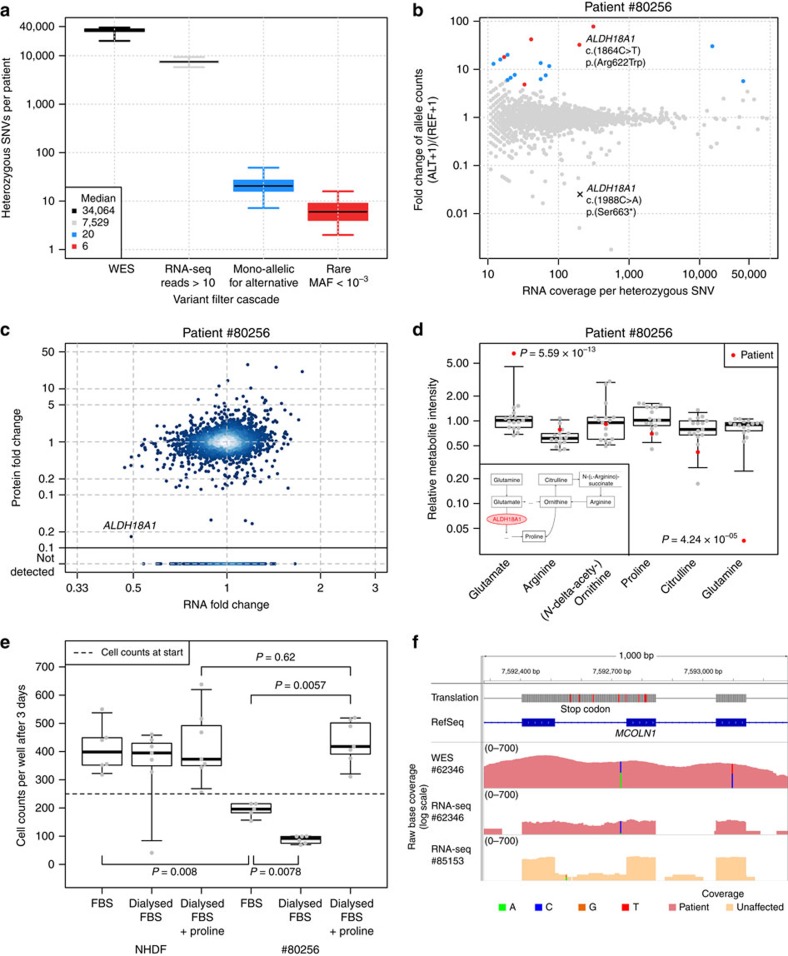
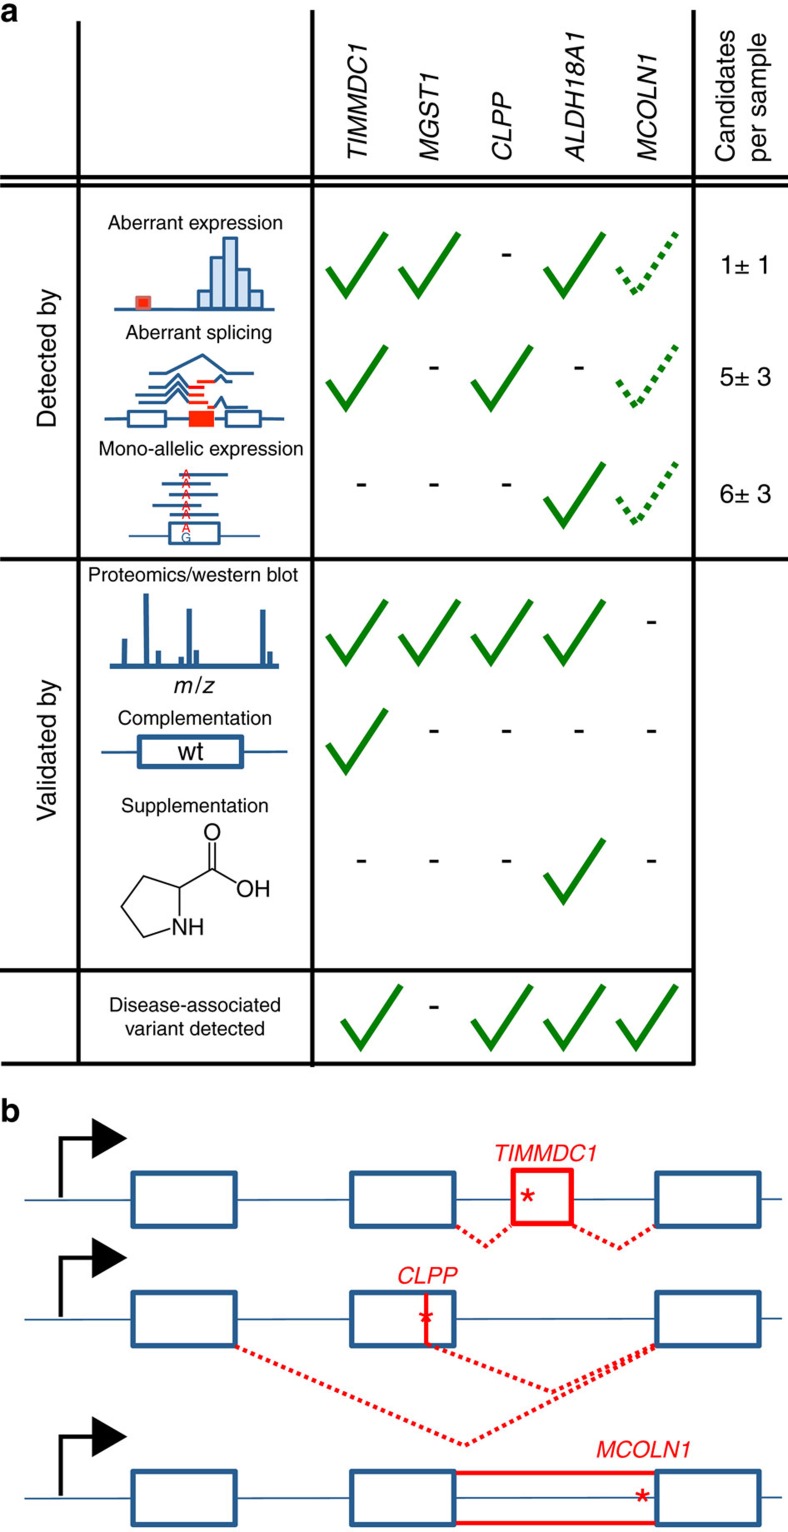
Across a variety of Mendelian disorders, ∼50-75% of patients do not receive a genetic diagnosis by exome sequencing indicating disease-causing variants in non-coding regions. Although genome sequencing in principle reveals all genetic variants, their sizeable number and poorer annotation make prioritization challenging. Here, we demonstrate the power of transcriptome sequencing to molecularly diagnose 10% (5 of 48) of mitochondriopathy patients and identify candidate genes for the remainder. We find a median of one aberrantly expressed gene, five aberrant splicing events and six mono-allelically expressed rare variants in patient-derived fibroblasts and establish disease-causing roles for each kind. Private exons often arise from cryptic splice sites providing an important clue for variant prioritization. One such event is found in the complex I assembly factor TIMMDC1 establishing a novel disease-associated gene. In conclusion, our study expands the diagnostic tools for detecting non-exonic variants and provides examples of intronic loss-of-function variants with pathological relevance.


Conflict of interest statement

The authors declare no competing financial interests.

Figures

Figure 1
Figure 1. Strategy for genetic diagnosis using RNA-seq.
The approach we followed started with RNA-seq of fibroblasts from unsolved WES patients. Three strategies to facilitate diagnosis were pursued: Detection of aberrant expression (for example, depletion), aberrant splicing (for example, exon creation) and MAE of the alternative allele (for example, A as alternative allele). Candidates were validated by proteomic measurements, lentiviral transduction of the wild-type (wt) allele or, in particular cases, by specific metabolic supplementation.
Figure 2
Figure 2. RNA aberrant expression detection and validation.
(a) Aberrantly expressed genes (Hochberg corrected P value<0.05 and |Z-score|>3) for each patient fibroblasts. (b) Gene-wise RNA expression volcano plot of nominal P values (−log10 P value) against Z-scores of the patient #35791 compared against all other fibroblasts. Z-scores with absolute value >5 are plotted at ±5, respectively. (c) Same as (b) for patient #73804. (d) Sample-wise RNA expression is ranked for the genes TIMMDC1 (top) and MGST1 (bottom). Samples with aberrant expression for the corresponding gene are highlighted in red (#35791, #66744, and #73804). (e) Gene-wise comparison of RNA and protein fold changes of patient #35791 compared to the average across the fibroblast cell lines of all other patients. Subunits of the mitochondrial respiratory chain complex I are highlighted (red squares). Reliably detected proteins that were not detected in this sample are shown separately with their corresponding RNA fold changes (points below solid horizontal line). (f) Western blot of TIMMDC1, NDUFA13, NDUFB3 and NDUFB8 protein in three fibroblast cell lines without (#62346, #91324, NHDF) and three with a variant in TIMMDC1 (#35791, #66744 and #96687), and fibroblasts re-expressing TIMMDC1 (‘-T’) (#35791-T, #66744-T and #96687-T). UQCRC2 was used as loading control. CI, complex I subunit; CIII, complex III subunit; MW, molecular weight. (g) Blue native PAGE blot of the control fibroblasts re-expressing TIMMDC1 (NHDF-T), the control fibroblasts (NHDF), patient fibroblasts (#96687) and patient fibroblast re-expressing TIMMDC1 (#96687-T). Immunodecoration for complex I and complex III was performed using NDUFB8 and UQCRC2 antibodies, respectively. CI, complex I subunit; CIII, complex III subunit.
Figure 3
Figure 3. Aberrant splicing detection and quantification.
(a) Aberrant splicing events (Hochberg corrected P value<0.05) for all fibroblasts. (b) Aberrant splicing events (n=175) in undiagnosed patients (n=48) grouped by their splicing category after manual inspection. (c) CLPP Sashimi plot of exon skipping and truncation events in CLPP-affected and CLPP-unaffected fibroblasts (red and orange, respectively). The RNA coverage is given as the log10 RPKM-value and the number of split reads spanning the given intron is indicated on the exon-connecting lines. At the bottom the gene model of the RefSeq annotation is depicted and the aberrantly spliced exon is coloured in red. (d) Same as in c for TIMMDC1. At the bottom the newly created exon is depicted in red within the RefSeq annotation track. (e) Coverage tracks (light red) for patients #35791, #66744, and #91324 based on RNA and WGS. For patient #91324 only WGS is available. The homozygous SNV c.596+2146A>G is present in all coverage tracks (vertical orange bar). The top tracks show the genomic annotation: genomic position on chromosome 3, DNA sequence, amino acid translation (grey, stop codon in red), the RefSeq gene model (blue line), the predominant additional exon of TIMMDC1 (blue rectangle) and the SNV annotation of the 1000 Genomes Project (each black bar represents one variant). (f) Per cent spliced in (Ψ) distribution for different splicing classes and genes. Top: histogram of the genome-wide distribution of the 3′ and 5′ Ψ-values based on all reads over all samples. Middle: The shaded horizontal bars represent the densities (black for high density) of the background, weak and strong splicing class, respectively (Methods section). Bottom: Ψ-values of the predominant donor and acceptor splice sites of genes with private splice sites (that is, found predominant in at most two samples) computed over all other samples.
Figure 4
Figure 4. Detection and validation of MAE of rare variants.
(a) Distribution of heterozygous single nucleotide variants (SNVs) across samples for different consecutive filtering steps. Heterozygous SNVs detected by exome sequencing (black), SNVs with RNA-seq coverage of at least 10 reads (grey), SNVs where the alternative allele is mono-allelically expressed (alternative allele frequency >0.8 and Benjamini-Hochberg corrected P value <0.05, blue), and the rare subset of those (ExAC minor allele frequency <0.001, red). (b) Fold change between alternative (ALT+1) and reference (REF+1) allele read counts for the patient #80256 compared to total read counts per SNV within the sample. Points are coloured according to the groups defined in a. (c) Gene-wise comparison of RNA and protein fold changes of the patient #80256 compared to the average across the fibroblast cell lines of all other patients. The position of the gene ALDH18A1 is highlighted. Reliably detected proteins that were not detected in this sample are shown separately with their corresponding RNA fold changes (points below solid horizontal line). (d) Relative intensity for metabolites of the proline biosynthesis pathway (inlet) for the patient #80256 and 16 healthy controls of matching age. Equi-tailed 95% interval (whiskers), 25th, 75th percentile (boxes) and median (bold horizontal line) are indicated. Data points belonging to the patient are highlighted (red circles, P values were computed using the Student’s t-test). (e) Cell counts under different growth conditions for the NHDF and patient #80256. Both fibroblasts were grown in fetal bovine serum (FBS), dialysed FBS (without proline) and dialysed FBS with proline added. Boxplot as in d. P values are based on a two-sided Wilcoxon test. (f) Intron retention for MCOLN1 in patient #62346. Tracks from top to bottom: genomic position on chromosome 19, amino acid translation (red for stop codons), RefSeq gene model, coverage of WES of patient #62346, RNA-seq based coverage for patients #62346 and #85153 (red and orange shading, respectively). SNVs are indicated by non-reference coloured bars with respect to the corresponding reference and alternative nucleotide.
Figure 5
Figure 5. Characterization of diagnoses and variants causing aberrant splicing.
(a) Detection strategy and validation of genes with RNA defects in newly diagnosed patients, that is, TIMMDC1 (n=2 patients), CLPP, ALDH18A1 and MCOLN1, and one patient with a strong candidate, that is, MGST1. The median number (±median absolute deviation) of candidate genes is given per detection strategies. Dotted check: identified by manual inspection (not statistically significant). (b) Schematic representation of variant causing splicing defects for TIMMDC1 (top, new exon red box), CLPP (middle, exon skipping and truncation) and MCOLN1 (bottom, intron retention). Variants are depicted by a red star.

References

    1. Wortmann S. B., Koolen D. A., Smeitink J. A., van den Heuvel L. & Rodenburg R. J. Whole exome sequencing of suspected mitochondrial patients in clinical practice. J. Inherit. Metab. Dis. 38, 437–443 (2015). - PMC - PubMed
    1. 1000 Genomes Project Consortium. et al.. A global reference for human genetic variation. Nature 526, 68–74 (2015). - PMC - PubMed
    1. Sudmant P. H. et al.. An integrated map of structural variation in 2,504 human genomes. Nature 526, 75–81 (2015). - PMC - PubMed
    1. Taylor J. C. et al.. Factors influencing success of clinical genome sequencing across a broad spectrum of disorders. Nat. Genet. 47, 717–726 (2015). - PMC - PubMed
    1. Li X. et al.. The impact of rare variation on gene expression across tissues. bioRxiv doi:; DOI: 10.1101/074443 (2016). - DOI - PMC - PubMed

Publication types