. 2017 Aug;20(8):1074-1084.
doi: 10.1038/nn.4584. Epub 2017 Jun 12.

A TNF-JNK-Axl-ERK signaling axis mediates primary resistance to EGFR inhibition in glioblastoma

Affiliations

A TNF-JNK-Axl-ERK signaling axis mediates primary resistance to EGFR inhibition in glioblastoma

Gao Guo et al. Nat Neurosci. 2017 Aug.

Abstract

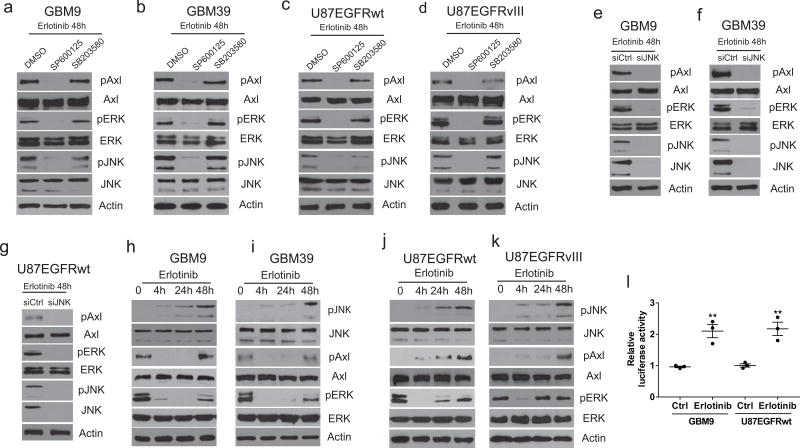
Aberrant epidermal growth factor receptor (EGFR) signaling is widespread in cancer, making the EGFR an important target for therapy. EGFR gene amplification and mutation are common in glioblastoma (GBM), but EGFR inhibition has not been effective in treating this tumor. Here we propose that primary resistance to EGFR inhibition in glioma cells results from a rapid compensatory response to EGFR inhibition that mediates cell survival. We show that in glioma cells expressing either EGFR wild type or the mutant EGFRvIII, EGFR inhibition triggers a rapid adaptive response driven by increased tumor necrosis factor (TNF) secretion, which leads to activation in turn of c-Jun N-terminal kinase (JNK), the Axl receptor tyrosine kinase and extracellular signal-regulated kinases (ERK). Inhibition of this adaptive axis at multiple nodes rendered glioma cells with primary resistance sensitive to EGFR inhibition. Our findings provide a possible explanation for the failures of anti-EGFR therapy in GBM and suggest a new approach to the treatment of EGFR-expressing GBM using a combination of EGFR and TNF inhibition.


Figures

Figure 1
Figure 1. EGFR inhibition triggers an adaptive response in glioma cells
(a) Western blot showing EGFR levels in established GBM cell lines and patient derived primary GBM neurospheres. (b) Patient derived primary GBM neurospheres (GBM9) were exposure to erlotinib (1µM) for the indicated times followed by Western blot with the indicated antibodies. (c–d) A similar experiment in patient derived GBM neurospheres from two different patients (GBM39 and SK987). (e) U87EGFR cells were treated with erlotinib (1µM) for the indicated times followed by Western blot with the indicated antibodies. (f) Similar experiment was conducted in U87EGFRvIII cells. (g–j) Axl was inhibited using R428 (1µM), a specific inhibitor of Axl. Cells were exposed to Erlotinib followed by Western blot. Erlotinib-induced ERK activation is inhibited when the Axl inhibitor is used in both established GBM cell lines as well as patient derived neurospheres. (k–n) siRNA knockdown of Axl results in an inhibition of erlotinib induced ERK activation in both established cell lines as well as patient derived neurospheres. Control siRNA or Axl siRNA was transfected into cells (for 48h), followed by addition of erlotinib for 48h and WB with indicated antibodies. Western blots shown in a-n are representative of at least three independent replicates. Full-length blots are presented in Supplementary Figure 11.
Figure 2
Figure 2. EGFR inhibition induced Axl and ERK activation is mediated by JNK
(a–b) Patient derived primary GBM neurospheres were exposed to erlotinib for 48 hours in the presence or absence of JNK inhibitor SP600125 (1µM) or p38 inhibitor SB203580 (10µM) followed by Western blot with the indicated antibodies. (c–d) U87EGFRwt or U87EGFRvIII cells were exposed to erlotinib for 48 hours in the presence or absence of SP600125 or SB203580 followed by Western blot with the indicated antibodies. (e–f) siRNA knockdown for JNK1 and JNK2 was conducted in GBM9 and GBM39 neurospheres followed by exposure to erlotinib for 48h and Western blot with the indicated antibodies. (g) A similar experiment was done in U87EGFRwt cells. (h–k) shows that JNK is activated in response to erlotinib in patient derived primary neurospheres as well as established GBM cell lines as determined by the phosphorylation of JNK. Western blots shown in a-k are representative of at least three independent replicates. Full-length blots are presented in Supplementary Figure 12. (l) A luciferase reporter assay shows that EGFR inhibition with erlotinib results in an increase in AP-1 transcriptional activity in GBM9 and U87EGFRwt cells. Erlotinib was used for 24h (1µM). GBM9: Ctrl vs erlotinib: P =0.0056, t=5.43, d.f.=4 **P<0.01; U87EGFRwt: Ctrl vs erlotinib: P =0.0061, t=5.31, d.f.=4. **P<0.01. Data are presented as mean±s.e.m. Significant difference analyzed by an unpaired Student's t-test ( n = 3 biologically independent experimental replicates).
Figure 3
Figure 3. EGFR inhibition leads to increased GAS6 levels via a JNK dependent mechanism
(a) GBM9 neurospheres were exposed to erlotinib in the absence or presence of JNK inhibitor SP600125 for 24h (1µM) for 24h followed by quantitative real time PCR for GAS6 mRNA. GAS6 is increased upon EGFR inhibition, and this increase is blocked by JNK inhibition. Ctrl vs erlotinib: P =0.0039, t=5.98, d.f.=4; erlotinib vs erlotinib+SP600125: P =0.0070, t=5.10, d.f.=4. (b–d) A similar experiment was undertaken in U87EGFRwt, U87EGFRvIII and patient derived neurosphere GBM39. (b) Ctrl vs erlotinib: P=0.0006, t=9.83, d.f.=4; erlotinib vs erlotinib+SP600125: P =0.0007, t=9.48, d.f.=4. (c) Ctrl vs erlotinib: P =0.0011, t=8.39, d.f.=4; erlotinib vs erlotinib+SP600125: P =0.0018, t=7.32, d.f.=4. (d) Ctrl vs erlotinib: P=0.0012, t=8.20, d.f.=4; erlotinib vs erlotinib+SP600125: P =0.0022, t=6.97, d.f.=4. (e) An ELISA showing the erlotinib (1µM for 24h) induced increase in GAS6 levels at a protein level. U87EGFRwt: Ctrl vs erlotinib: P=0.0175, t=3.90, d.f.=4; U87EGFRvIII: Ctrl vs erlotinib: P=0.0030, t=6.45, d.f.=4; GBM9: Ctrl vs erlotinib: P =0.0087, t=4.80, d.f.=4. Data are presented as mean±s.e.m; * P <0.05, **P < 0.01, *** P< 0.001 from two-tailed unpaired Student's t-test ( n = 3 biologically independent experimental replicates). (f) Western blot showing increase of GAS6 protein in both GBM9 and U87EGFRwt cells upon erlotinib treatment Western blots shown in a-k are representative of at least three independent replicates. Full-length blots are presented in Supplementary Figure 12. (g) A schematic of the GAS6 promoter showing AP-1 sites. (h–i) ChIP assay showing the presence of c-Jun on the GAS6 promoter in response to erlotinib (1µM for 24h) in GBM9 neurospheres and in U87EGFRwt cells. ChIP results are representative of at least three independent replicates. Full-length DNA agarose gels are presented in Supplementary in Figure 12.
Figure 4
Figure 4. EGFR inhibition leads to increased TNF signaling that triggers an adaptive signaling pathway
(a–b) EGFR inhibition leads to an increase in TNF mRNA in patient derived GBM9 and GBM39 neurospheres. Cells were exposed to erlotinib (100 nM) for the times indicated followed by qRT-PCR for TNF mRNA. (a) 0 vs 24h: P =0.0019, t=7.22, d.f.=4. (b) 0 vs 4h: P =0.0102, t=4.58, d.f.=4; 0 vs 24h: P =0.0021, t=7.10, d.f.=4. (c–d) A similar experiment was conducted in U87EGFRwt and U87EGFRvIII cells using an erlotinib concentration of 1 µM. (c) 0 vs 4h: P =0.0018, t=7.41, d.f.=4; 0 vs 24h: P =0.0012, t=8.20, d.f.=4. (d) 0 vs 4h: P =0.0030, t=6.46, d.f.=4; 0 vs 24h: P =0.0054, t=5.47, d.f.=4. (e) A TNF ELISA was performed on supernatants from erlotinib treated U87EGFRwt and U87EGFRvIII cells (1µM) and GBM9 and GBM39 neurospheres (100 nM). U87EGFRwt: 0 vs 24h: P =0.0056, t=5.42, d.f.=4; 0 vs 48h: P=0.0006, t=10.4, d.f.=4; U87EGFRVIII: 0 vs 24h: P =0.0022, t=6.98, d.f.=4; 0 vs 48h: P =0.0083, t=4.86, d.f.=4; GBM9: 0 vs 24h: P =0.01, t=4.6, d.f.=4; 0 vs 48h: P =0.0043, t=5.84, d.f.=4; GBM39: 0 vs 24h: P =0.0189, t=3.82, d.f.=4; 0h vs 48h: P =0.0024, t=6.81, d.f.=4. Data are presented as mean±s.e.m; * P ≤ 0.05, **P ≤ 0.01, ***P≤ 0.001 from two-tailed unpaired Student's t-test ( n = 3 biologically independent experimental replicates). (f) Time course of TNF upregulation in mouse tumors exposed to erlotinib 50mg/kg for the indicated time points after formation of subcutaneous tumors (n=3). Tumors were removed following erlotinib exposure followed by TNF ELISA on protein extracts. 0 vs 1d: P =0.0045, t=5.77, d.f.=4; 0 vs 2d: P =0.0002, t=13.92, d.f.=4; 0 vs 7d: P =0.0245, t=3.52, d.f.=4. Data are presented as mean±s.e.m; * P< 0.05, **P< 0.01, ***P< 0.001 from a two-tailed unpaired Student's t-test. (g) Shows signal transduction in tumors exposed to erlotinib (50mg/kg) for the indicated time points. (h) A neutralizing antibody to TNF (1µg/ml) blocked erlotinib induced activation of Axl, ERK and JNK in GBM9 and GBM39 neurospheres and U87EGFRwt and U87EGFRvIII cell lines, while a control antibody had no effect. (i) siRNA knockdown of TNFR1 blocked erlotinib induced activation of Axl, ERK and JNK in GBM9 and GBM39 neurospheres and also U87EGFRwt and U87EGFRvIII cell lines, while control (scrambled siRNA) had no effect. Western blots shown in g-I are representative of at least three independent replicates. Full-length blots are presented in Supplementary Figure 13.
Figure 5
Figure 5. Inhibition of JNK and ERK renders glioma cells sensitive to EGFR inhibition
(a) AlamarBlue assay in established GBM cell lines exposed to erlotinib (10µM). Cells are completely resistant to the effects of EGFR inhibition. (b–c) Patient derived GBM9 or GBM39 neurospheres were exposed to erlotinib (100nM) with or without JNK inhibitor SP600125 (1µM), p38 inhibitor SB203580 (10µM), or ERK inhibitor U0126 (1µM), followed by Alamarblue Cell Survival Assay after 72h of inhibitor exposure. (b) Erlotinib vs erlotinib+SP600125: P =0.0015,t=7.75, d.f.=4; erlotinib vs erlotinib+U0126: P =0.0013, t=8.10, d.f.=4. (c) erlotinib vs erlotinib+SP600125: P =0.0057,t=5.41, d.f.=4; Erlotinib vs Erlotinib+U0126: P =0.0023, t=6.93, d.f.=4. (d–e) A similar experiment was conducted in U87EGFRwt and U87EGFRvIII cells. (d) erlotinib vs erlotinib+SP600125: P =0.0016,t=7.61, d.f.=4; Erlotinib vs Erlotinib+U0126: P =0.0017, t=7.48, d.f.=4. (e) erlotinib vs erlotinib+SP600125: P =0.0003,t=12.23, d.f.=4; erlotinib vs erlotinib+U0126: P=0.0014, t=7.87, d.f.=4. (f) siRNA knockdown of JNK1 and JNK2 in GBM9 neurospheres results in an enhanced sensitivity to erlotinib, whereas control siRNA has no effect. Erlotinib+siCtrl vs erlotinib+siJNK1/2: P =0.0002, t=13.96, d.f.=4. (g) siRNA knockdown of JNK1 and JNK2 in GBM39 neurosphere cells has a similar effect. Erlotinib+siCtrl vs Erlotinib+siJNK1/2: P =0.0003,t=11.86, d.f.=4. (h) U87EGFRwt cells results in an enhanced sensitivity to erlotinib, whereas control siRNA has no effect. Erlotinib+siCtrl vs erlotinib+siJNK1/2: P =0.0017, t=7.52, d.f.=4. (i–j) Patient derived GBM9 or GBM39 neurospheres were exposed to erlotinib (100nM) with or without Axl inhibitor R428 (1µM) followed by Alamarblue Cell Survival Assay after 72h. (i) Erlotinib vs erlotinib+R428: P =0.0025,t=6.75, d.f.=4. (i) Erlotinib vs erlotinib+R428: P =0.0023,t=6.93, d.f.=4. (k) A similar experiment was done in U87EGFRwt cells using an erlotinib concentration of 1µM. Erlotinib vs erlotinib+R428: P =0.0094, t=4.69, d.f.=4. (l–n) siRNA knockdown of Axl in GBM9 and GBM39 neurospheres or U87EGFRwt cells sensitizes cells to the effect of erlotinib but not control siRNA as determined by Alamarblue Cell Viability Assay. (l) Erlotinib+siCtrl vs erlotinib+siAxl: P=0.0004,t=11.23, d.f.=4. (m) Erlotinib+siCtrl vs erlotinib+siAxl: P =0.0003, t=12.80, d.f.=4. (n) Erlotinib+siCtrl vs erlotinib+R428: P =0.0058, t=5.38, d.f.=4. Data are presented as mean±s.e.m; **P < 0.01, ***P<0.001 from two-tailed unpaired Student's t-test ( n = 3 biologically independent experimental replicates).
Figure 6
Figure 6. TNF inhibition sensitizes glioma cells to EGFR inhibition
(a–b) AlamarBlue cell viability assay in GBM9 or GBM39 neurospheres. Enbrel (100 nM) sensitizes cells to EGFR inhibition with erlotinib. Enbrel and erlotinib were added to GBM9 or GBM39 neurospheres concurrently and AlamarBlue assay was done after 72h. (a) Erlotinib vs Erlotinib+Enbrel: P=0.0027, t=6.59, d.f.=4. (b) Erlotinib vs erlotinib+enbrel: P =0.0044, t=6.59, d.f.=4. (c) A similar experiment was performed in U87EGFRwt cells. Erlotinib vs Erlotinib+Enbrel: P =0.0056, t=5.41, d.f.=4. (d–e) TNFR1 was silenced using siRNA in GBM9 and GBM39 cells and cells were exposed to erlotinib for 72h in stem cell medium without EGF for 72h followed by Alamarblue Assay. (d) Erlotinib+siCtrl vs erlotinib+siTNFR1: P =0.0014, t=7.95, d.f.=4. (e) Erlotinib+siCtrl vs erlotinib+siTNFR1: P =0.0041, t=5.90, d.f.=4. (f) A similar experiment was done in U87EGFRwt cells. Erlotinib+siCtrl vs erlotinib+siTNFR1: P =0.0021, t=7.11, d.f.=4. (g–i) Thalidomide sensitizes GBM9 and GBM39 cells to EGFR inhibition with erlotinib. Thalidomide (1µM) and erlotinib were added to GBM9 and GBM39 neurospheres (100nM) or U87EGFRwt cells (1uM) concurrently and AlamarBlue assay was done after 72h. (g) Erlotinib vs erlotinib+thalidomide: P=0.0030, t=6.42, d.f.=4. (h) Erlotinib vs erlotinib+thalidomide: P=0.0027, t=6.59, d.f.=4. (i) Erlotinib vs erlotinib+thalidomide: P =0.0013, t=8.11, d.f.=4. (j–k) Enbrel or thalidomide block erlotinib induced activation of JNK, Axl and ERK in GBM9 and GBM39 neurospheres as shown in the Western blot. (l) A similar experiment was conducted in U87EGFRwt cells. Western blots shown in j-l are representative of at least three independent replicates. Full-length blots are presented in Supplementary Figure 14. (m–n) show that exogenous TNF protects GBM9 and GBM39 neurospheres from erlotinib induced cell death. TNF (1ng/ml) and erlotinib (1µM) were added to cells concurrently and AlamarBlue cell viability assay was done after 72h. (m) Erlotinib vs erlotinib+TNF: P =0.0018, t=7.41, d.f.=4. (n) Erlotinib vs erlotinib+TNF: P=0.0087, t=4.79, d.f.=4. Data are presented as mean±s.e.m; **P < 0.01, ***P< 0.001 from two-tailed unpaired Student's t-test ( n = 3 biologically independent experimental replicates).
Figure 7
Figure 7. JNK or TNF inhibition sensitizes mouse tumors to EGFR inhibition in vivo
(a) Treatment of subcutaneous tumors with a combination of erlotinib and SP600125. The tumor growth did not decrease in mice treated erlotinib or SP600125 alone, whereas the combination of erlotinib and SP600125 was found to decrease tumor growth significantly. Unpaired t-test, erlotinib vs erlotinib+SP600125: P =0.0003, t=4.70, d.f.=14, ***P<0.001. (b) Treatment of subcutaneous tumors with a combination of erlotinib and thalidomide. The tumor growth did not decrease in mice treated erlotinib (50mg/kg) or thalidomide (150mg/kg) alone, whereas the combination of erlotinib and thalidomide was found to decrease tumor growth significantly. Unpaired t-test, Erlotinib vs erlotinib+thalidomide: ****P<0.0001, t=6.1, d.f.=14. (c) Combined treatment of erlotinib and thalidomide prolonged survival and suppressed tumor growth in an orthotopic model. Kaplan-Maier survival curves were calculated using GraphPad Prism 7. Statistical significance verified by the log rank test, P=0.0008, ***P<0.001. (d) Representative bioluminescence images from erlotinib and erlotinib plus thalidomide group at day 1, 10 and 20 post-treatment. Since all the mice in vehicle and thalidomide group died within 20 days after transplant, images at day 20 post-treatment were not available. (e) Time course of TNF upregulation in mouse tumors exposed to erlotinib 50mg/kg for the indicated time points (n=3). Tumors were removed following erlotinib exposure followed by TNF ELISA on protein extracts. 0 vs 1d: P =0.0091, t=4.73, d.f.=4; 0 vs 2d: P =0.0005, t=10.36, d.f.=4; 0 vs 7d: P =0.0181, t=3.86, d.f.=4. Data are presented as mean±s.e.m; * P<0.05, **P<0.01, ***P<0.001 from a two-tailed unpaired Student's t-test. (f) Shows signal transduction in intracranial tumors exposed to erlotinib (50mg/kg) for the indicated time points. (g) Western blots of intracranial tumor lysates obtained from erltinib and/or thalidomide treated mice. The animals without treatment were considered as Ctrl (control, 0-day treatment). Western blots shown in f and g are representative of three independent replicates. Full-length blots are presented in Supplementary Figure 14.

Comment in

Similar articles

Cited by

References

    1. Sharma SV, Bell DW, Settleman J, Haber DA. Epidermal growth factor receptor mutations in lung cancer. Nat Rev Cancer. 2007;7:169–181. - PubMed
    1. Arteaga CL, Engelman JA. ERBB receptors: from oncogene discovery to basic science to mechanism-based cancer therapeutics. Cancer Cell. 2014;25:282–303. - PMC - PubMed
    1. Chong CR, Janne PA. The quest to overcome resistance to EGFR-targeted therapies in cancer. Nature medicine. 2013;19:1389–1400. - PMC - PubMed
    1. Fan W, et al. MET-independent lung cancer cells evading EGFR kinase inhibitors are therapeutically susceptible to BH3 mimetic agents. Cancer Res. 2011;71:4494–4505. - PMC - PubMed
    1. Lee HJ, et al. Drug resistance via feedback activation of Stat3 in oncogene-addicted cancer cells. Cancer Cell. 2014;26:207–221. - PubMed

MeSH terms

Substances