. 2017 Jun 12:8:15860.
doi: 10.1038/ncomms15860.

Differential processing of thalamic information via distinct striatal interneuron circuits

Affiliations

Differential processing of thalamic information via distinct striatal interneuron circuits

Maxime Assous et al. Nat Commun. .

Abstract

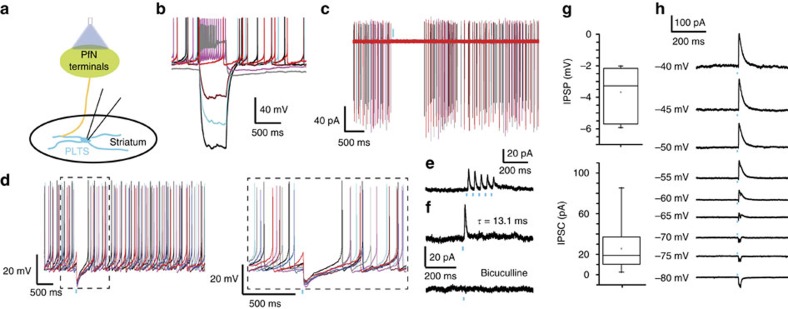
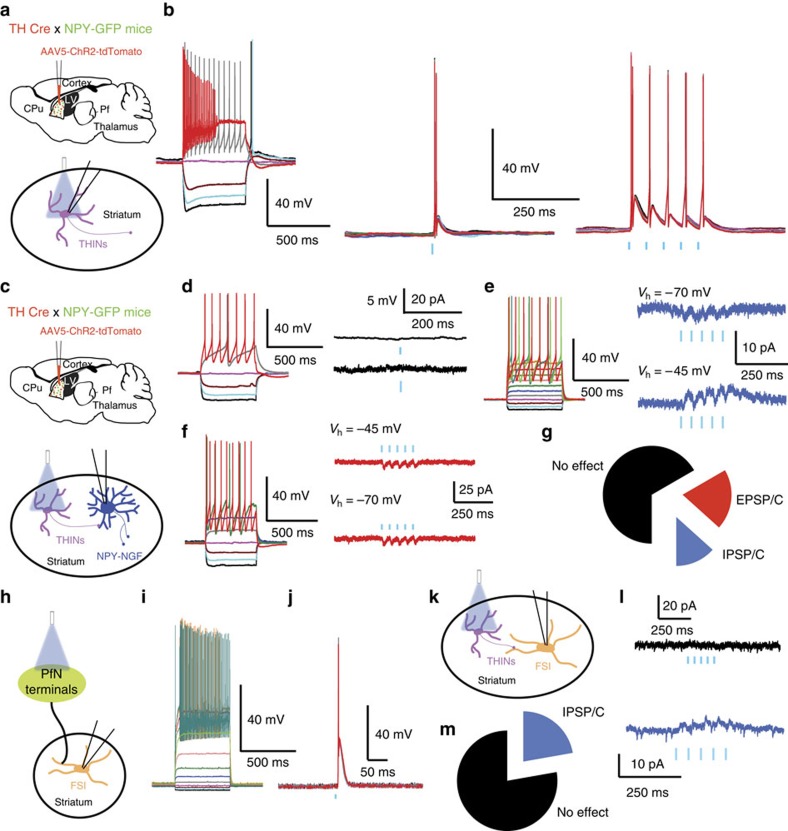
Recent discoveries of striatal GABAergic interneurons require a new conceptualization of the organization of intrastriatal circuitry and their cortical and thalamic inputs. We investigated thalamic inputs to the two populations of striatal neuropeptide Y (NPY) interneurons, plateau low threshold spike (PLTS) and NPY-neurogliaform (NGF) cells. Optogenetic activation of parafascicular inputs evokes suprathreshold monosynaptic glutamatergic excitation in NGF interneurons and a disynaptic, nicotinic excitation through cholinergic interneurons. In contrast, the predominant response of PLTS interneurons is a disynaptic inhibition dependent on thalamic activation of striatal tyrosine hydroxylase interneurons (THINs). In contrast, THINs do not innervate NGF or fast spiking interneurons, showing significant specificity in THINs outputs. Chemospecific ablation of THINs impairs prepulse inhibition of the acoustic startle response suggesting an important behavioural role of this disynaptic pathway. Our findings demonstrate that the impact of the parafascicular nucleus on striatal activity and some related behaviour critically depend on synaptic interactions within interneuronal circuits.


Conflict of interest statement

The authors declare no competing financial interests.

Figures

Figure 1
Figure 1. Transduction field in thalamus and input to NPY interneurons in the striatum.
(a) Schematic illustration of the experimental preparation. (b) Representative low-magnification photomicrographs of NPY-GFP cells (green) and ChR2-mcherry (red) transduced PfN axons in striatum (left) and cell bodies in thalamus (right). Scale bar, 100 μM. cc, corpus callosum; LV, lateral ventricle; PfN, parafascicular nucleus. (c) Recordings of NGF interneurons were obtained while stimulating PfN terminals in striatum with 2 ms blue light pulses. (d) Responses of a typical NGF interneuron to injected current pulses. Note the very large afterhyperpolarization (AHP). Scale bar, 30 μM (e,f) Current-clamp recordings of an NGF interneuron. Optogenetic stimulation of PfN terminals evokes a large EPSP that is significantly reduced by the application of glutamate receptor antagonists (CNQX 10 μM, P=0.0015 versus control and APV 10 μM, P<0.0001 versus control; one-way ANOVA followed by Tukey's multiple comparisons test, n=6) (e). The excitatory response is sufficient to trigger action potential firing ((f), n=8/21 recorded NGF). (g) More than 90% of NGF interneurons are excited by PfN stimulation. (h) Recordings of PLTS interneurons while stimulating PfN terminals in striatum with 2 ms blue light pulses. Scale bar, 10 μM. (i) Membrane potential responses of a typical PLTS interneuron to injected current pulses. (j) Spontaneously active PLTS interneurons showing the inhibition caused by optogenetic PfN stimulation. (k) Example of the subthreshold EPSP seen in a minority of PLTS cells. (l) Note the high proportion of no response in PLTS interneurons and that the most frequent response was an IPSC/P (n=22/45 for IPSP/C, n=13/45 for no response, n=4/45 for mixed and n=6/45 for EPSP/C). Box plots represent the minimum, maximum interquartile range, the mean and median.
Figure 2
Figure 2. NPY-PLTS and NPY-NGF interneurons respond differentially to optogenetic stimulation of cortex.
(a) Schematic of the experimental paradigm for optogenetic activation of corticostriatal inputs and recording NPY-expressing interneurons in the striatum. (b) Confocal images of the transduction field in the cortex (upper panels) and in the striatum (lower panels). Green channel represents the NPY-GFP interneurons and red channel represents the CAMKII-ChR2-mCherry virus transduction. (ch) Response of PLTS to cortical optogenetic stimulation. (upper panels in d and e) Responses of typical PLTS interneurons to injected current pulses. (d,e) Optogenetic stimulation of the cortex elicits large depolarization, action potential firing and plateau potentials in NPY-PLTS interneurons. (f) Percentage of PLTS cells that responded to stimulation of the cortex. Note that the vast majority of PLTS cells spike after cortical stimulation. (g) Box plots representing the amplitude of the EPSP/C evoked by the optogenetic stimulation (n=5 and n=10, respectively). (h) Voltage-clamp recording (Vh=−70 mV) showing that the excitatory response is blocked by CNQX and APV, 10 μM. (im) Response of NGF interneurons to cortical stimulation. (j) Responses of typical NGF interneurons to injected current pulses. (k) Current-clamp and voltage-clamp recording of an NPY-NGF interneuron showing that optogenetic cortical stimulation provokes EPSP/Cs that are blocked by ionotropic glutamate receptor antagonists. (l) Box plots representing the amplitude of the EPSP/C provoked by the optogenetic stimulation (n=8 for both EPSP and EPSC). (m) Percentage of NPY-NGF cells that responded to optogenetic stimulation of the cortex. Note that although many NGF cells are excited by cortical stimulation only a minority of them spike. Blue bars indicate optical stimulation.
Figure 3
Figure 3. Excitation in NGF interneurons after thalamic stimulation can be biphasic.
(a) Schematic of experiment (b) Membrane potential responses characteristic of a typical NGF interneuron to injected current pulses. (c) Optogenetic stimulation of thalamus evoked two kinetically distinct EPSPs. EPSP1 is monosynaptic and shows no latency variability while EPSP2 is later, slower, and shows considerable variability in onset latency. Upper panel: average of 20 sweeps in one neuron. Lower panel: individual traces. (d) Voltage clamp (Vh=−70 mV) in the same neuron shows a dual EPSC with the early component (EPSC1) larger and faster than the late component (EPSC2). Upper panel: average of 20 sweeps. Lower panel: individual traces. Note the large variation in the onset latency of EPSC2. (e) Summary box plots of the average optogenetic EPSP/C2 (n=6). Box plots represent the minimum, maximum interquartile range, the mean and median.
Figure 4
Figure 4. CINs are responsible for the late component of the EPSP/C of NGF interneurons after thalamic stimulation.
(a) Schematic of the effect of optogenetic stimulation of PfN on CINs. (b) Membrane potential responses of a typical spontaneously active CIN to injected current pulses. (c) 5 ms light pulse evokes depolarization and spiking. (d) Higher-resolution view of the sweeps in c. Note the large variability in the latency to spiking following the optical pulse (n=4). (e) Upper: membrane potential responses of a typical NGF interneuron to injected current pulses. Middle and bottom: optogenetic stimulation of PfN terminals evokes a two component EPSP (black trace, control). The late EPSP is completely blocked by bath application of 1 μM DHßE (red traces) without affecting the first EPSP (n=5). (f) Voltage-clamp recording (Vh=−70 mV) of a NGF interneuron during optogenetic stimulation of PfN terminals. Higher-resolution sweeps illustrate the variability in the onset latency of the late EPSC. The late EPSC is completely abolished by bath application of DHßE (lower panel). (g) Graphs showing the reduction of the EPSP2 size after DHßE (P=0.0083 paired t-test, n=5). (h) Summary schematic illustrating the circuitry responsible for early and late synaptic responses. Box plots represent the minimum, maximum interquartile range, the mean and median.
Figure 5
Figure 5. Optogenetic stimulation of the thalamus induces inhibition in most PLTS interneurons.
(a) Schematic of experiment. (b) Responses of a typical PLTS interneuron to injected current pulses. (c) Cell-attached recording of same PLTS interneuron showing optogenetic stimulation (blue bar) induced inhibition of spontaneous activity (n=4). (d) Another spontaneously active PLTS interneuron whose firing is completely inhibited by a 2 ms blue light pulse in current clamp (n=14). Lower panel: higher-resolution trace of area shown in dashed box shown in the upper panel. (e) PLTS interneuron following short optical train (2 ms at 20 Hz) elicits depressing IPSCs to each stimulus in train. (f) Upper panel: single IPSC evoked by 2 ms optical light pulse is blocked completely by 10 μM bicuculline (n=8). (g) Box plots representing the amplitude of the optogenetic IPSP/C. (h) Voltage-clamp recordings at variable holding potentials (from −80 to −40 mV) show that the IPSC reverses close to −70 mV. Box plots represent the minimum, maximum interquartile range, the mean and median.
Figure 6
Figure 6. Thalamic input to THINs.
(a) Schematic of experiments (bd). (b) Responses of typical type I THIN to injected current pulses. 5 ms optical stimulation of PfN terminals (blue bar) evokes large, often suprathreshold EPSPs (n=23, 18/23 were firing action potential). (c) Responses of another type I THIN to current pulses. The same cell in voltage clamp responds to same optical stimulation with a large EPSC that is completely abolished by 10 μM CNQX and APV (n=9). Lower panel: complete block of EPSP and spiking by 10 μM CNQX and APV (n=9). (d) Summary box plots of mean EPSP and EPSC amplitudes. Box plots represent the minimum, maximum interquartile range, the mean and median.
Figure 7
Figure 7. PLTS interneurons receive synaptic input from THINs.
(a) Schematic of experimental preparation. (b) Responses of a typical PLTS interneuron to injected current pulses. (c) Optogenetic activation of THINs evokes an IPSP in a PLTS interneuron (n=27/32 recorded PLTS) that is blocked by 10 μM bicuculline (n=11). (d) Brief train (5 2 ms pulses at 20 Hz) evokes short-term depression in the IPSC that is blocked by bicuculline (n=9) (Vh=−45 mv). (e) Box plots showing mean amplitudes of the IPSC and IPSP. (f) Optogenetic stimulation of TH interneurons inhibits spontaneous firing of a PLTS interneuron (n=13). Lower panel: higher-resolution traces of the portion of spike train above indicated by the dashed line to show IPSP. (g) Upper: after injecting a 50 pA current pulse that induces firing, optogenetic activation of THINs (blue bar) induces a brief pause in firing. Lower: with 100 pA current pulse, the PLTS interneuron enters depolarization block that is relieved by optogenetic activation of THINs. (h) Optogenetic inhibition of a spontaneously active PLTS interneuron is reversibly blocked by bicuculline. Box plots represent the minimum, maximum interquartile range, the mean and median.
Figure 8
Figure 8. Optogenetic inhibition of THINs greatly decreases or eliminates PfN-evoked IPSCs in PLTS interneurons.
(a) Schematic representing experimental paradigm for simultaneous activation of PfN and shutdown of THINs. (b) Responses of a typical THIN to injected current pulses. (c) 500 ms yellow light pulse evokes a strong inhibitory effect on this THIN in current clamp that is sufficient to prevent the THIN from spiking after optogenetic PfN stimulation (n=6). (d,f) Responses of two different typical PLTS interneurons to injected current pulses. (e,g) The PLTS interneurons exhibit depressing IPSCs to brief optogenetic stimulus trains to PfN terminals (black traces). When PfN stimulation is paired with optogenetic silencing of the THINs by HR3.0, the IPSCs induced by the thalamic stimulation are reduced (orange traces). (h) Graphs representing the reduction of the IPSC size after silencing the THINs. Black traces represent average responses in PLTS, where HR3.0 significantly affected the IPSC amplitude, red traces represent average responses in PLTS where HR3.0 failed to do so (n=9; P=0.0068, paired-sample t-test). Lower graph: box plots representing the minimum, maximum interquartile range, the mean and median of the same experiment as in the upper graph. (i) Box plots representing the paired-pulse ratio (PPR) of this experiment, where the amplitude of the second IPSC is divided by the amplitude of the first one. No significant differences have been measured after silencing the THINs with HR3.0 (paired t-test P=0.3239, n=8). (j) Schematic representing experimental paradigm for controlling the effect of yellow light on the IPSC size. In NPY-GFP mice, we measure the IPSC amplitude provoked by optogenetic stimulation of the PfN in the presence or absence of yellow light. (k) The PLTS interneurons exhibit IPSCs to brief optogenetic stimulus trains to PfN terminals (black traces). When PfN stimulation is paired with yellow light, the IPSCs induced by the thalamic stimulation are not affected (orange traces, n=7). (l) Line graphs (left) and box plots (right) quantifying the IPSC size in the presence or absence of yellow light. No significant effect was measured (n=7, P=0.7351 paired t-test).
Figure 9
Figure 9. THINs innervation of NPY-NGF and FSI.
(a) Schematic of the experimental paradigm for recording ChR2-expressing THINs in double transgenic TH Cre::NPY-GFP mice. (b) Responses of a typical THIN to injected current pulses. Middle and right panels show that brief blue light pulses evoke action potential firing in THINs. (c) Schematic of the experimental paradigm for recording NPY-NGF interneurons and optogenetically stimulating THINs. (df). Responses of typical NGF to injected current pulses. (d,g) Most NGF interneurons do not receive any input from THINs (upper panel: current clamp, lower panel: voltage clamp; Vh=−45 mV). (e,g). A very small proportion of NGF interneurons respond with a tiny (<4 pA) IPSC after optogenetic THINs stimulation. (f,g) A very small proportion of NGF receive an excitatory response after optogenetic THINs stimulation. (h) Schematic of the experimental paradigm for in recording FSI and activating PfN axons optogenetically. (i) Responses of typical FSIs to injected current pulses. (j) Optogenetic stimulation of the PfN induces a large excitatory response in recorded FSI that can induce action potential firing. (k) Schematic of the experimental paradigm for recording striatal in TH Cre mice and activating THINs optogenetically. (l, black trace) Most FSI do not respond to activation of THINS. THINs stimulation (voltage-clamp recording Vh=−45 mV; n=7/9, m). (l, blue trace) Example of an FSI receiving a very small inhibitory response after THINs optogenetic stimulation (voltage-clamp recording Vh=−45 mV; n=2/9, m).
Figure 10
Figure 10. Lesion of THINs induces impairment of the prepulse inhibition to an acoustic startle reflex.
(a) Confocal microscope pictures representing the Sham-injected animals (red, left panel, AAV5-EF1a-DIO-mCherry) and the TH-lesioned mice (green, right panels, AAV5-EF1a-DIO-DT-A-mCherry + AAV5-EF1a-DIO-ChR2-eYFP). In some cases Sham animals were injected with a different Cre-dependent-mCherry virus (see Methods). Note the drastic lesion of THINs with only a few cells remaining in the ventral striatum (right panels, green). scale bar, 1 mm (upper panels); scale bar, 150 μm (lower two panels). (b) Schematic illustrating the experiment paradigm. (c) Open-field tracking of a representative Sham animal (left, black) and TH-lesioned animal (right, red). (d,e) Box blox quantifying respectively the distance travelled and the average speed during 10 min in the open field showing no significant differences between the two groups (respectively P=0.6683 and P=0.7204; unpaired t-test, n=8 animals per group). (f) Schematic illustrating the habituation and prepulse inhibition paradigm. (g) Box blox quantifying the habituation score showing no significant differences between the two groups (P=0.6732, unpaired t-test n=8 Sham and n=11 TH-lesioned mice). (h) Box blox quantifying the prepulse inhibition of an acoustic startle stimulus after an 80 dB prepulse at two different interstimulus intervals (30 and 100 ms). The quantification shows a significant impairment of the prepulse inhibition in those conditions in TH-lesioned mice (P=0.0043 for the 30 ms interval and P=0.0357 for the 100 ms interval unpaired t-test, n=8 Sham and n=11 TH-lesioned).

Similar articles

Cited by

References

    1. Graybiel A. M., Aosaki T., Flaherty A. W. & Kimura M. The basal ganglia and adaptive motor control. Science 265, 1826–1831 (1994). - PubMed
    1. Grillner S., Hellgren J., Menard A., Saitoh K. & Wikstrom M. A. Mechanisms for selection of basic motor programs--roles for the striatum and pallidum. Trends Neurosci. 28, 364–370 (2005). - PubMed
    1. Buchwald N. A., Price D. D., Vernon L. & Hull C. D. Caudate intracellular response to thalamic and cortical inputs. Exp. Neurol. 38, 311–323 (1973). - PubMed
    1. Kemp J. M. & Powell T. P. The termination of fibres from the cerebral cortex and thalamus upon dendritic spines in the caudate nucleus: a study with the Golgi method. Philos. Trans. R. Soc. Lond. B Biol. Sci. 262, 429–439 (1971). - PubMed
    1. Smith Y., Raju D. V., Pare J. F. & Sidibe M. The thalamostriatal system: a highly specific network of the basal ganglia circuitry. Trends Neurosci. 27, 520–527 (2004). - PubMed

Publication types

LinkOut - more resources