. 2017 Aug;18(8):889-898.
doi: 10.1038/ni.3770. Epub 2017 Jun 12.

IgG Fc domains that bind C1q but not effector Fcγ receptors delineate the importance of complement-mediated effector functions

Affiliations

IgG Fc domains that bind C1q but not effector Fcγ receptors delineate the importance of complement-mediated effector functions

Chang-Han Lee et al. Nat Immunol. 2017 Aug.

Erratum in

Abstract

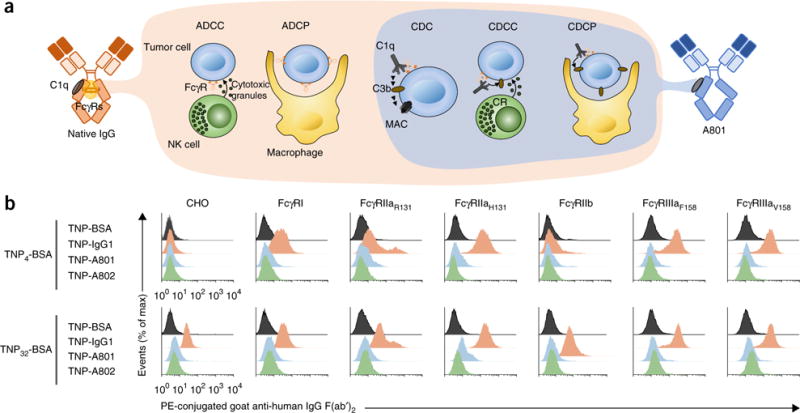
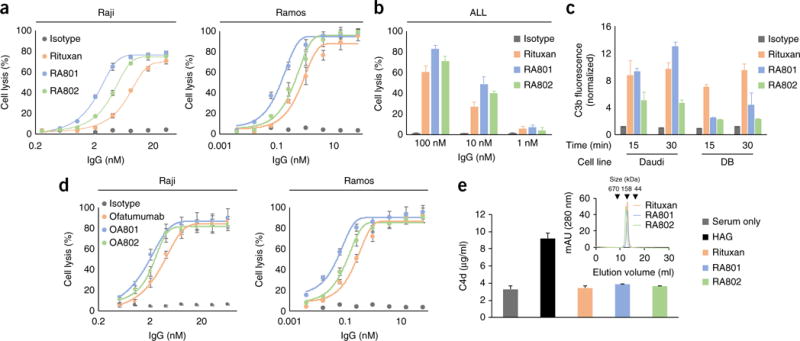
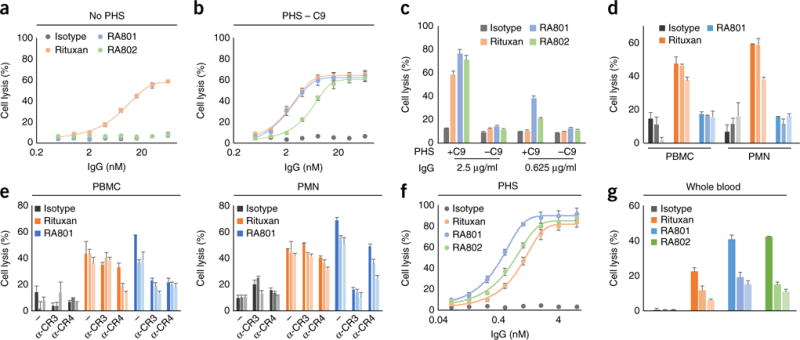
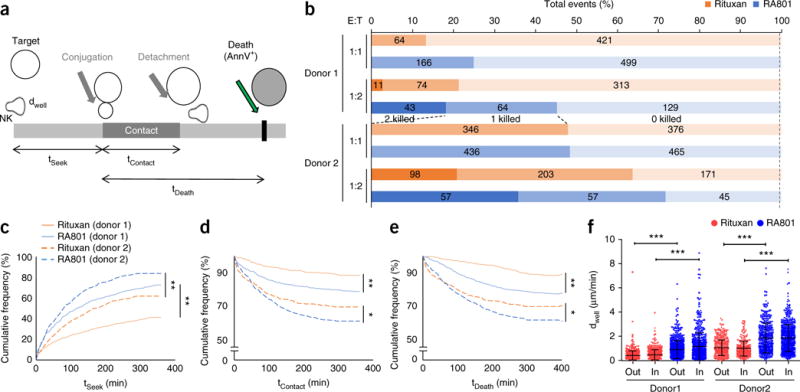
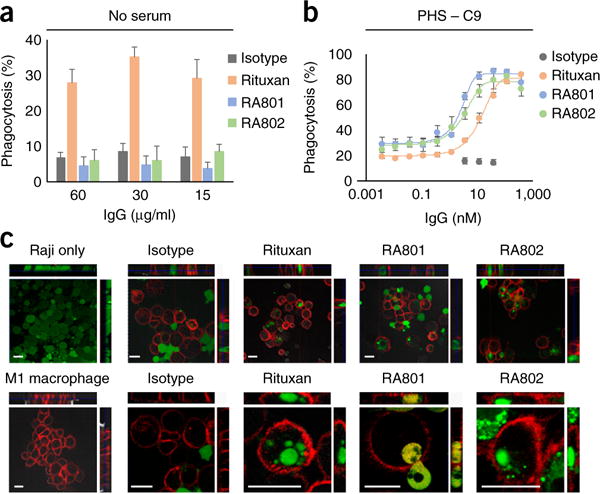
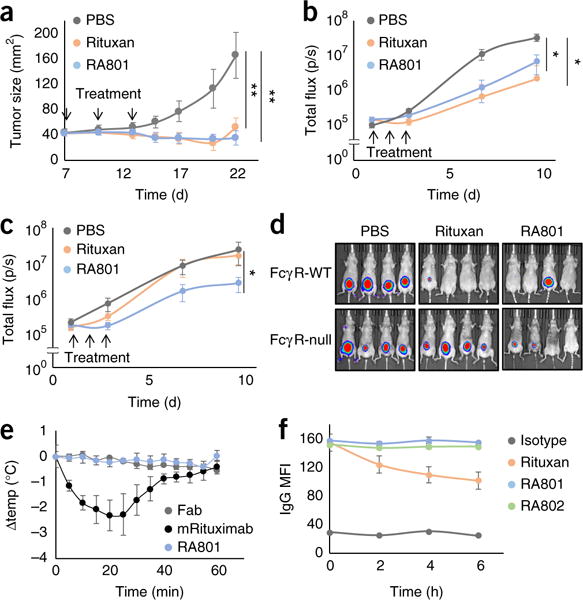
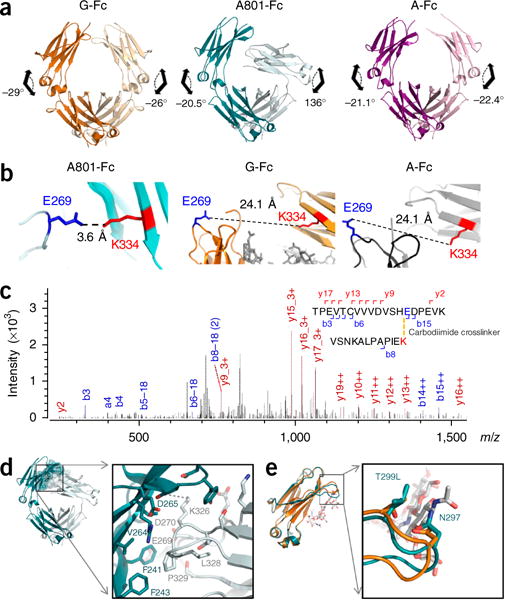
Engineered crystallizable fragment (Fc) regions of antibody domains, which assume a unique and unprecedented asymmetric structure within the homodimeric Fc polypeptide, enable completely selective binding to the complement component C1q and activation of complement via the classical pathway without any concomitant engagement of the Fcγ receptor (FcγR). We used the engineered Fc domains to demonstrate in vitro and in mouse models that for therapeutic antibodies, complement-dependent cell-mediated cytotoxicity (CDCC) and complement-dependent cell-mediated phagocytosis (CDCP) by immunological effector molecules mediated the clearance of target cells with kinetics and efficacy comparable to those of the FcγR-dependent effector functions that are much better studied, while they circumvented certain adverse reactions associated with FcγR engagement. Collectively, our data highlight the importance of CDCC and CDCP in monoclonal-antibody function and provide an experimental approach for delineating the effect of complement-dependent effector-cell engagement in various therapeutic settings.


Conflict of interest statement

COMPETING FINANCIAL INTERESTS

The authors declare competing financial interests: details are available in the online version of the paper.

Figures

Figure 1
Figure 1
Biochemical and functional properties of antibodies with engineered Fc domains that bind to C1q with exquisite selectivity. (a) Antibodymediated FcγR mechanisms for cell killing (left: ADCC and ADCP) and complement-dependent mechanisms for cell killing (right: CDC, CDCC and CDCP). MAC, membrane attack complex. (b) Binding of lowand high-density ICs (left margin) formed by IgG1, A801 or A802 conjugated to TNP4-BSA (top) or TNP32-BSA (bottom) on CHO cells expressing human FcγRs14. Data are from one experiment representative of three experiments.
Figure 2
Figure 2
In vitro complement activation by C1q-specific antibodies to CD20. (a,d) Lysis (by CDC) of CD20+ Raji cells (left) or Ramos cells (right) opsonized by various concentrations (horizontal axes) of Rituxan or its variants RA801 or RA802 (a) or ofatumumab or its variants OA801 or OA802 (d), or isotype-matched control antibody (Isotype), plus 25% pooled human serum, assessed 1 h after the addition of cells and antibody. (b) Lysis of patient-derived acute lymphocytic leukemia cells (ALL) opsonized by antibodies as in a (key), assessed as in a,d. (c) Deposition of C3b on CD20+ Daudi (left) or DB (right) human B cell lymphoma cells opsonized by culture for 15 or 30 min (horizontal axis) with antibodies as in a (key); results are presented relative to those of cells opsonized with isotype-matched control antibody (clinical-grade trastuzumab). (e) Generation of C4d by serum alone, heat-aggregated IgG (HAG; positive control) or antibodies (as in a) in solution (key); inset, size-exclusion fast protein liquid chromatography of Rituxan, RA801 and RA802 (key). Data are from one experiment representative of three experiments (error bars, s.d.).
Figure 3
Figure 3
Killing of CD20+ cells by CDCC. (a,b) Lysis of Raji tumor cells (opsonized by various concentrations (horizontal axes) of isotype-matched control antibody (as in Fig. 1d), Rituxan, RA801 or RA802 (key)) by PBMCs (as effector cells), at an effector cell/tumor cell ratio of 10:1, in RPMI1640 medium without pooled human serum (No PHS) (a) or supplemented with 25% pooled human serum depleted of C9 (PHS – C9) (b); results are presented relative to those obtained by incubation in SDS lysis buffer. (c) Lysis (by CDC) of Raji cells opsonized by various concentrations (horizontal axes) of IgG antibodies as in a (key), assessed in the presence of undepleted serum (+C9) or serum depleted of C9 (−C9). (d) Lysis of Raji cells (opsonized by 20 μg/ml, 4 μg/ml or 0.8 μg/ml (dark to light bar shading) of isotype-matched control antibody, Rituxan or RA801 (key)) by PBMCs or PMNs in RPMI-1640 medium supplemented with 25% serum depleted of C1q. (e) Lysis of Raji cells (opsonized by 4 μg/ml, 0.8 μg/ml or 0.16 μg/ml (shading as in d) of antibodies as in d (key)) by CDCC via PBMCs or PMNs (above plots) coated with no antibody (−) or 10 μg/ml of anti-CR3 (α-CR3) or anti-CR4 (α-CR4) (below plots), in RPMI-1640 medium supplemented with 25% serum depleted of C9. (f) Lysis of Raji cells (opsonized as in a) by PBMCs, in RPMI-1640 medium supplemented with 25% pooled human serum. (g) Lysis of Raji cells (opsonized with 10 μg/ml, 2.5 μg/ml or 0.6 μg/ml (shading as in d) of antibodies as in a (key)) by PBMCs, in RPMI-1640 medium supplemented with 25% pooled whole blood. Data are from one experiment representative of three experiments (ad,f,g) or two experiments (e) (error bars, s.d.).
Figure 4
Figure 4
Quantitative analysis of RA801-mediated CDCC. (a) Features of single-cell analysis of target-cell killing by TIMING33. AnnV, annexin V. (b) Frequency of the killing of Raji cells (target cells opsonized by Rituxan or RA801 (key)) by human NK cells (effector cells from two donors; far left), at various effector cell/target cell (E:T) ratios (left margin), in the presence of 25% serum depleted of C9, monitored by TIMING and presented as 0, 1 or 2 target cells killed (bar shading; middle of plot); numbers in bars indicate percent for each bar section. (ce) Kaplan-Meier curves of the time to establish stable conjugation (tSeek) (c), total duration of conjugation before tumor-cell apoptosis (tContact) (d) and time between first contact and tumor-cell apoptosis (tDeath) (e) for NK cells (from two donors; key) incubated with Raji tumor cells (at a ratio of 1:1) opsonized with Rituxan or RA801 (key). (f) Motility of NK cells (donor 1, >840 cells; donor 2, >400 cells) in the presence of Raji cells opsonized with Rituxan or RA801 (key), with cells at a ratio of 1:1, presented as displacement (dWell) between two time-lapse images (displacement out of contact and in contact with the target cell computed separately33). Each symbol represents an individual cell; small horizontal lines indicate the average (± s.d.). *P ≤ 0.05, **P ≤ 0.0001 and ***P ≤ 0.00001 (log-rank test (ce) or one-way analysis of variance test (f)). Data are from two independent experiments (n ͥ≥ 350 cells).
Figure 5
Figure 5
CDCP of CD20+ cells. (a,b) Phagocytosis of antibody-opsonized Raji cells (antibodies in key; concentration, horizontal axes) by monocytederived human M1-macrophages in RPMI-1640 medium without serum (a) or with serum depleted of C9 (b). (c) Fluorescence microscopy analyzing the phagocytosis of Raji cells, stained with the cell-permeant dye calcein-AM (green) by M1 macrophages, stained with anti-CD14 and anti-CD11b with allophycocyanin (red), showing Raji cells without macrophages (top left) or macrophages without Raji cells (bottom left), with opsonization by isotype-matched control antibody, Rituxan, RA801 or RA802 in the presence of serum depleted of C9 (top row, low magnification; bottom row, high magnification); top and right ‘strips’ show different views (xz and yz) of the same cells at a confocal plane. Scale bars, 20 μm. Data are from one experiment representative of three experiments (error bars (a,b), s.d. of technical triplicates).
Figure 6
Figure 6. In vivo
activity of RA801. (a) Growth of Ramos cell xenografts (1 × 10⁶ cells) implanted subcutaneously into nude mice (n = 9) treated (downward arrows) with PBS or 200 μg of Rituxan or RA801 (key) administered after palpable tumors had developed, at day 7, 10 and 13 after tumor implantation. **P < 0.0001, versus PBS treatment (Student’s t-test). (b,c) Growth of luciferase-expressing EL4-hCD20 cell xenografts (1 × 10⁵ cells) in NMRI-Foxn1−/− nude mice (FcγR-WT; n = 10 per group) (b) or NMRI-Foxn1−/− FcγR-null mice (n = 10 per group) (c) treated (upward arrows) with PBS or 100 μg of Rituxan or RA801 (key) administered on day s1, 2 and 3 after implantation; results are presented as tumor flux over time. *P < 0.01, versus PBS treatment (Mann-Whitney test). (d) Pseudocolor images of tumors from NMRIFoxn1−/− nude mice (FcγR-WT) and NMRI-Foxn1−/− FcγR-null nude mice (left margin) as in b,c, showing tumor intensity (high (red) to low (blue)) at day 10 after implantation. (e) Change in body temperature (Δtemp) in C57BL/6J mice (n = 3) at various times (horizontal axis) after intraperitoneal injection of 600 μg of heat-aggregated mouse Fab, IgG2aRituximab or RA801 (key). (f) Internalization of IgG into CD20+FcγRIIb+ Raji cells incubated for 0, 2, 4 or 6 h (horizontal axis) with 100 nM isotype-matched control antibody, Rituxan, RA801 or RA802 (key), assessed by flow cytometry and presented as the mean fluorescence intensity (MFI) of surface-bound IgG. Data are from one experiment representative of three independent experiments (a,e,f; error bars, s.d.) or are from two independent experiments (bd; error bars (b,c), s.d.).
Figure 7
Figure 7
Structural features of A801-Fc and G801-Fc. (a) Dihedral angles of Cγ2–Cγ3 in G-Fc (PDB accession code 3AVE; left; orange), A801-Fc (PDB accession code 5V43; middle; teal) and G801 Fc (PDB accession code 5V4E; right; purple). (b) Distance from Glu269 in chain B (E269) to Lys334 in chain A (K334) in the crystal structures of A801Fc (PDB accession code 5V43), G-Fc (PDB accession code 3AVE) and A-Fc (PDB accession code 3S7G). (c) Tandem mass spectrometry of tryptic fragments of A801-Fc after crosslinking with EDC. (d) The chain A (teal)–chain B (gray) interface of A801-Fc. (e) Overlaid Cγ2 domain and the C’E loop (arrow) of A801-Fc (teal) and G-Fc (orange) structures; white, glycan in PDB accession code 3AVE. Data are representative of three independent experiments.

Comment in

References

    1. Weiner GJ. Building better monoclonal antibody-based therapeutics. Nat Rev Cancer. 2015;15:361–370. - PMC - PubMed
    1. Nimmerjahn F, Ravetch JV. Translating basic mechanisms of IgG effector activity into next generation cancer therapies. Cancer Immun. 2012;12:13. - PMC - PubMed
    1. Pincetic A, et al. Type I and type II Fc receptors regulate innate and adaptive immunity. Nat Immunol. 2014;15:707–716. - PMC - PubMed
    1. Li FJ, et al. Emerging roles for the FCRL family members in lymphocyte biology and disease. Curr Top Microbiol Immunol. 2014;382:29–50. - PMC - PubMed
    1. van de Donk NWCJ, et al. Monoclonal antibodies targeting CD38 in hematological malignancies and beyond. Immunol Rev. 2016;270:95–112. - PMC - PubMed

MeSH terms