. 2017 Jul;49(7):1052-1060.
doi: 10.1038/ng.3889. Epub 2017 Jun 12.

DNMT and HDAC inhibitors induce cryptic transcription start sites encoded in long terminal repeats

Affiliations

DNMT and HDAC inhibitors induce cryptic transcription start sites encoded in long terminal repeats

David Brocks et al. Nat Genet. 2017 Jul.

Erratum in

  • Erratum: DNMT and HDAC inhibitors induce cryptic transcription start sites encoded in long terminal repeats.
    Brocks D, Schmidt CR, Daskalakis M, Jang HS, Shah NM, Li D, Li J, Zhang B, Hou Y, Laudato S, Lipka DB, Schott J, Bierhoff H, Assenov Y, Helf M, Ressnerova A, Islam MS, Lindroth AM, Haas S, Essers M, Imbusch CD, Brors B, Oehme I, Witt O, Lübbert M, Mallm JP, Rippe K, Will R, Weichenhan D, Stoecklin G, Gerhäuser C, Oakes CC, Wang T, Plass C. Brocks D, et al. Nat Genet. 2017 Oct 27;49(11):1661. doi: 10.1038/ng1117-1661c. Nat Genet. 2017. PMID: 29074949

Abstract

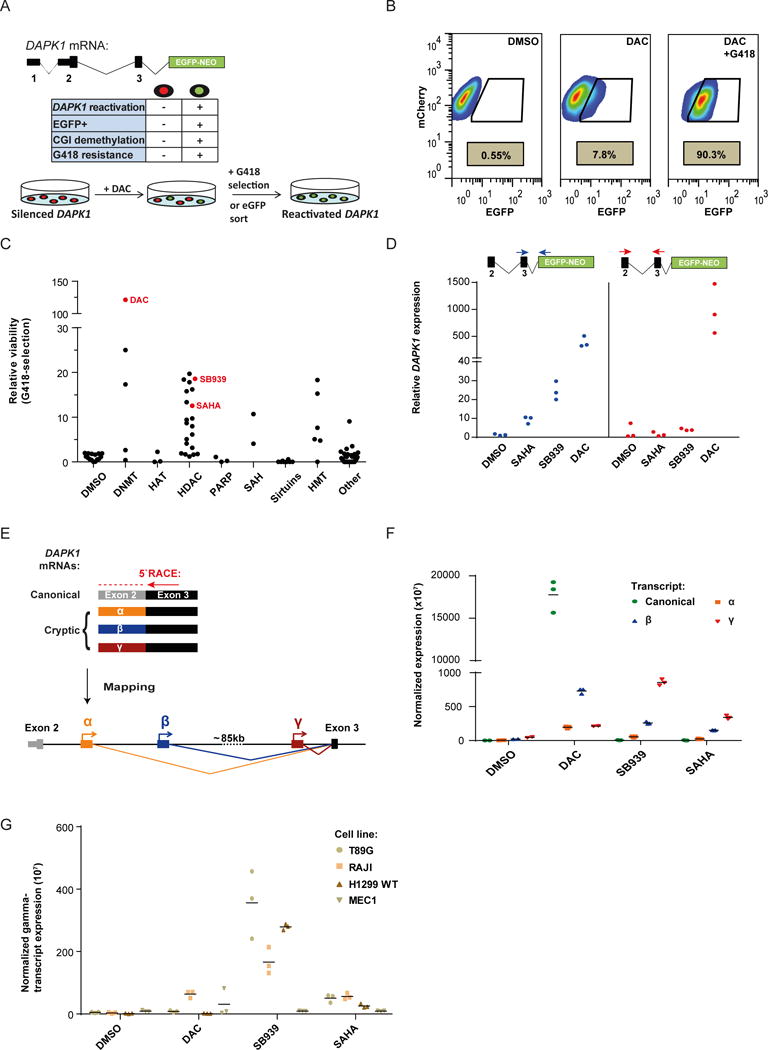
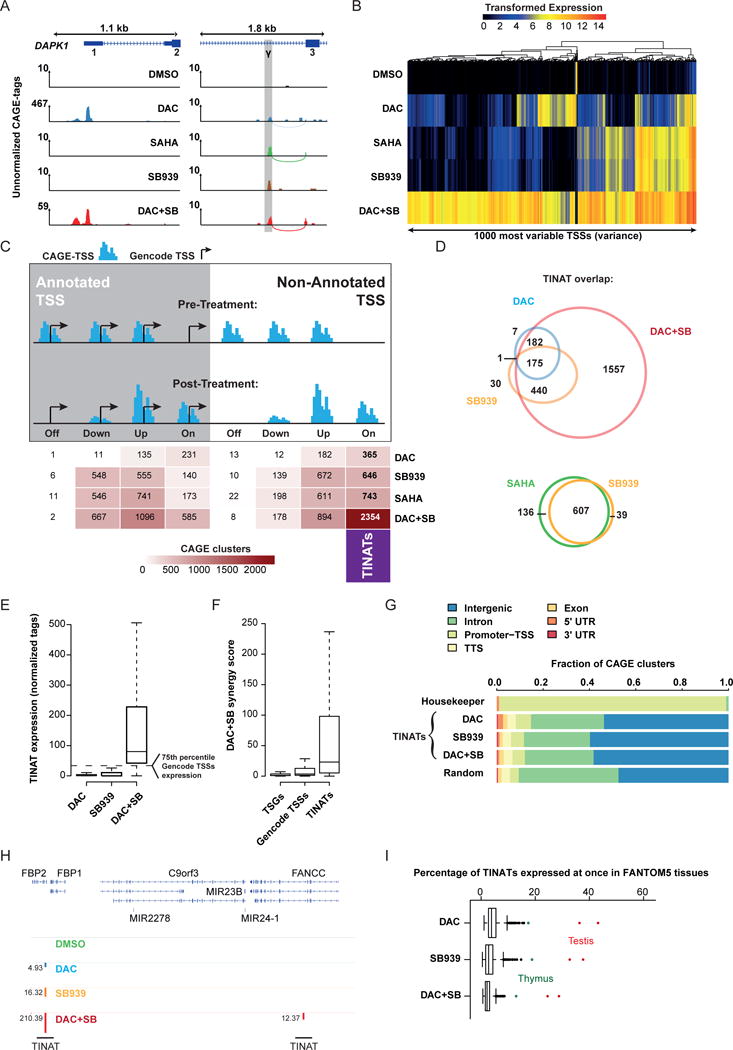
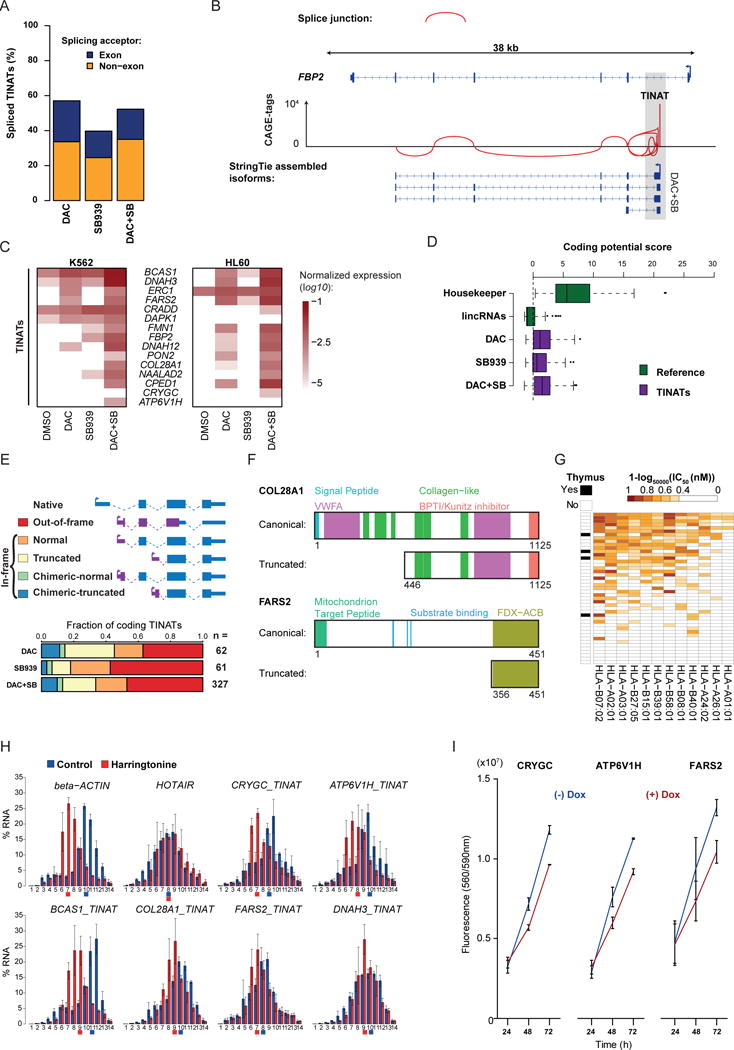
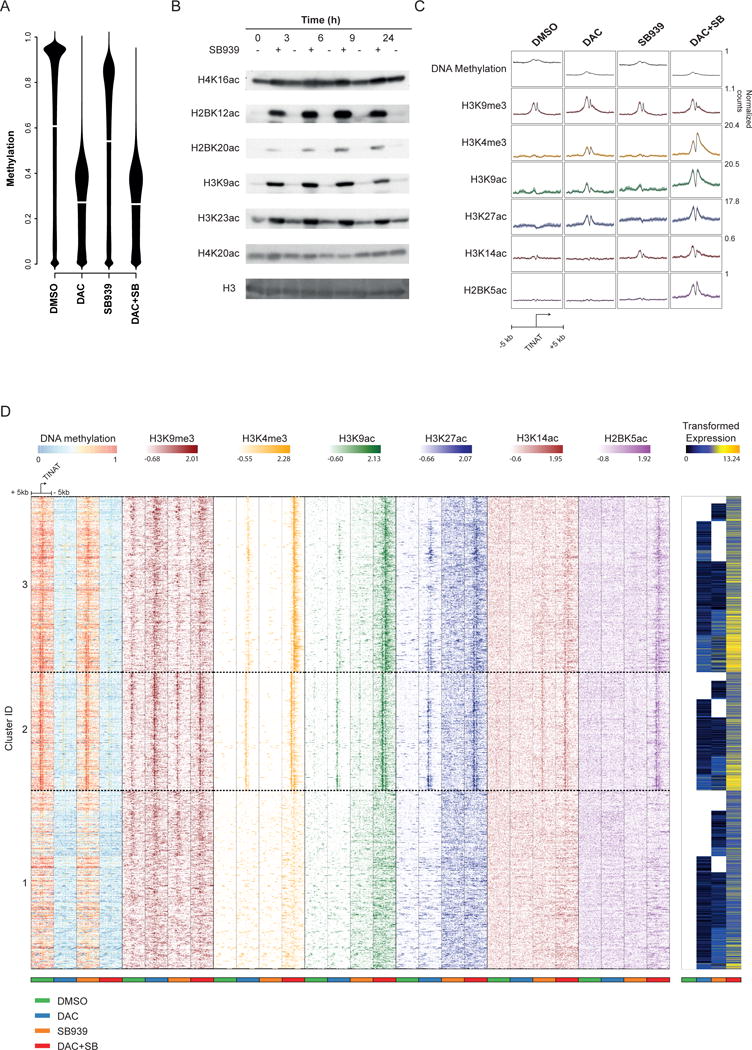
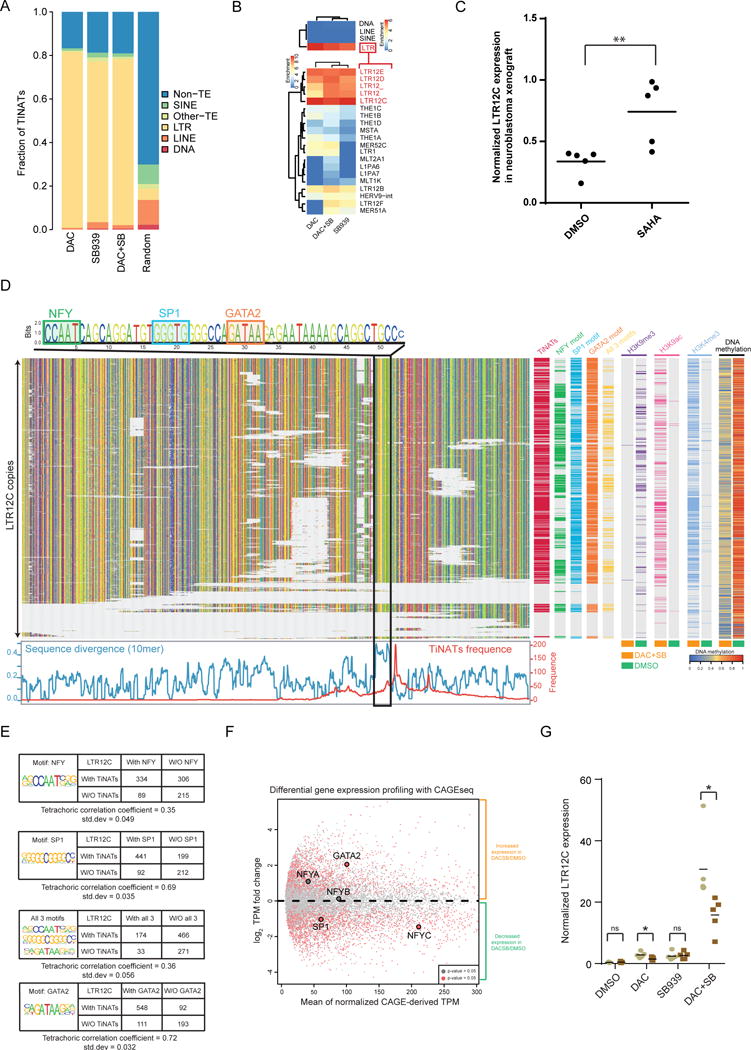
Several mechanisms of action have been proposed for DNA methyltransferase and histone deacetylase inhibitors (DNMTi and HDACi), primarily based on candidate-gene approaches. However, less is known about their genome-wide transcriptional and epigenomic consequences. By mapping global transcription start site (TSS) and chromatin dynamics, we observed the cryptic transcription of thousands of treatment-induced non-annotated TSSs (TINATs) following DNMTi and HDACi treatment. The resulting transcripts frequently splice into protein-coding exons and encode truncated or chimeric ORFs translated into products with predicted abnormal or immunogenic functions. TINAT transcription after DNMTi treatment coincided with DNA hypomethylation and gain of classical promoter histone marks, while HDACi specifically induced a subset of TINATs in association with H2AK9ac, H3K14ac, and H3K23ac. Despite this mechanistic difference, both inhibitors convergently induced transcription from identical sites, as we found TINATs to be encoded in solitary long terminal repeats of the ERV9/LTR12 family, which are epigenetically repressed in virtually all normal cells.


Conflict of interest statement

Competing Financial Interest

The authors declare no competing financial interests.

Figures

Figure 1
Figure 1. Novel DAPK1 intronic TSSs arise upon epigenetic drug treatment
a) A fluorescence/resistance marker was introduced into one allele of the DAPK1 locus epigenetically silenced in NCI-H1299 cells. Administration of the DNA demethylating agent DAC reactivates a subpopulation of cells (green coloring).The key characteristics of DAPK1 silenced (red) and reactivated (green) cells are shown in the central table. CGI = CpG island. b) FACS analysis showing the percentage of EGFP positive reporter cells before (left) and after DAC treatment with (right) or without (middle) additional G418 selection. c) NCI-H1299 reporter cell viability after epigenetic compound treatment and G418 selection relative to DMSO controls. Data is sorted by inhibitor class: DNMT=DNA methyltransferase; HAT=Histone acetyltransferase; HDAC=Histone deacetylase; PARP=Poly(ADP-ribose)-Polymerase; SAH=S-Adenosyl-L-homocysteine; SIRT=Sirtuins; HMT=Histone methyltransferase. d) DAPK1 expression after DNMTi and HDACi treatment of NCI-H1299 reporter cells relative to DMSO. qRT-PCR analysis was performed using primers located either in DAPK1 exon 2 and 3 (blue) or in exon 3 and the fluorescence/resistance marker (red). e) Three cryptic 5′ exons (α, β and γ) were identified by 5′RACE performed on RNA from HDACi treated cells. All cryptic transcripts spliced to the canonical DAPK1 exon 3. γ: chr9 90219272 -90219341; β: chr9 90134907 - 90135007; α: chr9 90125477 - 90125599 f) qRT-PCR expression analysis of canonical DAPK1 or cryptic transcripts(α, β, and γ) across treatments relative to housekeeping genes.Vertical line represents the mean from three independent experiments. g) Expression of the DAPK1 γ-transcript relative to housekeeping genes in untreated and treated cell lines. Vertical line represents the mean from three independent experiments.
Figure 2
Figure 2. CAGE-sequencing identifies genome-wide activation of non-annotated TSSs upon treatment
a) CAGE coverage at the canonical DAPK1 TSS (left panel) and the intronic γ-TSS (right panel, grey coloring). Curved lines indicate split-CAGE-tags. Numbers above vertical axis line denote the scale. b) Variance stabilized expression values of the 1000 most variable TSSs across treatment conditions. c) CAGE-clusters categorized into annotated (left panel) or non-annotated (right panel) peaks. CAGE-TSSs < 150 bp away from the nearest Gencode TSS were considered annotated. Silenced (Off), repressed (Down), induced (Up), and de novo transcribed (On) CAGE peaks were quantified and are shown in the table. TINATs are highlighted (right column). Arrow=Gencode TSS; blue bars=CAGE peak. d) TINAT overlap between DAC, SB939, and DAC+SB treatment (top) as well as SB939 and SAHA (bottom). TINATs were considered overlapping if expression was significantly different from DMSO control in more than one condition. e) Normalized DAC (blue), SB939 (orange), and DAC+SB (red) TINAT expression. f) Synergy score for TSSs associated with lung adenocarcinoma TSGs, de novo induced genes, and the union of TINATs. Synergy score was calculated as follows: expression DAC+SB/(expression DAC + expressionSB939). Data points beyond the extremes of the whiskers are not shown. g) Genomic distribution of CAGE-TSS. HOMER was used to annotate TINATs and housekeepers (100 least variable TSSs) to genomic features. TTS = transcription termination site; UTR = untranslated region. h) TINAT expression in the introns of the FBP2 and FANCC across treatments. Numbers next to the bar indicate normalized CAGE-tag counts. i) Percentage of simultaneously expressed TINATs in FANTOM5 samples.
Figure 3
Figure 3. TINAT-exon fusion transcripts encode novel protein isoforms with abnormal functions
a) Fraction of TINATs having > 1% split CAGE-seq reads b) Splice junctions at the FBP2 locus based on TINAT-derived CAGE-tags of DAC+SB treated NCI-H1299 cells. c) TINAT-exon fusion transcript expression in K562 (left) and HL60 (right) cells. The log10 of the mean expression from three independent experiments relative to housekeepers is shown. d) The coding potential of 100 housekeeping genes, 100 randomly selected ncRNAs, and TINATs was assessed using the coding potential calculator. Dashed line denotes the threshold for protein-coding transcripts. e) Schematic representation of the different scenarios for the translation of TINAT-exon fusion transcripts (upper panel). ORFs were categorized based on the criteria described in the online methods. The canonical (blue) and the novel, TINAT-derived sequence (purple) are schematically shown. Bottom panel depicts fraction of TINATs in each category. f) COL28A1 and FARS2 protein domains for the canonical and truncated isoform are illustrated. Numbers below proteins indicate amino acid positions. g) NetMHCpan was used to predict the binding affinity of 12 major HLA alleles (columns) for 45 DAC+SB chimeric peptide sequences (rows). The presence of a TINAT within the adult thymus is displayed. h) Distribution of beta-actin, HOTAIR, and five TINAT-exon fusion transcripts along polysome fractions. Colored squares below horizontal axis line indicate the fraction where half of the mRNAs have accumulated. i) Cell viability of NCI-H1299 reporter cells transduced with DOX-inducible TINAT-derived ORFs with or without DOX. Data from two independent experiments are shown.
Figure 4
Figure 4. DNMTi and HDACi use distinct mechanisms to activate TINATs
a) Beanplots showing the distribution of DNA methylation in untreated and treated NCI-H1299 cells based on whole-genome bisulfite-sequencing. b) Western blot analysis of post-translational modifications of histones extracted from NCI-H1299 cells at different time points following treatment with DMSO or SB939. Gel images were cropped and mirrored. Original blots are shown in Supplementary Fig. 6. c) ChIP-seq occupancy plots showing the average level of DNA methylation (grey), H3K9me3 (red), H3K4me3 (orange), H3K9ac (green), H3K27ac (blue), H3K14ac (brown), and H2BK5ac (purple) 5 kb up- and downstream of all identified TINATs. Colored areas indicate the 95% confidence interval and numbers indicate the normalized read counts. d) DNA methylation, H3K9me3 (red), H3K4me3 (orange), H3K9ac (green), H3K27ac (blue), H3K14ac (brown), and H2BK5ac (purple) levels around TINATs after DMSO (green bar), DAC (blue bar), SB939 (orange bar), or DAC+SB (red bar) treatment. Color intensity of the histone modifications represents Z-scores. Variance stabilized TINAT expression is shown to the right. TINATs were categorized into three groups using k-means clustering on the Z-scores of DNA methylation and histone modification levels relative to DMSO.
Figure 5
Figure 5. TINATs arise from long-terminal repeats especially of the LTR12 family
a) TINATs overlapping with transposable element (TE) classes. b) Cluster analysis of enrichment scores for TINATs across TE classes (top panel) and LTR families (bottom). c) qRT-PCR expression analysis of LTR12C copies relative to housekeepers in BE(2)-C neuroblastoma cells xenotransplanted into mice treated with DMSO or SAHA. Vertical lines represent the mean. d) Sequence alignment of LTR12C copies. G, A, T, C, nucleotides are colored by yellow, green, red, and blue, respectively (top left). TF motifs are highlighted. TINAT frequency and sequence divergence between LTR12C copies with and without TINATs is shown below. Right panel displays the presence of TINATs, TF motifs, histone modifications, and DNA methylation. e) Association between TINAT expression and the presence of NF-Y, SP1 and GATA2 motifs. Enrichment of SP1 and GATA2 sites in LTR12C with TINATs was significant (Pearson’s chi-squared test, P < 2.2e-16). f) Differential gene expression between DAC+SB and DMSO using CAGE peaks. NF-Y, Sp1, and GATA2 are highlighted. NF-Y transcription factor is a trimeric complex of NYFA, NFYB and NFYC. Genes with significant expression differences are labeled in red (t-test p-value < 0.05). g) Expression of LTR12C copies relative to housekeepers in the presence (brown) and absence (grey) of siRNAs targeting GATA2. Data from five independent experiments are shown. The mean from five independent experiments is shown.

Comment in

References

    1. Navada SC, Steinmann J, Lubbert M, Silverman LR. Clinical development of demethylating agents in hematology. The Journal of clinical investigation. 2014;124:40–46. doi: 10.1172/JCI69739. - DOI - PMC - PubMed
    1. West AC, Johnstone RW. New and emerging HDAC inhibitors for cancer treatment. The Journal of clinical investigation. 2014;124:30–39. doi: 10.1172/JCI69738. - DOI - PMC - PubMed
    1. Jones PA. At the tipping point for epigenetic therapies in cancer. The Journal of clinical investigation. 2014;124:14–16. doi: 10.1172/JCI74145. - DOI - PMC - PubMed
    1. Chiappinelli KB, et al. Inhibiting DNA Methylation Causes an Interferon Response in Cancer via dsRNA Including Endogenous Retroviruses. Cell. 2015;162:974–986. doi: 10.1016/j.cell.2015.07.011. - DOI - PMC - PubMed
    1. Roulois D, et al. DNA-Demethylating Agents Target Colorectal Cancer Cells by Inducing Viral Mimicry by Endogenous Transcripts. Cell. 2015;162:961–973. doi: 10.1016/j.cell.2015.07.056. - DOI - PMC - PubMed

MeSH terms