. 2017 Jun 12:8:15773.
doi: 10.1038/ncomms15773.

EMT cells increase breast cancer metastasis via paracrine GLI activation in neighbouring tumour cells

Affiliations

EMT cells increase breast cancer metastasis via paracrine GLI activation in neighbouring tumour cells

Deepika Neelakantan et al. Nat Commun. .

Erratum in

Abstract

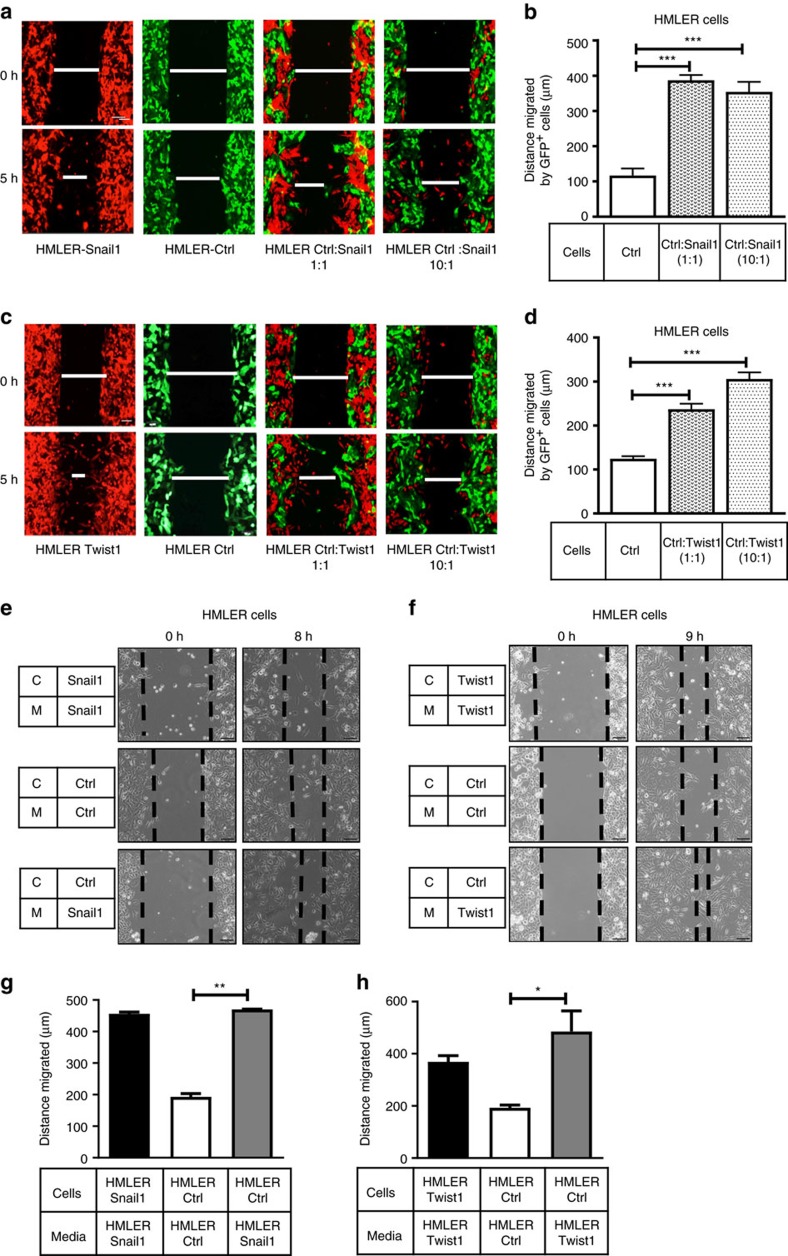
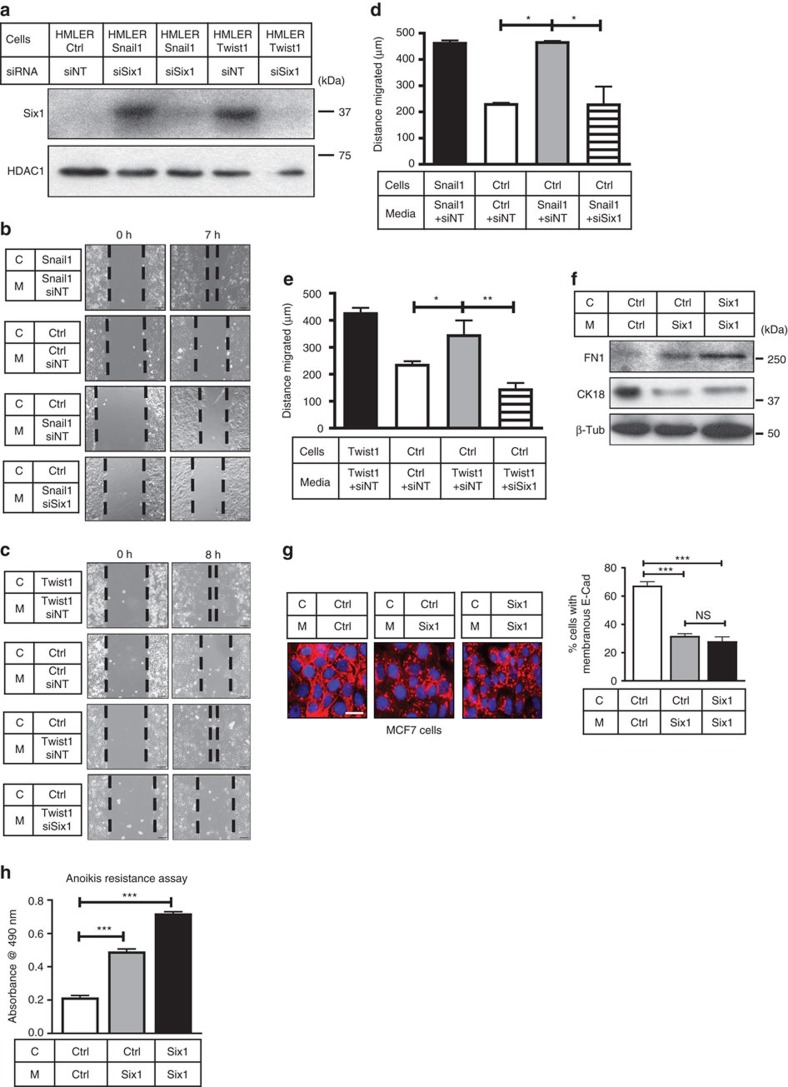
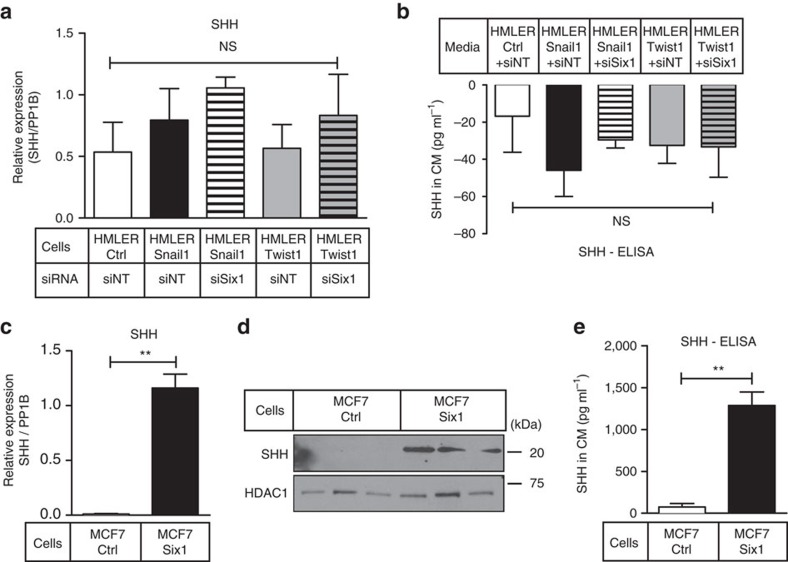
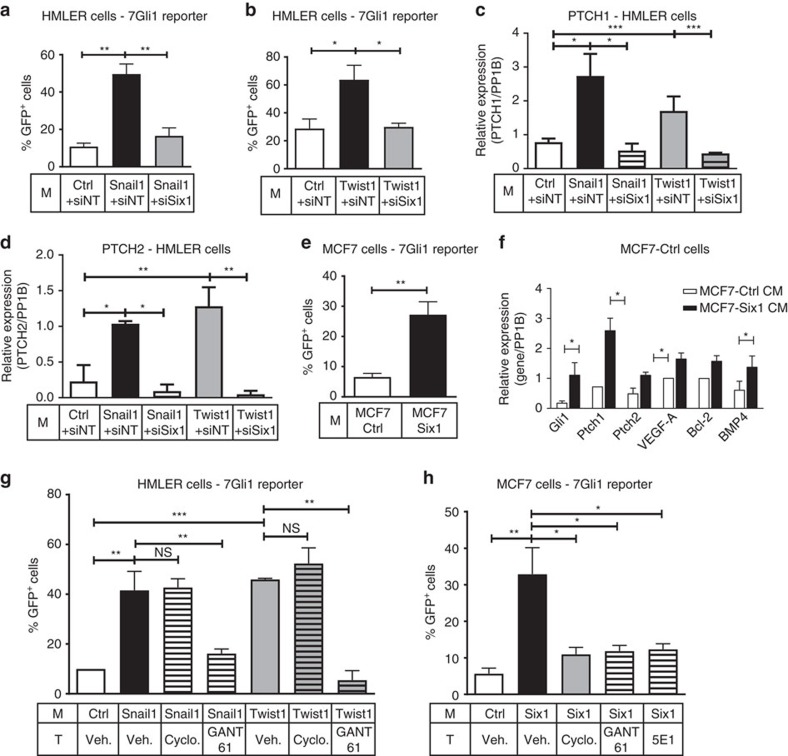
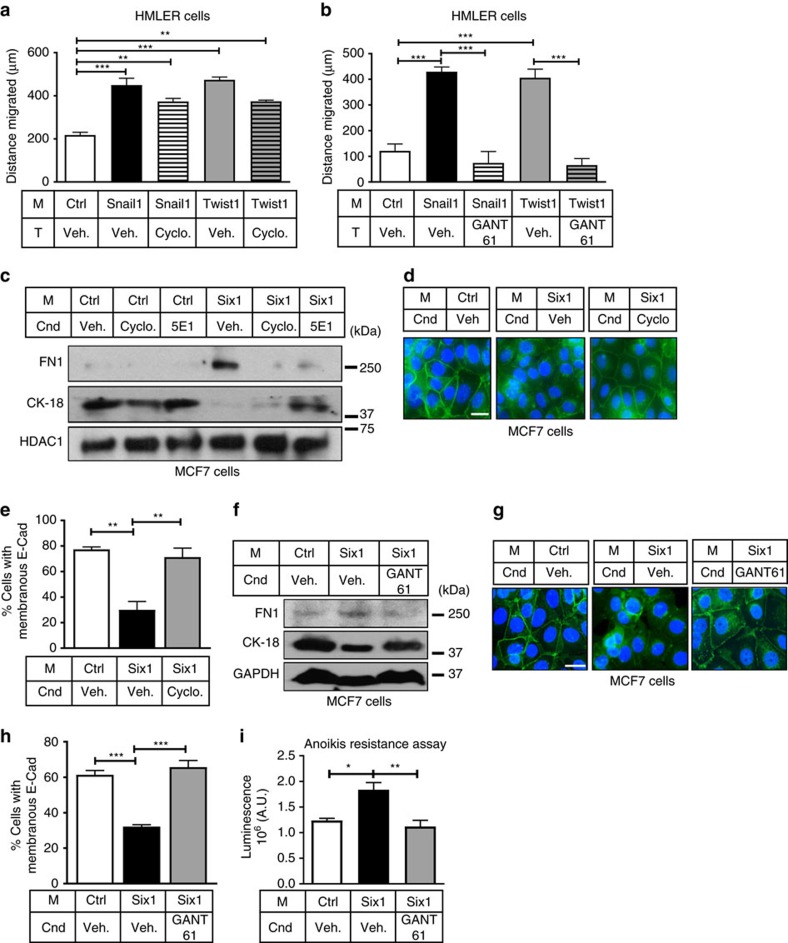
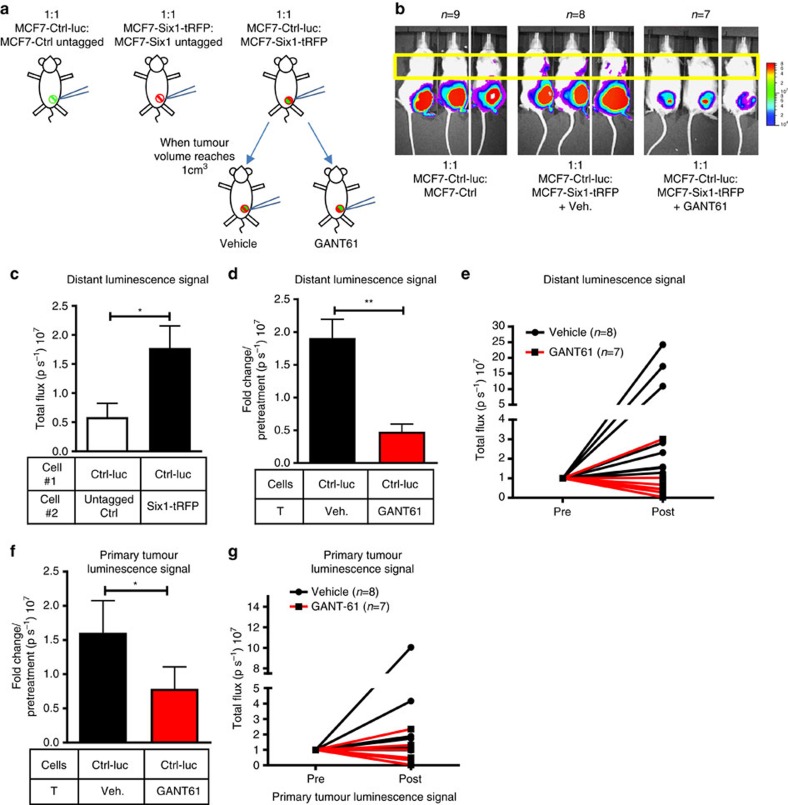
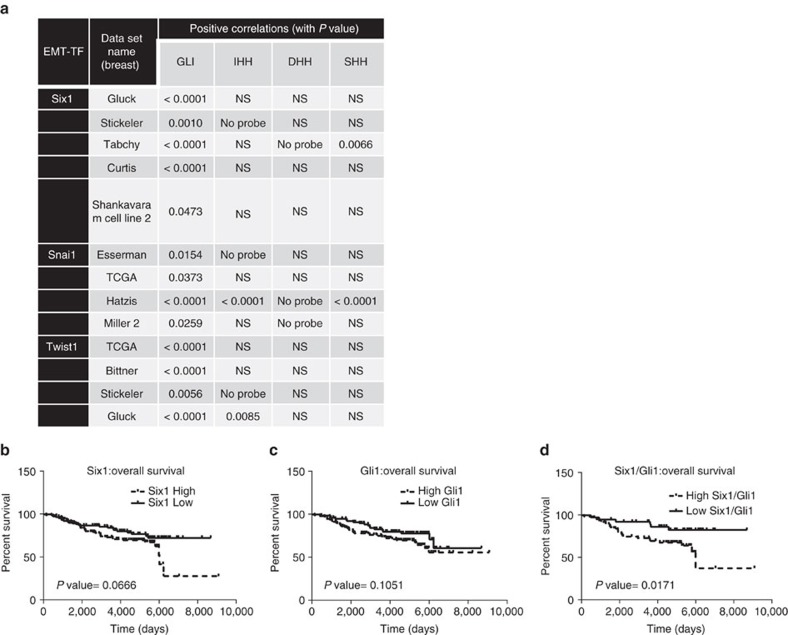
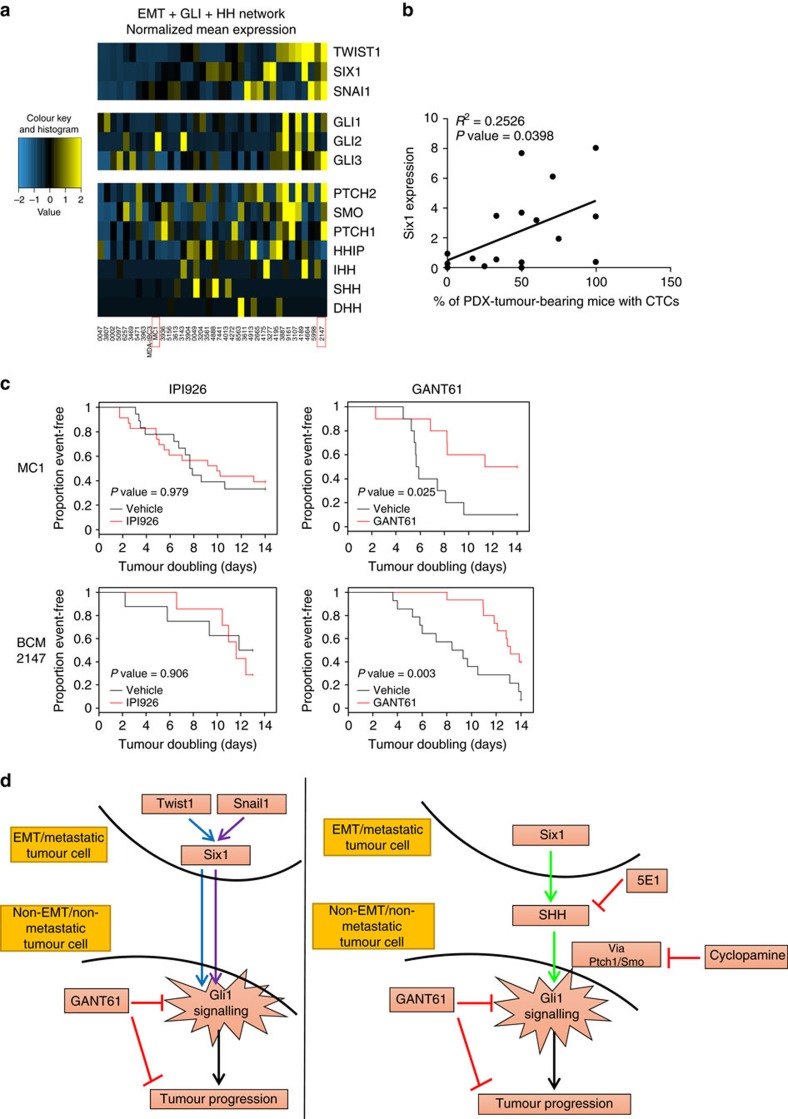
Recent fate-mapping studies concluded that EMT is not required for metastasis of carcinomas. Here we challenge this conclusion by showing that these studies failed to account for possible crosstalk between EMT and non-EMT cells that promotes dissemination of non-EMT cells. In breast cancer models, EMT cells induce increased metastasis of weakly metastatic, non-EMT tumour cells in a paracrine manner, in part by non-cell autonomous activation of the GLI transcription factor. Treatment with GANT61, a GLI1/2 inhibitor, but not with IPI 926, a Smoothened inhibitor, blocks this effect and inhibits growth in PDX models. In human breast tumours, the EMT-transcription factors strongly correlate with activated Hedgehog/GLI signalling but not with the Hh ligands. Our findings indicate that EMT contributes to metastasis via non-cell autonomous effects that activate the Hh pathway. Although all Hh inhibitors may act against tumours with canonical Hh/GLI signalling, only GLI inhibitors would act against non-canonical EMT-induced GLI activation.


Conflict of interest statement

M.T.L. is a manager in StemMed Holdings LP and a limited partner in StemMed Ltd. The remaining authors declare no competing financial interests.

Figures

Figure 1
Figure 1. Snail1 and Twist1 non-cell autonomously increase metastatic properties of control cells.
Five hour migration assay performed on (a,c) tRFP+ HMLER-Snail1/Twist1 cells alone, GFP+ HMLER-Ctrl cells alone, or a mixture of the two cell types at 1:1 or 10:1 ratio. (b,d) Quantification of GFP+ cell migration in a,c. (e,f) Representative 8–9 h migration assays of HMLER-Ctrl cells cultured in CM from (e) HMLER-Snail1 cells and (f) HMLER-Twist1 cells; C-cells, M-Media. (g,h) Quantification of cell migration in e,f. Scale bar, 100 μm, s.e.m. shown, n≥ 3. One-way ANOVA with Tukey's post test in all cases. *P<0.05, **P<0.01 and ***P<0.001.
Figure 2
Figure 2. Six1 is necessary (downstream of Snail1/Twist1) and sufficient to mediate NCA effects.
(a) Western blot analyses performed on WCLs from HMLER-Ctrl, HMLER-Snail1 and HMLER-Twist1 cells transfected with 150 nM of siSix1 or a non-targeting small interfering RNA (siRNA) pool (siNT). HDAC1, loading control. (b,c) Representative 7–8 h migration assay of HMLER-Ctrl cells in CM from HMLER-Snail1 or Twist1 cells ±siSix1. (d,e) Quantification of cell migration in b,c. (f) Western blot analyses performed on WCLs from MCF7-Ctrl and MCF7-Six1 cells cultured in indicated CM for 48 h. β-Tub, β-Tubulin, loading control; CK18, cytokeratin 18; FN1, fibronectin. (g) Representative ICC of E-Cad (red) in MCF7-Ctrl and Six1 cells cultured in indicated CM for 48 h (DAPI, blue). Quantification of % membranous E-Cad, n≥100; scale bar, 20 μm. (h) Representative anoikis resistance graph (plotted as absorbance as a measure of cell number) of MCF7-Ctrl or MCF7-Six1 cells cultured in indicated CM for 24 h. C-cells, M-Media; Scale bar, 100 μm, s.e.m. shown, n≥3, one-way ANOVA with Tukey's post test in all cases; NS, not significant; *P<0.05, **P<0.01 and ***P<0.001.
Figure 3
Figure 3. SHH is upregulated downstream of Six1 in specific contexts.
(a) Quantitative real-time PCR (qRT–PCR) analysis (on mRNA isolated from cells) and (b) ELISA analysis on CM from HMLER-Ctrl, Snail1 and Twist1 cells transfected with 150 nM of siSix1 or siNT. (c) qRT–PCR analysis on mRNA isolated from three different MCF7-Ctrl versus MCF7-Six1 clones (clones of same cell type combined) normalized to PP1B, (d) western blot analysis on WCLs using antibodies against SHH and HDAC1 as a loading control, (e) ELISA on CM from three different clones of MCF7-Ctrl and MCF7-Six1 cells (clones combined in e). s.e.m. shown, compiled experiments n≥3. One-way ANOVA with Tukey's post test for a,b and two-tailed unpaired t-test for c,e. NS, not significant; **P-value<0.01.
Figure 4
Figure 4. Hh/GLI signalling is activated canonically and non-canonically downstream of EMT-TFs.
7-Gli1 reporter assays performed in (a,b) HMLER-Ctrl cells treated with CM from HMLER-Ctrl cells or from HMLER-Snail1/Twist1 cells ±siSix1. (c,d) Quantitative real-time PCR (qRT–PCR) analyses of Hh pathway target genes in HMLER-Ctrl cells cultured in indicated CM. (e) 7-Gli1 reporter assays in MCF7-Ctrl cells cultured in MCF7-Ctrl or Six1 CM. (f) qRT–PCR analyses of Hh pathway target genes in MCF7-Ctrl cells cultured in indicated CM. (g,h) 7-Gli1 reporter assays of (g) HMLER cells cultured in CM from HMLER-Ctrl, Snail1 and Twist1 cells, and (h) MCF7-Ctrl cells cultured in MCF7-Ctrl/Six1 CM and treated with vehicle (Veh.), 10 μM cyclopamine, 10 μM GANT61, or 3–5 μg ml−1 of 5E1 monoclonal antibody. Gene expression is normalized to PP1B; all Gli1-GFP assays represented as %GFP+ cells. M, Media; T, Treatment; s.e.m. shown, n≥3, except for c,d,f using different sets of CM where n≥2. One-way ANOVA with Tukey's post test for (ad,g,h) and two tailed unpaired t-test for (e,f). NS, not significant; *P<0.05, **P<0.01 and ***P<0.001.
Figure 5
Figure 5. NCA activation of GLI is central downstream of EMT-TFs to alter phenotypes.
(a,b) Seven hour migration assays of HMLER-Ctrl cells cultured in HMLER-Snail1/Twist1 CM treated with (a) cyclopamine (Cyclo.) or (b) GANT61 or corresponding vehicle (Veh.) control. (c,f) Western blot analyses of WCLs from MCF7-Ctrl cells cultured in MCF7-Ctrl/Six1 CM for 48 h ±indicated inhibitors. HDAC1, GAPDH, loading controls. (d,g) Representative ICC of E-Cad (green) in MCF7-Ctrl cells cultured in MCF7-Ctrl/Six1 CM for 48 h ±indicated inhibitors. Scale bar, 20 μm; DAPI, blue (e,h) Quantification of % membranous E-Cad in d,g. Counts performed on ≥ 45–60 cells per condition. (i) Anoikis resistance assay in MCF7-Ctrl cells in indicated CM ±GANT61 for 24 h. Cnd, Condition; M, Media; T, Treatment; s.e.m. shown, n≥3, one-way ANOVA with Tukey's post test in all cases. *P<0.05, **P<0.01 and ***P<0.001.
Figure 6
Figure 6. GANT61 inhibits NCA increase in metastasis in vivo.
(a) Diagrammatic representation of the metastasis experiment. Female NOG/SCID mice were orthotopically injected in the fourth mammary fat pad with either MCF7-Ctrl-luc/MCF7-Ctrl-untagged (1:1) or MCF7-Six1-tRFP/MCF7-Six1-untagged cells (1:1) or co-injected with MCF7-Ctrl-luc and MCF7-Six1-tRFP cells (1:1). Mixed tumours were treated with 50 mg kg−1 of GANT61 or vehicle (Veh.) every other day for 18 days once tumour volume reached 1 cm3. (b) Representative bioluminescent imaging of mice (detecting ONLY the MCF7-Ctrl-luc cells) performed at similar tumour volumes for MCF7-Ctrl-luc and mixed injection groups ±GANT61 treatment. (c) Quantification of specifically the MCF7-Ctrl-luc signal (in lymph nodes/lungs, yellow boxed region in b) in MCF7-Ctrl-luc and mixed injection + vehicle treatment groups; represented as p s−1, photons per second. (d,f) Quantification of specifically the MCF7-Ctrl-luc signal from (d) distant sites and (f) primary tumour in mixed tumours groups +/− GANT61 treatment, represented as fold change over pre-treatment signal. (e,g) Normalized luminescent signal from (e) distant sites and (g) primary tumours of individual mice pre- and post treatment. T, Treatment; s.e.m. shown, two-tailed unpaired t-test for all cases, *P<0.05 and **P<0.01.
Figure 7
Figure 7. Expression of GLI1 and EMT-TFs positively correlate in human patients.
(a) Table demonstrating positive correlation between GLI1 mRNA and Six1, Snai1 and Twist1, but not between EMT-TF mRNA and Hh ligand mRNA, in multiple breast cancer datasets. Data obtained from Oncomine. (bd) High levels of both GLI1 and Six1 together significantly correlate with worsened prognosis; data obtained from GSE7390.
Figure 8
Figure 8. GANT61 but not IPI926 suppresses tumour growth in PDX models.
(a) Heat-map generated from RNA-seq analyses performed on PDX tumours (red boxes-PDX models treated with drugs). (b) Linear regression analysis performed on PDX tumours shows a positive correlation between Six1 mRNA expression and the percentage of PDX-tumour-bearing mice with circulating tumour cells (CTCs). (c) Kaplan–Meier curves depicting tumour doubling times for MC1 and BCM-2147 PDX models treated with IPI926 and GANT61. Comparisons between IPI926/GANT61 and vehicles were made using Wilcoxon test. (d) Graphical summary of paper which demonstrates that EMT-TFs can induce GLI activation in neighbouring cells not expressing the EMT-TFs, and that this activation can occur either via canonical or non-canonical means. In either case, the activation of GLI1 in neighbouring cells results in the attainment of aggressive properties, leading to tumour progression which can be inhibited by GANT61.

References

    1. Neelakantan D., Drasin D. J. & Ford H. L. Intratumoural heterogeneity: clonal cooperation in epithelial-to-mesenchymal transition and metastasis. Cell Adh. Migr. 9, 265–276 (2015). - PMC - PubMed
    1. McGranahan N. & Swanton C. Biological and therapeutic impact of intratumour heterogeneity in cancer evolution. Cancer Cell 27, 15–26 (2015). - PubMed
    1. Drasin D. J., Robin T. P. & Ford H. L. Breast cancer epithelial-to-mesenchymal transition: examining the functional consequences of plasticity. Breast Cancer Res. 13, 226 (2011). - PMC - PubMed
    1. Thiery J. P., Acloque H., Huang R. Y. & Nieto M. A. Epithelial-mesenchymal transitions in development and disease. Cell 139, 871–890 (2009). - PubMed
    1. Gunasinghe N. P., Wells A., Thompson E. W. & Hugo H. J. Mesenchymal-epithelial transition (MET) as a mechanism for metastatic colonisation in breast cancer. Cancer Metastasis Rev. 31, 469–478 (2012). - PubMed

Publication types