

Viral genetic variation accounts for a third of variability in HIV-1 set-point viral load in Europe
- PMID: 28604782
- PMCID: PMC5467800
- DOI: 10.1371/journal.pbio.2001855
Viral genetic variation accounts for a third of variability in HIV-1 set-point viral load in Europe
Erratum in
-
Correction: Viral genetic variation accounts for a third of variability in HIV-1 set-point viral load in Europe.PLoS Biol. 2017 Jul 13;15(7):e1002608. doi: 10.1371/journal.pbio.1002608. eCollection 2017 Jul. PLoS Biol. 2017. PMID: 28704367 Free PMC article.
Abstract
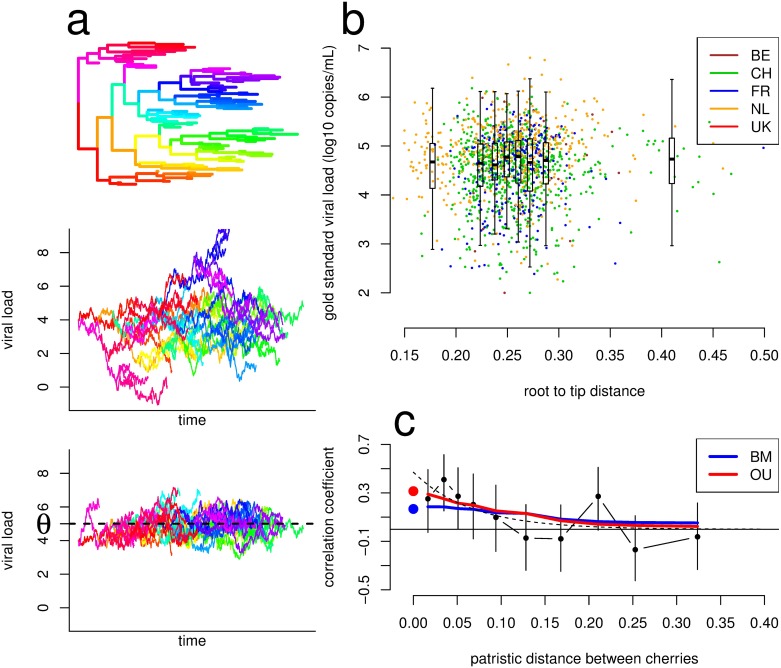
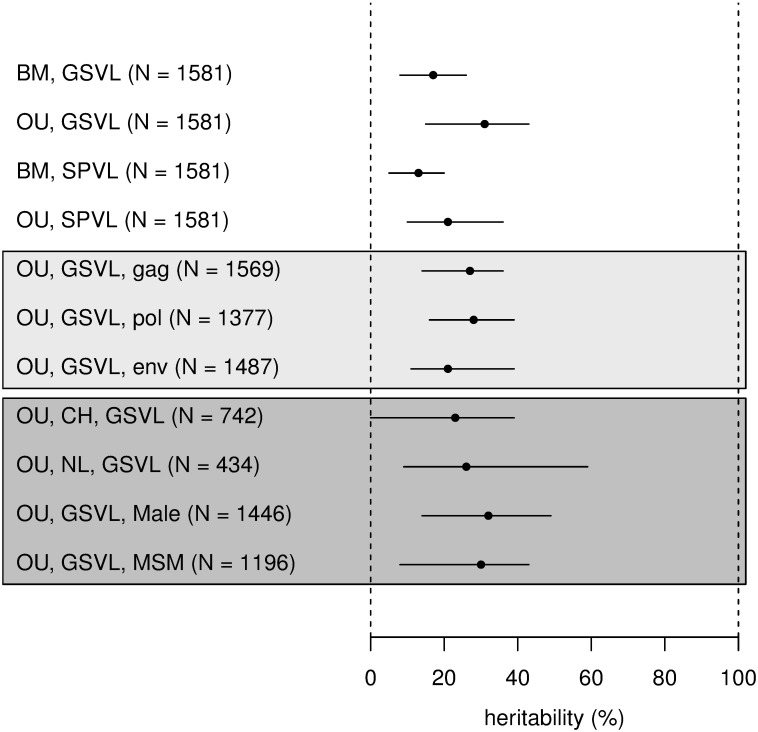
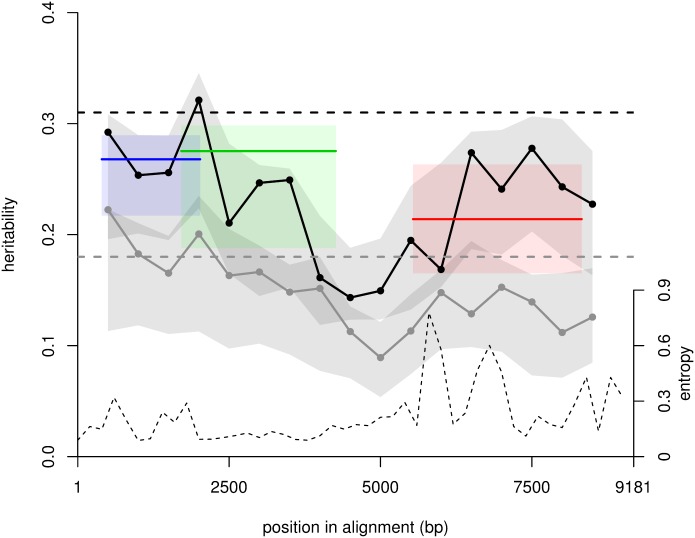
HIV-1 set-point viral load-the approximately stable value of viraemia in the first years of chronic infection-is a strong predictor of clinical outcome and is highly variable across infected individuals. To better understand HIV-1 pathogenesis and the evolution of the viral population, we must quantify the heritability of set-point viral load, which is the fraction of variation in this phenotype attributable to viral genetic variation. However, current estimates of heritability vary widely, from 6% to 59%. Here we used a dataset of 2,028 seroconverters infected between 1985 and 2013 from 5 European countries (Belgium, Switzerland, France, the Netherlands and the United Kingdom) and estimated the heritability of set-point viral load at 31% (CI 15%-43%). Specifically, heritability was measured using models of character evolution describing how viral load evolves on the phylogeny of whole-genome viral sequences. In contrast to previous studies, (i) we measured viral loads using standardized assays on a sample collected in a strict time window of 6 to 24 months after infection, from which the viral genome was also sequenced; (ii) we compared 2 models of character evolution, the classical "Brownian motion" model and another model ("Ornstein-Uhlenbeck") that includes stabilising selection on viral load; (iii) we controlled for covariates, including age and sex, which may inflate estimates of heritability; and (iv) we developed a goodness of fit test based on the correlation of viral loads in cherries of the phylogenetic tree, showing that both models of character evolution fit the data well. An overall heritability of 31% (CI 15%-43%) is consistent with other studies based on regression of viral load in donor-recipient pairs. Thus, about a third of variation in HIV-1 virulence is attributable to viral genetic variation.
Conflict of interest statement
I have read the journal's policy and the authors of this manuscript have the following competing interests. AJG participated in an advisory board meeting for ViiV Healthcare in July 2016. KP is a member of the Viiv ‘Dolutegravir' Advisory Board and Viiv ‘Data and Insights: Standardisation in Measuring and Collecting Care Continuum Data’ Advisory Board. HG reports receipt of grants from the Swiss National Science Foundation, Swiss HIV Cohort Study, University of Zurich, Yvonne Jacob Foundation, and Gilead Sciences; fees for data and safety monitoring board membership from Merck; consulting/advisory board membership fees from Gilead Sciences; and travel reimbursement from Gilead, Bristol-Myers Squibb, and Janssen. PR through his institution has received independent scientific grant support from Gilead Sciences, Janssen Pharmaceuticals Inc, Merck & Co, Bristol-Myers Squibb, and ViiV Healthcare; he has served on a scientific advisory board for Gilead Sciences and on a data safety monitoring committee for Janssen Pharmaceuticals Inc, for which his institution has received remuneration.
Figures
References
-
- Munoz A, Wang MC, Bass S, Taylor JM, Kingsley LA, Chmiel JS, et al. Acquired immunodeficiency syndrome (AIDS)-free time after human immunodeficiency virus type 1 (HIV-1) seroconversion in homosexual men. Multicenter AIDS Cohort Study Group. Am J Epidemiol. 1989;130(3):530–9. - PubMed
-
- Munoz A, Kirby AJ, He YD, Margolick JB, Visscher BR, Rinaldo CR, et al. Long-term survivors with HIV-1 infection: incubation period and longitudinal patterns of CD4+ lymphocytes. J Acquir Immune Defic Syndr Hum Retrovirology. 1995;8(5):496–505. - PubMed
-
- Collaborative Group on AIDS Incubation and HIV Survival, including the CASCADE EU Concerted Action. Time from HIV-1 seroconversion to AIDS and death before widespread use of highly-active antiretroviral therapy: a collaborative re-analysis. Lancet. 2000;355(9210):1131–7. - PubMed
-
- Morgan D, Mahe C, Mayanja B, Okongo JM, Lubega R, Whitworth JAG. HIV-1 infection in rural Africa: is there a difference in median time to AIDS and survival compared with that in industrialized countries? AIDS. 2002;16(4):597–603. - PubMed
Publication types
MeSH terms
Substances
Grants and funding
LinkOut - more resources
Full Text Sources
Other Literature Sources
Medical
