

Challenges in developing methods for quantifying the effects of weather and climate on water-associated diseases: A systematic review
- PMID: 28604791
- PMCID: PMC5481148
- DOI: 10.1371/journal.pntd.0005659
Challenges in developing methods for quantifying the effects of weather and climate on water-associated diseases: A systematic review
Abstract
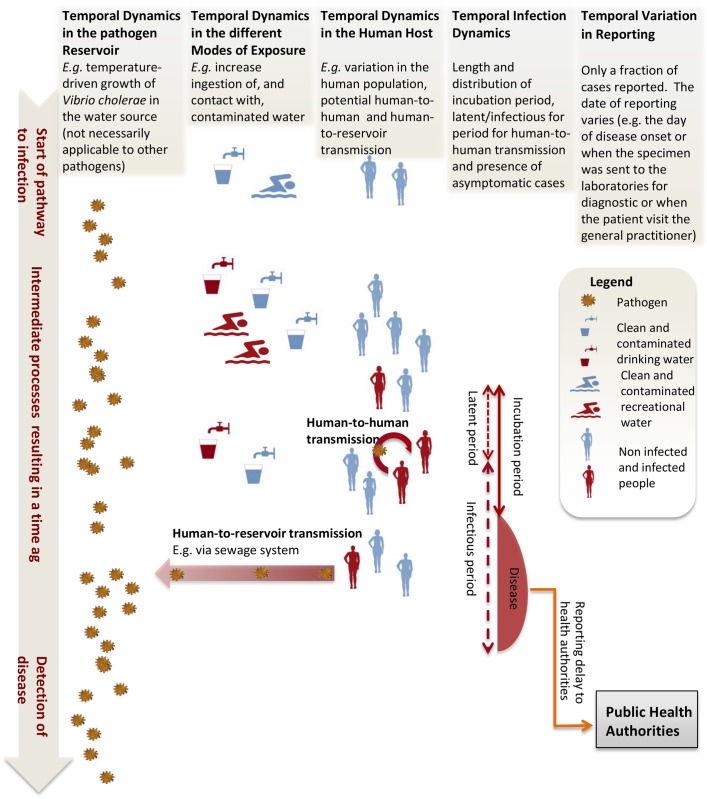
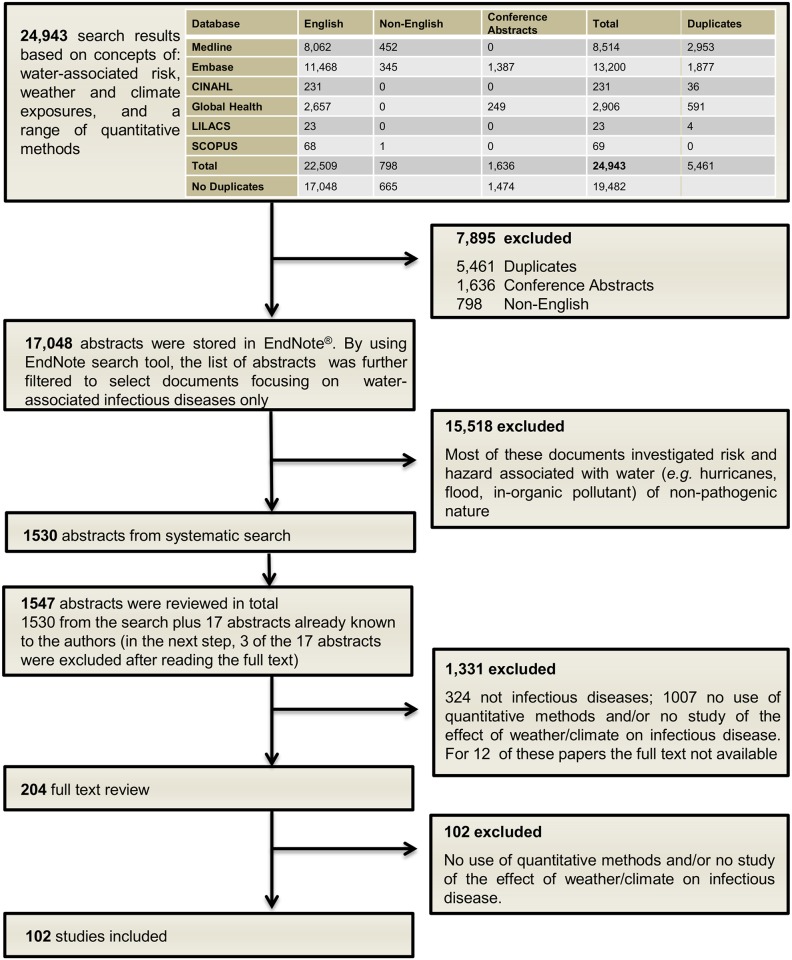
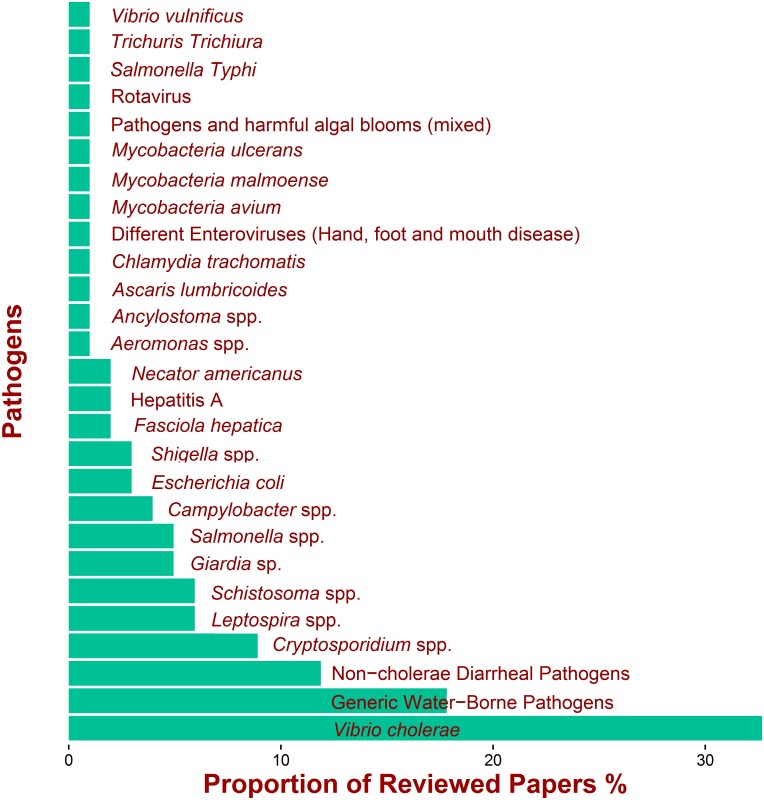
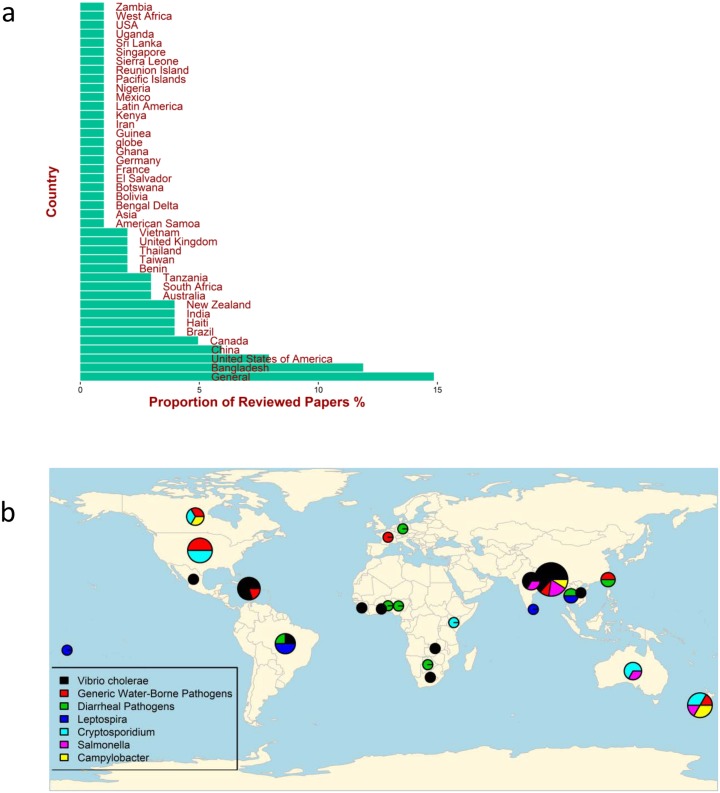
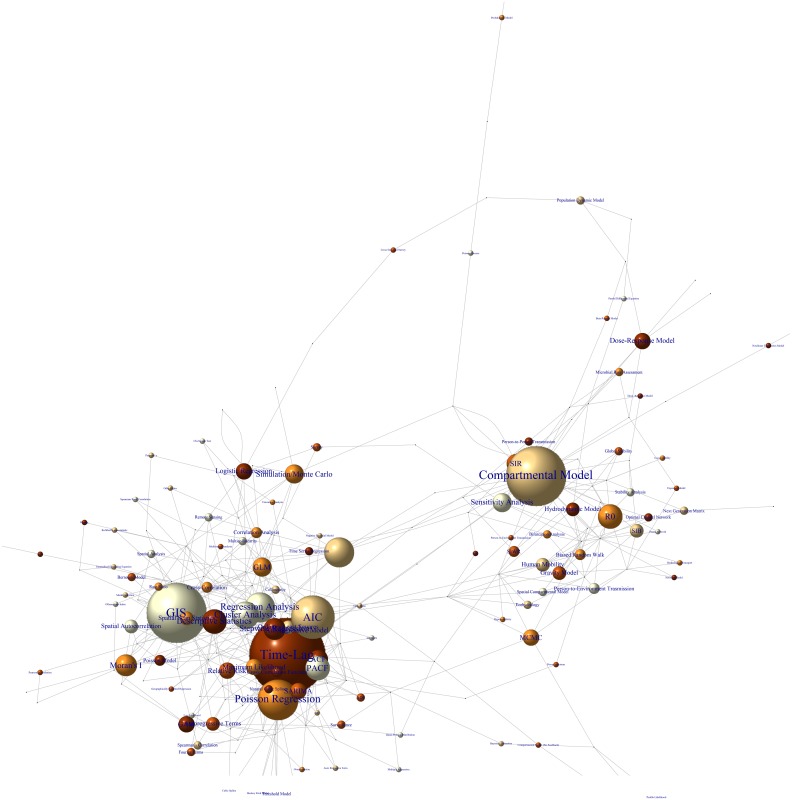
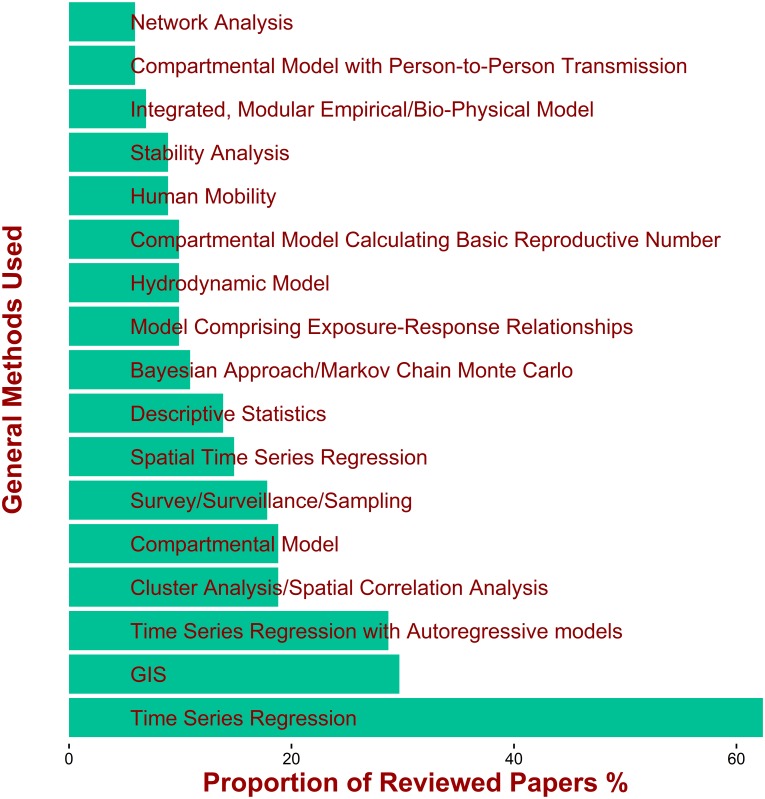
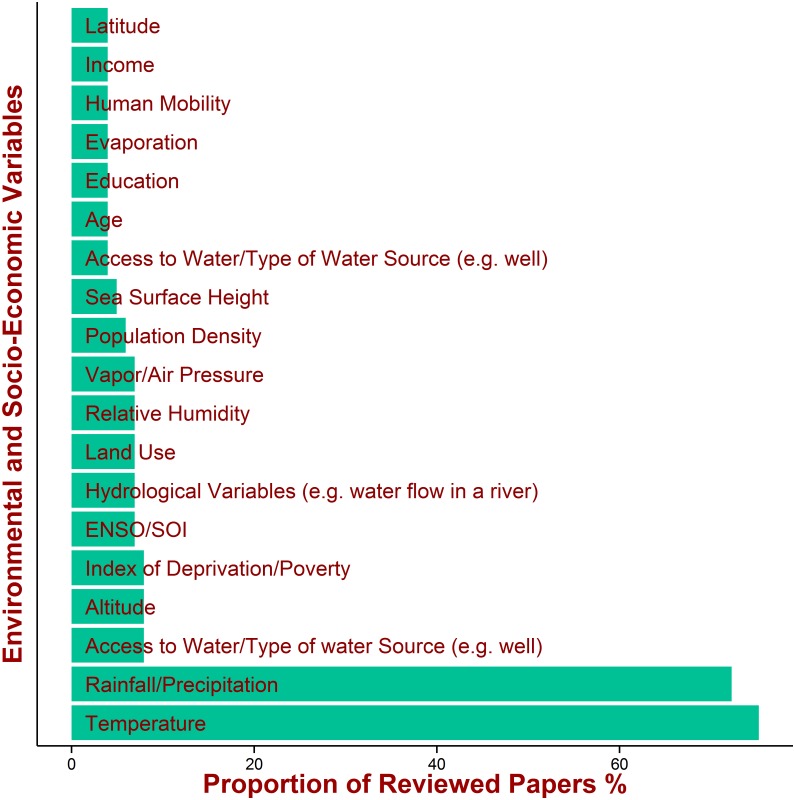
Infectious diseases attributable to unsafe water supply, sanitation and hygiene (e.g. Cholera, Leptospirosis, Giardiasis) remain an important cause of morbidity and mortality, especially in low-income countries. Climate and weather factors are known to affect the transmission and distribution of infectious diseases and statistical and mathematical modelling are continuously developing to investigate the impact of weather and climate on water-associated diseases. There have been little critical analyses of the methodological approaches. Our objective is to review and summarize statistical and modelling methods used to investigate the effects of weather and climate on infectious diseases associated with water, in order to identify limitations and knowledge gaps in developing of new methods. We conducted a systematic review of English-language papers published from 2000 to 2015. Search terms included concepts related to water-associated diseases, weather and climate, statistical, epidemiological and modelling methods. We found 102 full text papers that met our criteria and were included in the analysis. The most commonly used methods were grouped in two clusters: process-based models (PBM) and time series and spatial epidemiology (TS-SE). In general, PBM methods were employed when the bio-physical mechanism of the pathogen under study was relatively well known (e.g. Vibrio cholerae); TS-SE tended to be used when the specific environmental mechanisms were unclear (e.g. Campylobacter). Important data and methodological challenges emerged, with implications for surveillance and control of water-associated infections. The most common limitations comprised: non-inclusion of key factors (e.g. biological mechanism, demographic heterogeneity, human behavior), reporting bias, poor data quality, and collinearity in exposures. Furthermore, the methods often did not distinguish among the multiple sources of time-lags (e.g. patient physiology, reporting bias, healthcare access) between environmental drivers/exposures and disease detection. Key areas of future research include: disentangling the complex effects of weather/climate on each exposure-health outcome pathway (e.g. person-to-person vs environment-to-person), and linking weather data to individual cases longitudinally.
Conflict of interest statement
The authors have declared that no competing interests exist.
Figures
References
-
- Mellor JE, Levy K, Zimmerman J, Elliott M, Bartram J, Carlton E, et al. Planning for climate change: The need for mechanistic systems-based approaches to study climate change impacts on diarrheal diseases. Sci Total Environ. Elsevier B.V.; 2016;548–549: 82–90. doi: 10.1016/j.scitotenv.2015.12.087 - DOI - PMC - PubMed
-
- World Health Organization. Neglected Tropical Diseases [Internet]. 2017 [cited 3 Apr 2017]. http://www.who.int/neglected_diseases/diseases/en/
-
- CDC. Which diseases are considered Neglected Tropical Diseases? [Internet]. [cited 3 Apr 2017]. https://www.cdc.gov/globalhealth/ntd/diseases/index.html
-
- PLOS Neglected Tropical Diseases. Journal Information [Internet]. [cited 3 Apr 2017]. http://journals.plos.org/plosntds/s/journal-information
-
- Bain R, Cronk R, Hossain R, Bonjour S, Onda K, Wright J, et al. Global assessment of exposure to faecal contamination through drinking water based on a systematic review. Trop Med Int Heal. 2014;19: 917–927. doi: 10.1111/tmi.12334 - DOI - PMC - PubMed
Publication types
MeSH terms
Grants and funding
LinkOut - more resources
Full Text Sources
Other Literature Sources
Medical
Miscellaneous
