. 2017 Jul 11;33(27):6647-6656.
doi: 10.1021/acs.langmuir.7b00414. Epub 2017 Jun 27.

Graphite-Templated Amyloid Nanostructures Formed by a Potential Pentapeptide Inhibitor for Alzheimer's Disease: A Combined Study of Real-Time Atomic Force Microscopy and Molecular Dynamics Simulations

Affiliations

Graphite-Templated Amyloid Nanostructures Formed by a Potential Pentapeptide Inhibitor for Alzheimer's Disease: A Combined Study of Real-Time Atomic Force Microscopy and Molecular Dynamics Simulations

Na Li et al. Langmuir. .

Abstract

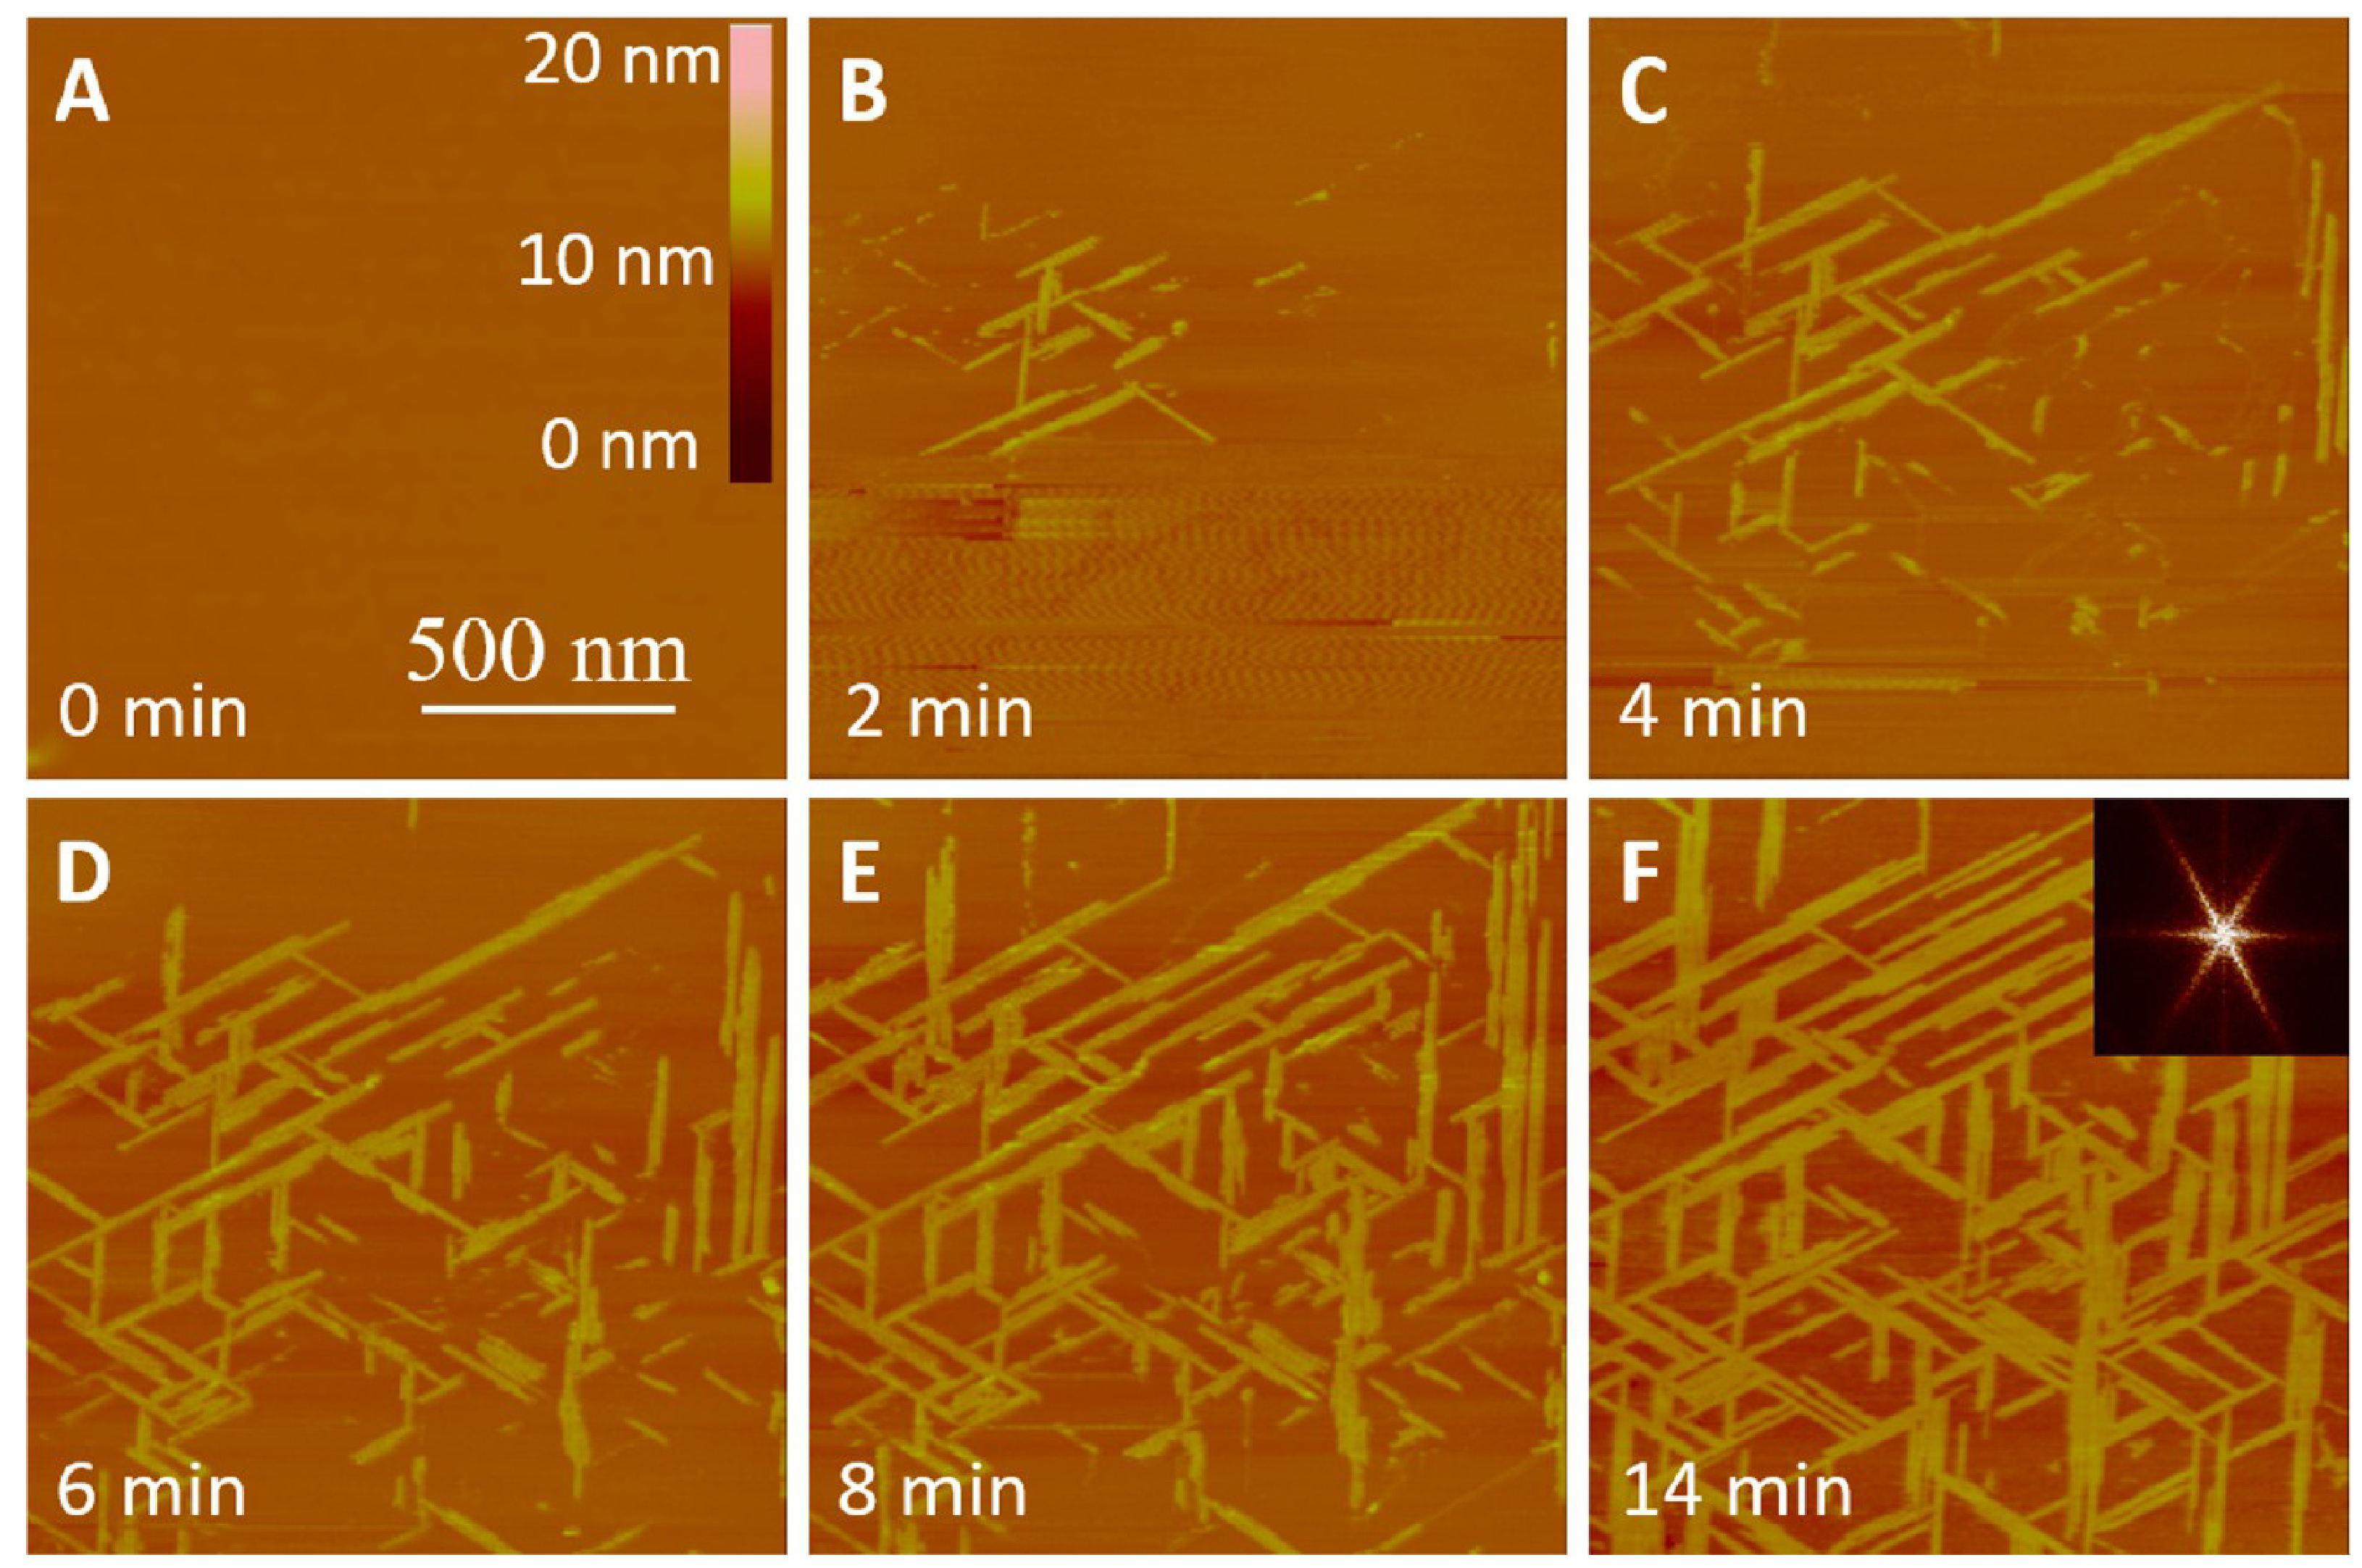
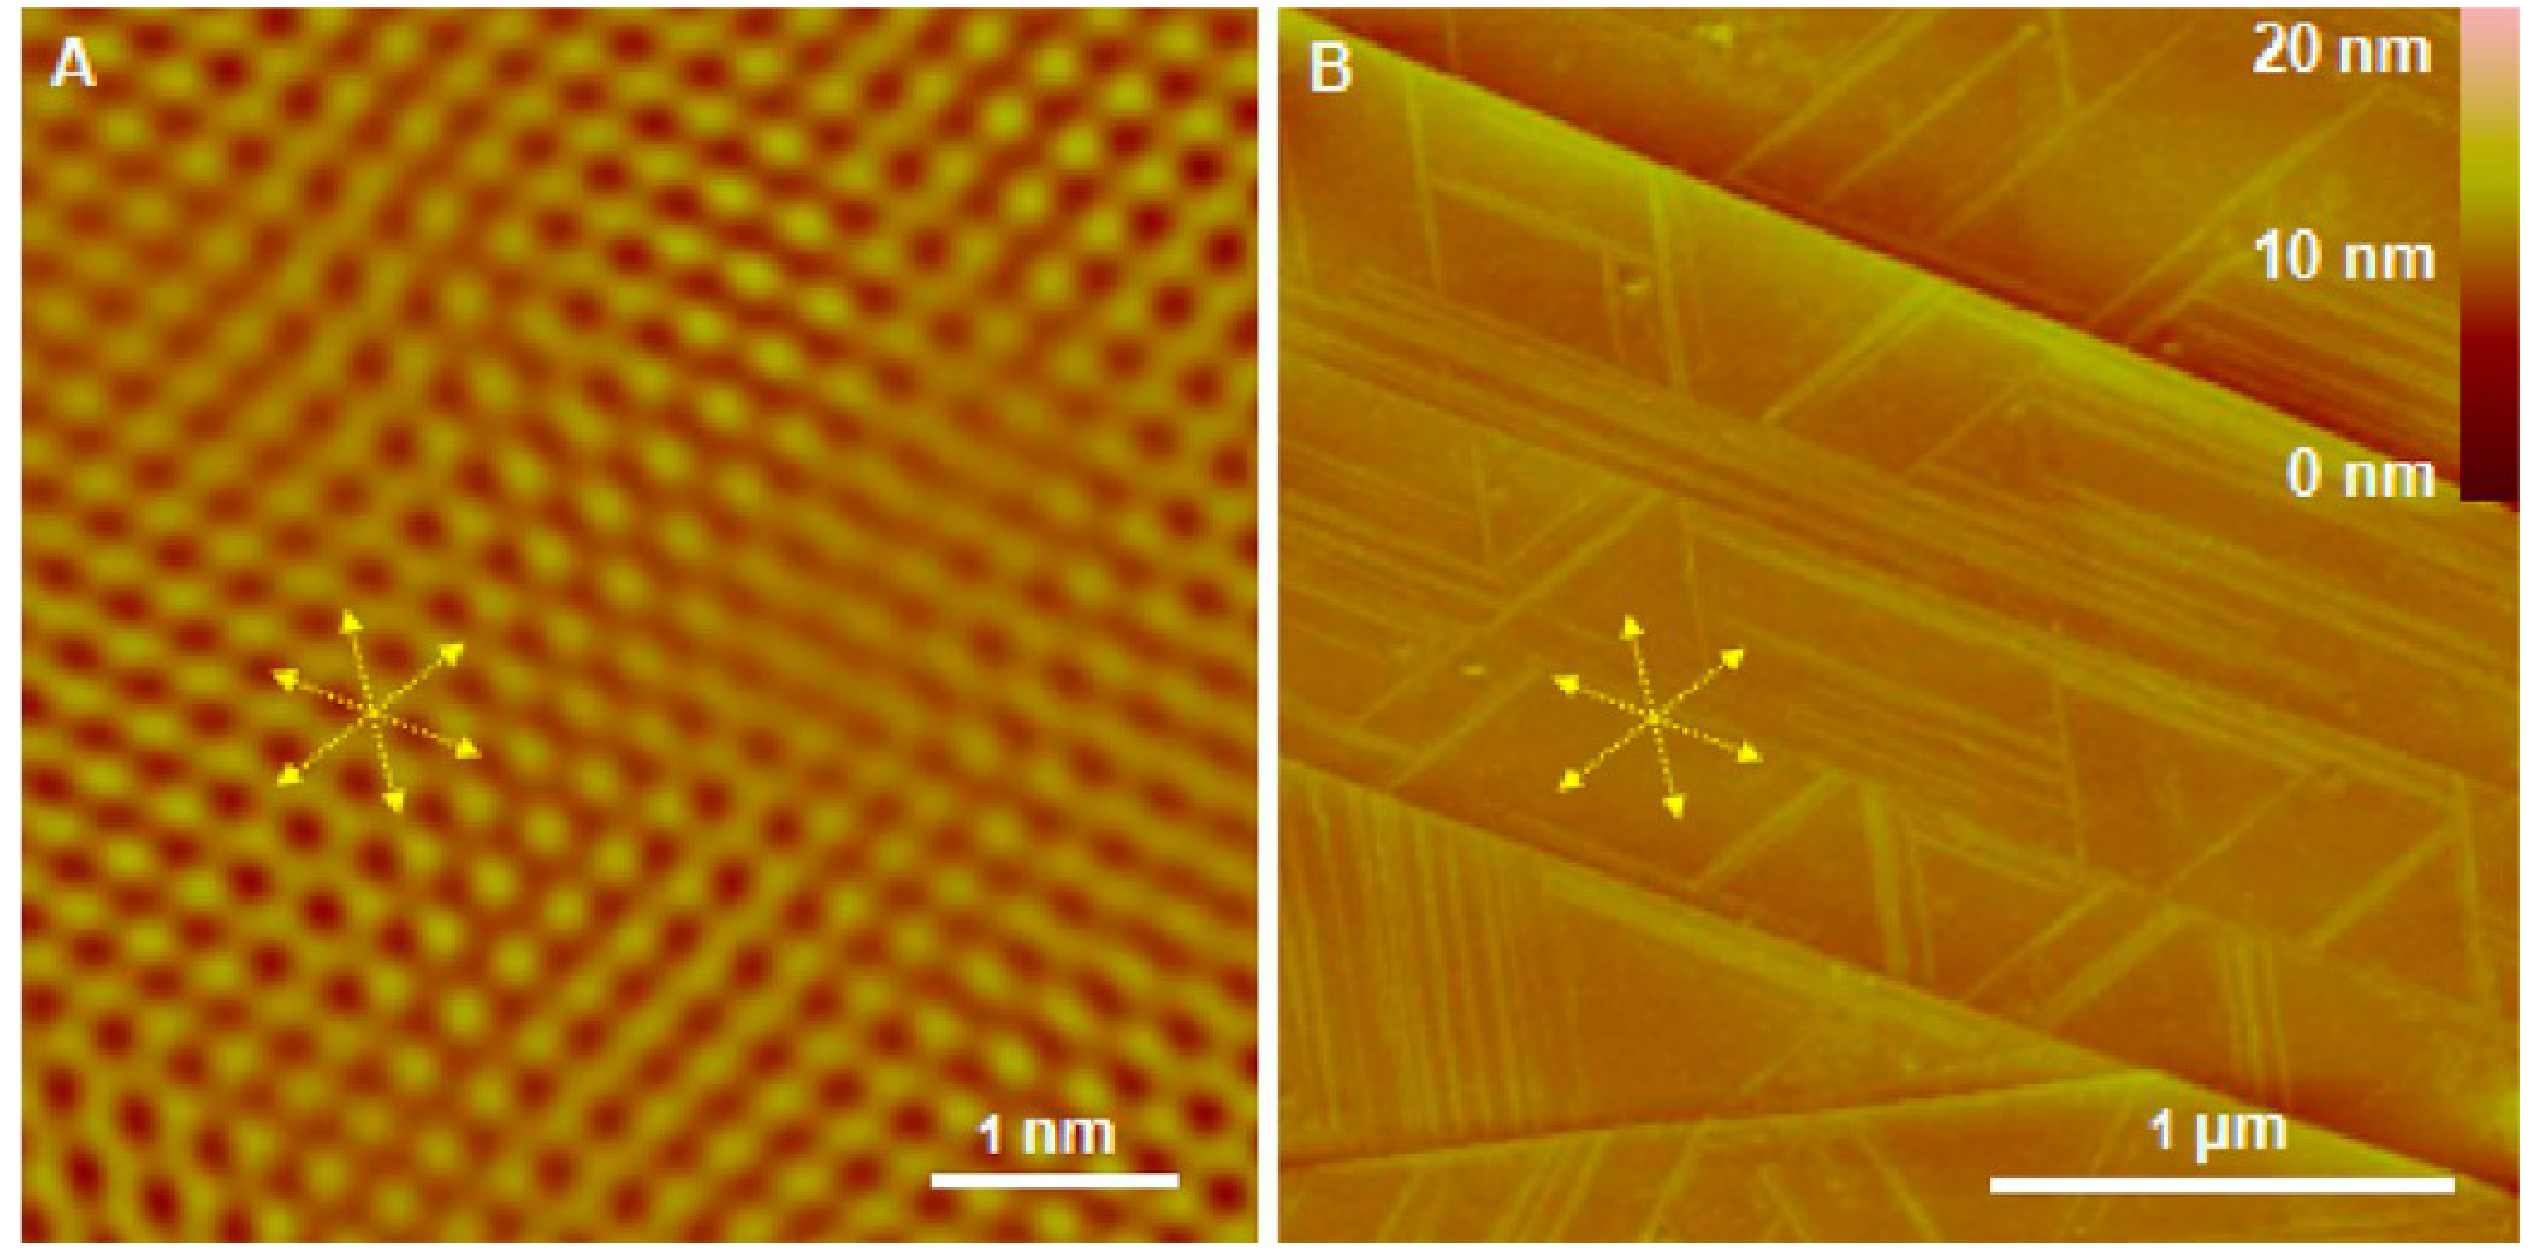
Self-assembly of peptides is closely related to many diseases, including Alzheimer's, Parkinson's, and prion diseases. Understanding the basic mechanism of this assembly is essential for designing ultimate cure and preventive measures. Template-assisted self-assembly (TASA) of peptides on inorganic substrates can provide fundamental understanding of substrate-dependent peptides assemble, including the role of hydrophobic interface on the peptide fibrillization. Here, we have studied the self-assembly process of a potential pentapeptide inhibitor on the surface of highly oriented pyrolytic graphite (HOPG) using real time atomic force microscopy (RT-AFM) as well as molecular dynamics (MD) simulation. Experimental and simulation results show nanofilament formation consisting of β-sheet structures and epitaxial growth on HOPG. Height analysis of the nanofilaments and MD simulation indicate that the peptides adopt a lying down configuration of double-layered antiparallel β-sheets for its epitaxial growth, and the number of nanofilament layers is concentration-dependent. These findings provide new perspective for the mechanism of peptide-based fibrillization in amyloid diseases as well as for designing well-ordered micrometrical and nanometrical structures.


Figures

Figure 1.
Figure 1.
(Left panel) The ThT fluorescence spectrum of P5. ThT fluorescence shows a maximum emission peak at about 470 nm when mixed in P5 solutions. The fluorescence signal was measured after 5 h incubation at room temperature. (Right panel) Fibrillization of P5 monitored by ThT fluorescence. ThT fluorescence was monitored at 470 nm every 10 min within the first 200 min, and afterward the signal was recorded every 100 min. The excitation wavelength was 440 nm.
Figure 2.
Figure 2.
Time-lapse monitoring of P5 fibrillization on HOPG at 0.15 mg/mL in Milli-Q water. (A-F) Tapping-mode RT-AFM images of P5 self-assembling at room temperature for different time periods as denoted in each image. The scale bars in (A) apply to all images.
Figure 3.
Figure 3.
Height measurements of P5 nanofilaments on HOPG. (A-D) Representation of the cross-section analysis of the nanofilament structures (insets) from Figure 2F. Different colors indicated the cutting lines and the corresponding vertical distances (heights) nearby two arrows with same color. The axis units are all nanometers.
Figure 4.
Figure 4.
Time lapse monitoring of P5 fibrillization on HOPG at 1 μg/mL in Milli-Q water. (A-F) Tapping-mode RT-AFM images of P5 self-assembling at room temperature for different time periods as denoted in each image. The scale bars in (A) apply to all images. The inset in (F) shows the periodic spatial distribution in (F) formed by using the two-dimensional Fourier transfer function. The wave-like signal in (B,C) was resonance noise during liquid phase AFM imaging.
Figure 5.
Figure 5.
Height measurements of P5 nanofilaments on HOPG. (A-D) Represention of the cross-section analysis of the nanofilament structures (insets) from Figure 4F. Different colors indicated the cutting lines and the corresponding vertical distances (heights) nearby two arrows with same color. The axis units are all nanometers.
Figure 6.
Figure 6.
A dynamic epitaxial growth procedure of P5 on HOPG at 1 ng/mL in Milli-Q water. (A-F) A series of top-view tapping-mode AFM images at room temperature for different time periods as denoted in each image. The scale bars in (A) applied to all images.
Figure 7.
Figure 7.
Height measurements of P5 nanofilaments on HOPG at a concentration of 1 ng/mL. (A-D) Representation of the cross-section analysis of Figure 6B,D-F. The black lines in the inset AFM images indicated the section cutting lines. The measured heights indicated by two red arrows were 0.65, 0.71, 0.95, and 0.98 nm, respectively.
Figure 8.
Figure 8.
Statistical data for the heights (A) and orientations (B) of P5 nanofilaments on HOPG at different concentrations. For the angle measurements, only the acute angles were recorded. There were at least 40 measurements for each condition.
Figure 9.
Figure 9.
Comparison between the atomic lattice of underneath HOPG and the growth orientations of the P5 nanofilaments. (A) The height image of the HOPG’s atomic lattice obtained prior to P5 self-assembly using friction channel of contact mode AFM. (B) The height image of P5 nanofilaments grown on the surface of HOPG from (A). The yellow arrows and lines denote the consistence of their orientations.
Figure 10.
Figure 10.
Representative nanostructures from MD simulations. (A-C) The top view, angle, and side views for single- layered antiparallel β-sheet formed by conformer 1, respectively. (D-F) The top view, angle, and side views for double-layered antiparallel β-sheets formed by conformer 1, respectively. Both panels A and D showed that the epitaxial growth directions were consistent with the atomic lattice of HOPG, and the antiparallel β-strands were indicated by arrows (the tail of arrows denote the N terminal of P5). Both panels B and E showed the close look at the interaction between amino acid residues and HOPG surface. Both panels C and F showed the height estimates of antiparallel β-sheets.

References

    1. Kagan BL Amyloidosis and protein folding. Science 2005, 307 (5706), 42b–43b. - PubMed
    1. DeToma AS; Salamekh S; Ramamoorthy A; Lim MH Misfolded proteins in Alzheimer’s disease and type II diabetes. Chem. Soc. Rev. 2012, 41 (2), 608–621. - PMC - PubMed
    1. Goedert M; Spillantini MG A century of Alzheimer’s disease. Science 2006, 314 (5800), 777–781. - PubMed
    1. Choi JS; Braymer JJ; Nanga RP; Ramamoorthy A; Lim MH Design of small molecules that target metal-Aβ species and regulate metal-induced Aβ aggregation and neurotoxicity. Proc. Natl. Acad. Sci. U. S. A. 2010, 107 (51), 21990–21995. - PMC - PubMed
    1. Yoo SI; Yang M; Brender JR; Subramanian V; Sun K; Joo NE; Jeong SH; Ramamoorthy A; Kotov NA Inhibition of Amyloid Peptide Fibrillation by Inorganic Nanoparticles: Functional Similarities with Proteins. Angew. Chem., Int. Ed. 2011, 50, 5110. - PMC - PubMed

Publication types