

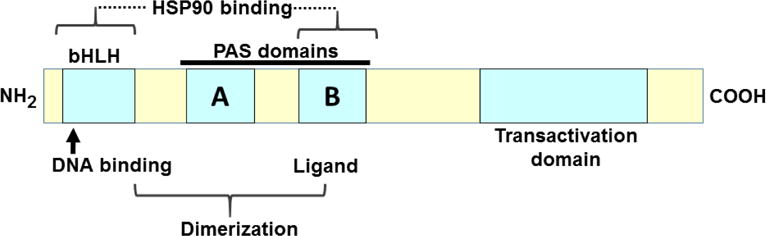
Aryl hydrocarbon receptor (AHR): "pioneer member" of the basic-helix/loop/helix per-Arnt-sim (bHLH/PAS) family of "sensors" of foreign and endogenous signals
- PMID: 28606467
- PMCID: PMC5568781
- DOI: 10.1016/j.plipres.2017.06.001
Aryl hydrocarbon receptor (AHR): "pioneer member" of the basic-helix/loop/helix per-Arnt-sim (bHLH/PAS) family of "sensors" of foreign and endogenous signals
Abstract
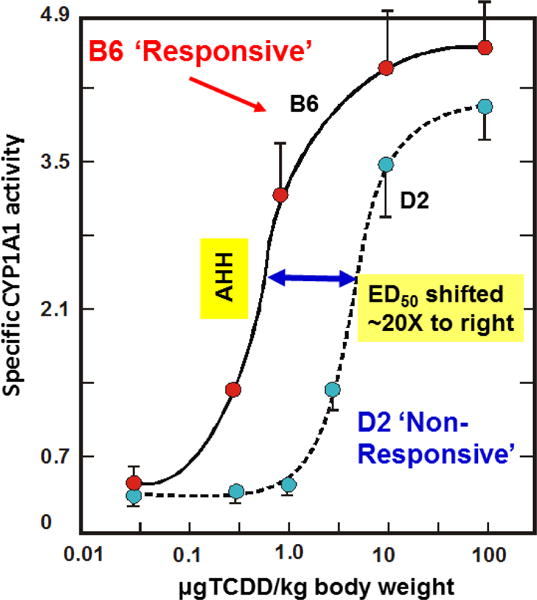
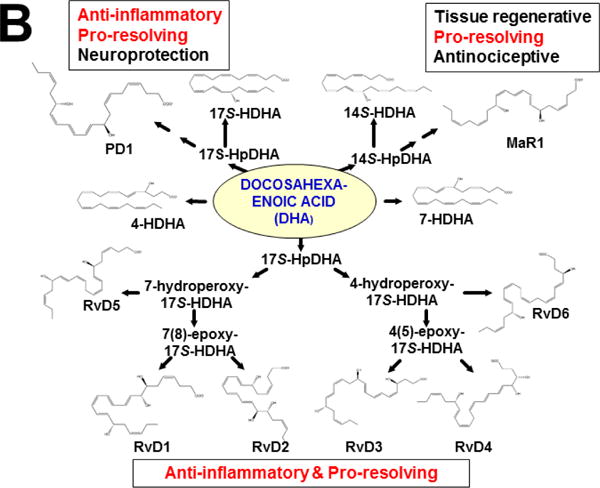
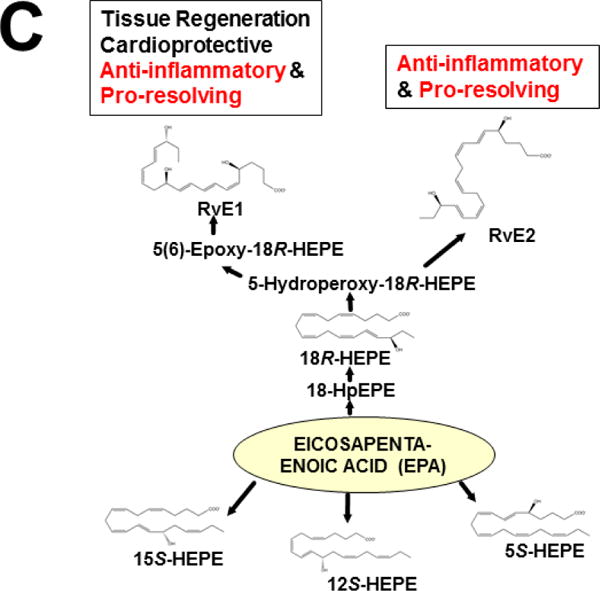
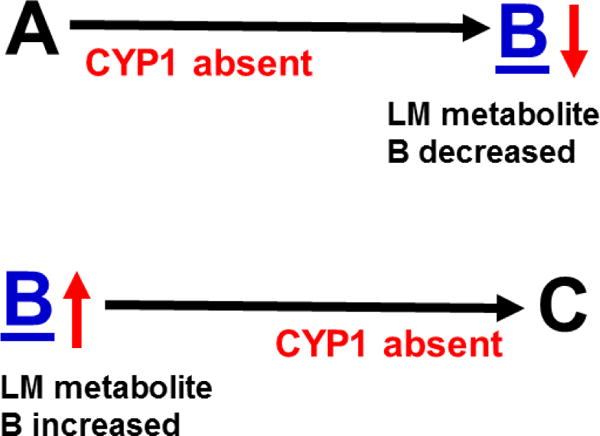
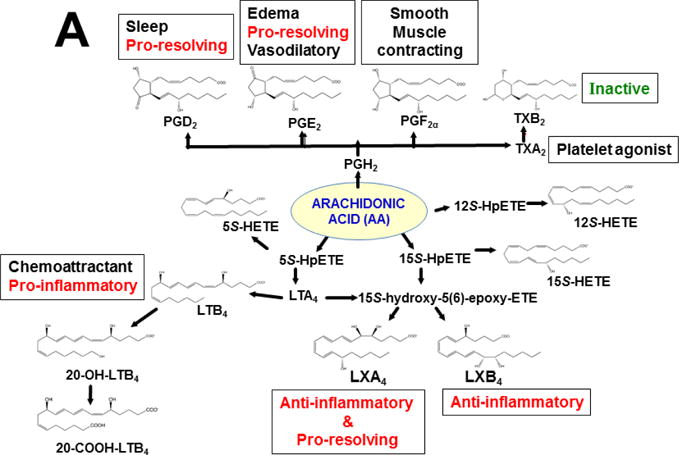
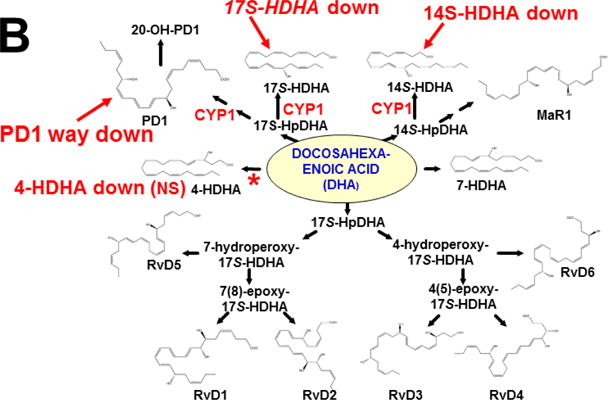
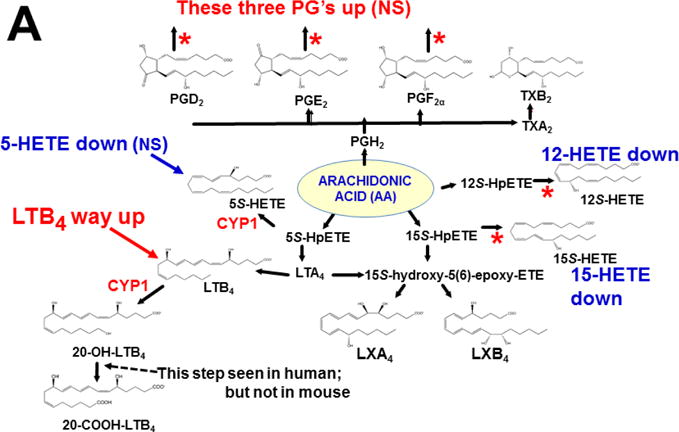
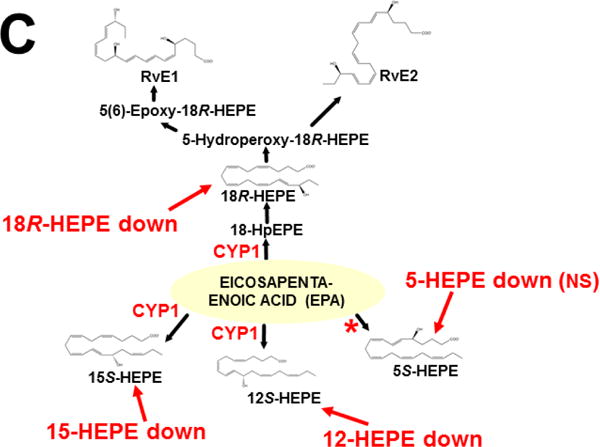
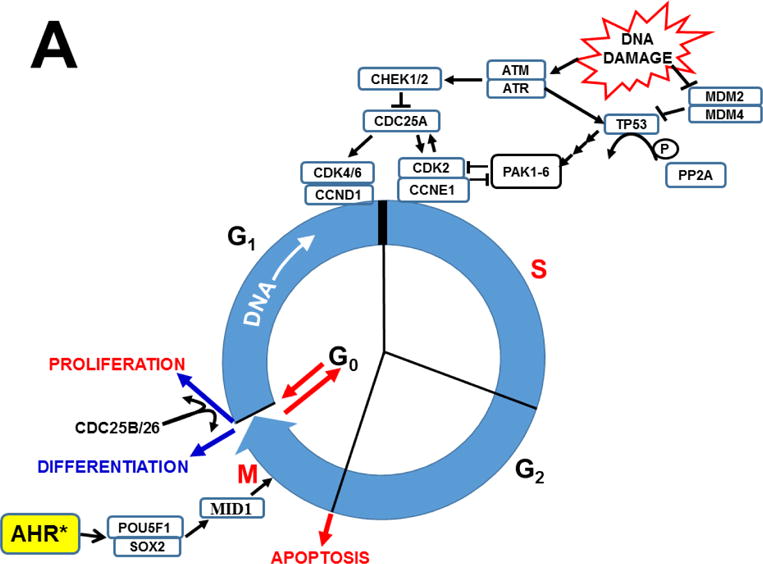
The basic-helix/loop/helix per-Arnt-sim (bHLH/PAS) family comprises many transcription factors, found throughout all three kingdoms of life; bHLH/PAS members "sense" innumerable intracellular and extracellular "signals" - including endogenous compounds, foreign chemicals, gas molecules, redox potential, photons (light), gravity, heat, and osmotic pressure. These signals then initiate downstream signaling pathways involved in responding to that signal. The term "PAS", abbreviation for "per-Arnt-sim" was first coined in 1991. Although the mouse Arnt gene was not identified until 1991, evidence of its co-transcriptional binding partner, aryl hydrocarbon receptor (AHR), was first reported in 1974 as a "sensor" of foreign chemicals, up-regulating cytochrome P450 family 1 (CYP1) and other enzyme activities that usually metabolize the signaling chemical. Within a few years, AHR was proposed also to participate in inflammation. The mouse [Ah] locus was shown (1973-1989) to be relevant to chemical carcinogenesis, mutagenesis, toxicity and teratogenesis, the mouse Ahr gene was cloned in 1992, and the first Ahr(-/-) knockout mouse line was reported in 1995. After thousands of studies from the early 1970s to present day, we now realize that AHR participates in dozens of signaling pathways involved in critical-life processes, affecting virtually every organ and cell-type in the animal, including many invertebrates.
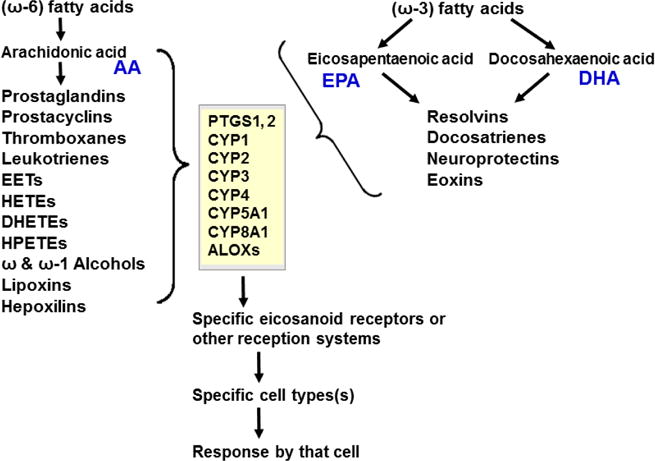
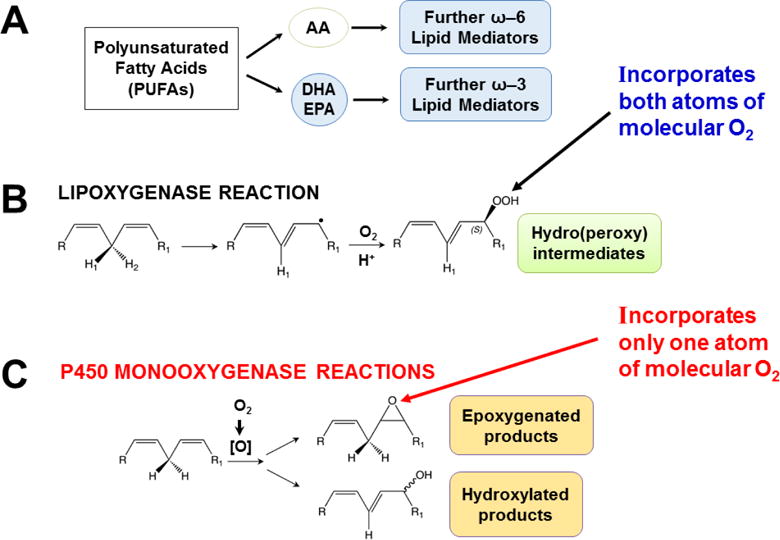
Keywords: AHR; Cancer; Dose-response curve; Eicosanoids; Embryonic stem cells; Lipid mediators; Mouse genetics; Pro-inflammatory and post-inflammatory response; Prostaglandins; bHLH/PAS family of transcription factors; “Brain-gut-microbiome”.
Copyright © 2017 Elsevier Ltd. All rights reserved.
Conflict of interest statement
The author declares he has no actual, or potential, conflicts of interest.
Figures


References
-
- Agius E, Bel-Vialar S, Bonnet F, Pituello F. Cell cycle and cell fate in the developing nervous system: role of CDC25B phosphatase. Cell Tissue Res. 2015;359:201–213. - PubMed
-
- Ahokas JT, Saarni H, Nebert DW, Pelkonen O. The in vitro metabolism and convalent binding of benzo[a]pyrene to DNA catalysed by trout liver microsomes. Chem Biol Interact. 1979;25:103–111. - PubMed
-
- Anderson G, Beischlag TV, Vinciguerra M, Mazzoccoli G. The circadian clock circuitry and the AHR signaling pathway in physiology and pathology. Biochem Pharmacol. 2013;85:1405–1416. - PubMed
-
- Atlas AS, Thorgeirsson SS, Boobis AR, Kumaki K, Nebert DW. Differential induction of murine Ah locus-associated monooxygenase activities in rabbit liver and kidney. Biochem Pharmacol. 1975;24:2111–2116. - PubMed
-
- Atlas SA, Boobis AR, Felton JS, Thorgeirsson SS, Nebert DW. Ontogenetic expression of polycyclic aromatic compound-inducible monooxygenase activities and forms of cytochrome P-450 in rabbit. Evidence for temporal control and organ specificity of two genetic regulatory systems. J Biol Chem. 1977;252:4712–4721. - PubMed
Publication types
MeSH terms
Substances
Grants and funding
LinkOut - more resources
Full Text Sources
Other Literature Sources
