. 2017 Jul 3;149(7):727-749.
doi: 10.1085/jgp.201711780. Epub 2017 Jun 12.

Na/K pump inactivation, subsarcolemmal Na measurements, and cytoplasmic ion turnover kinetics contradict restricted Na spaces in murine cardiac myocytes

Affiliations

Na/K pump inactivation, subsarcolemmal Na measurements, and cytoplasmic ion turnover kinetics contradict restricted Na spaces in murine cardiac myocytes

Fang-Min Lu et al. J Gen Physiol. .

Abstract

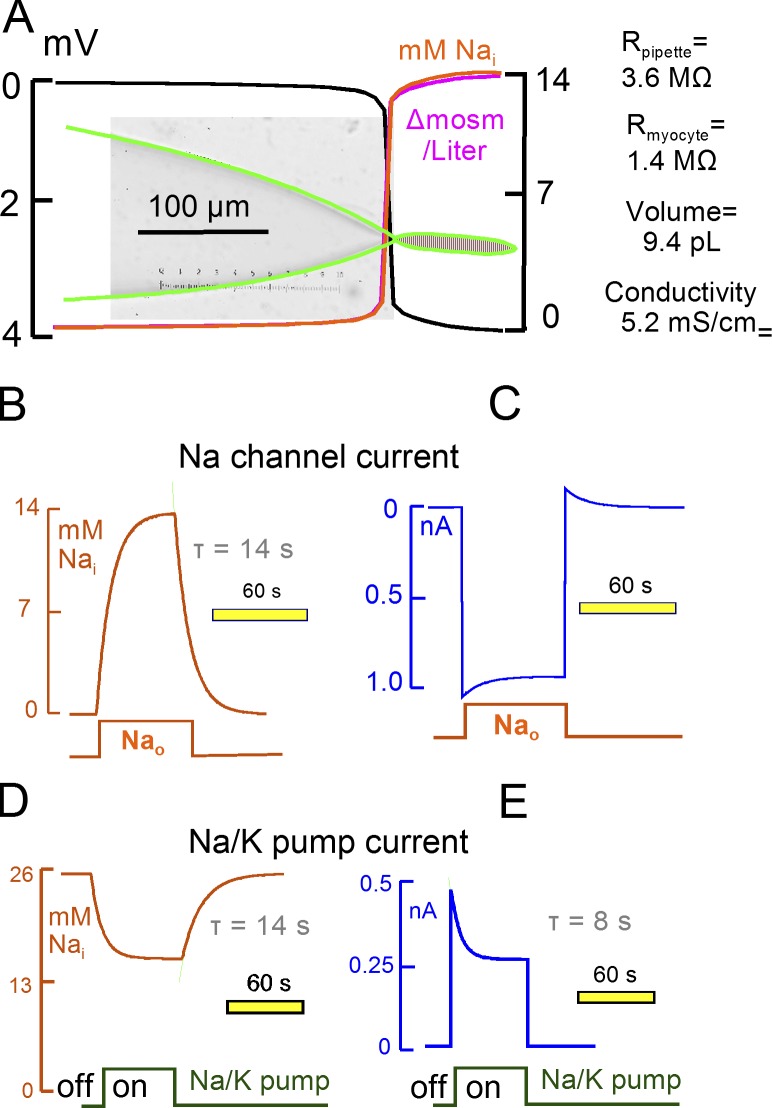
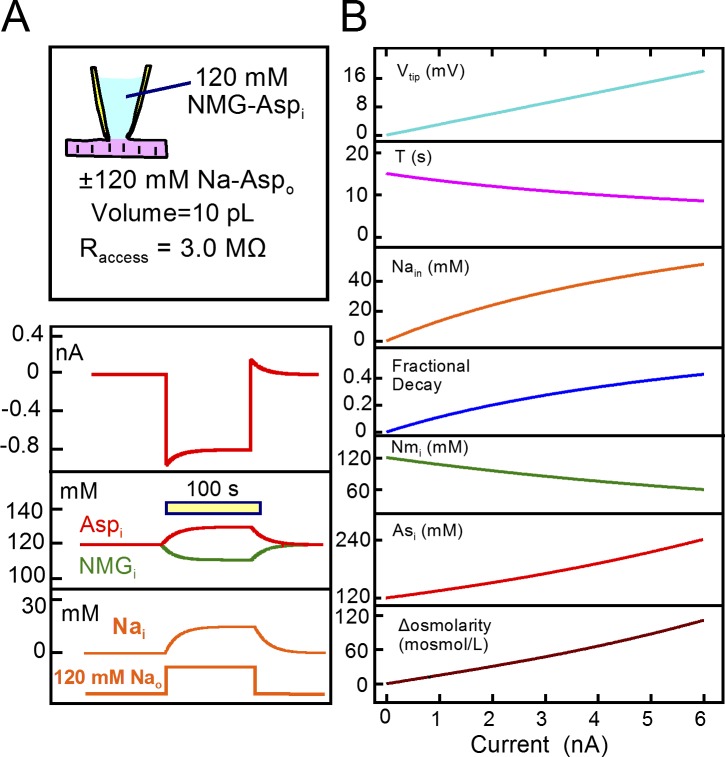
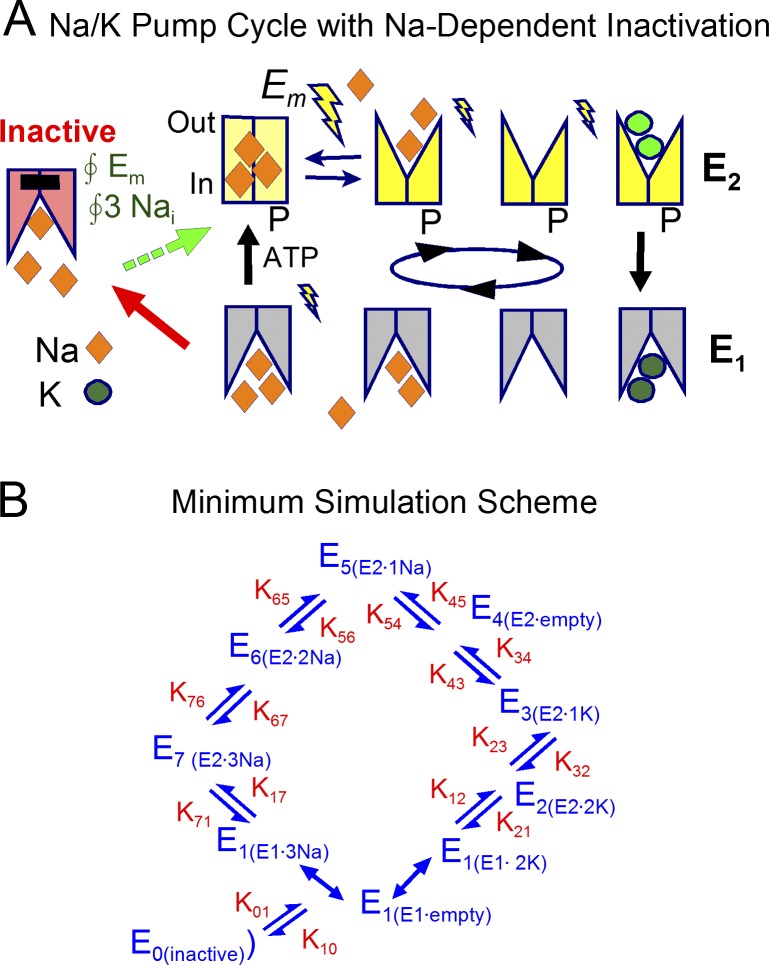
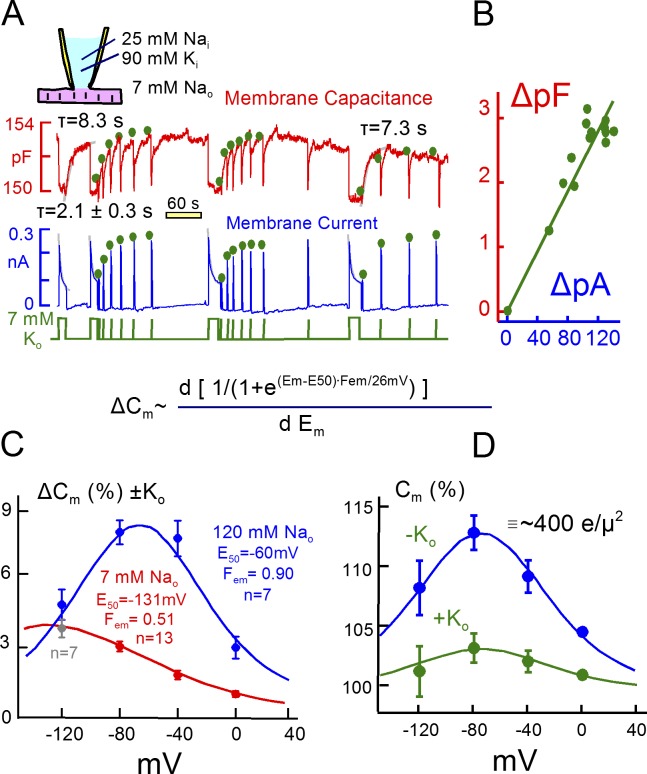
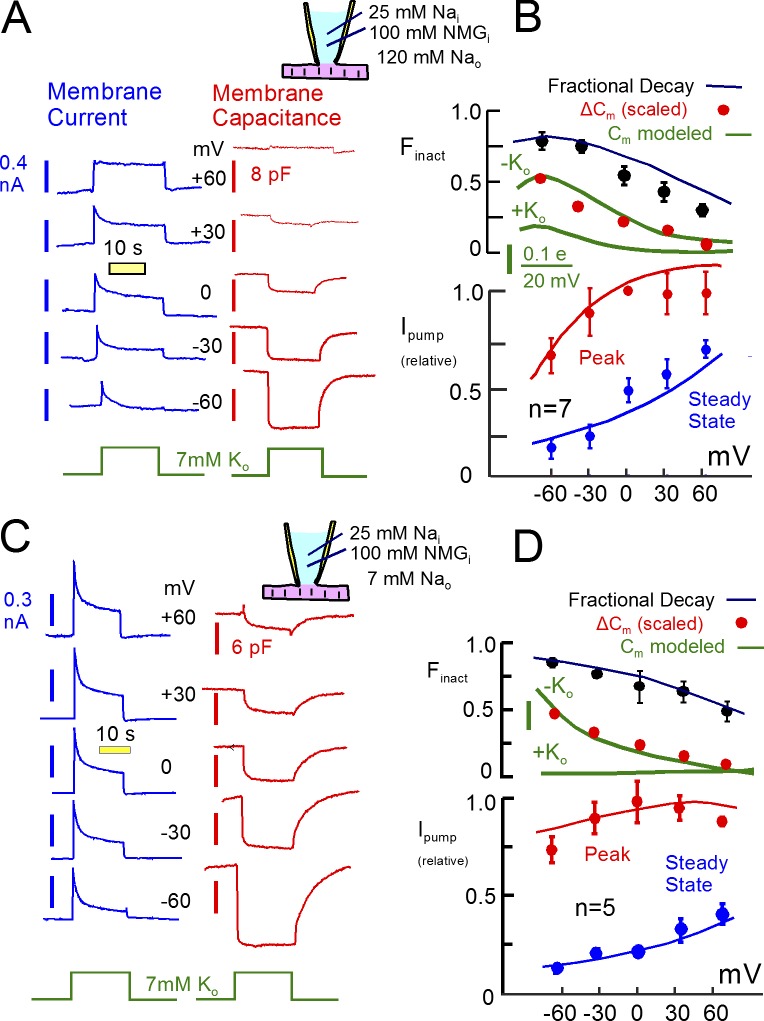
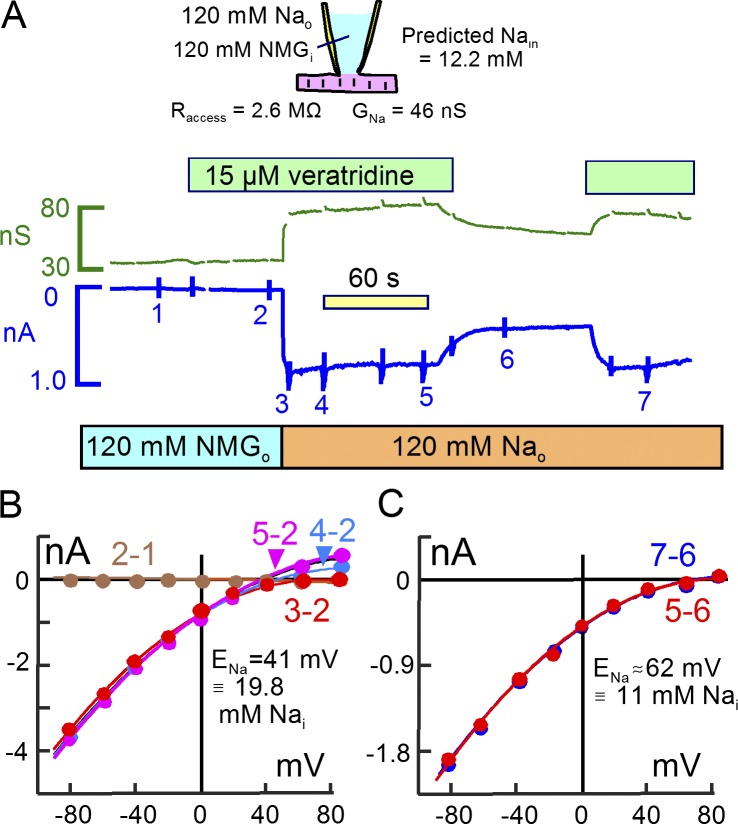
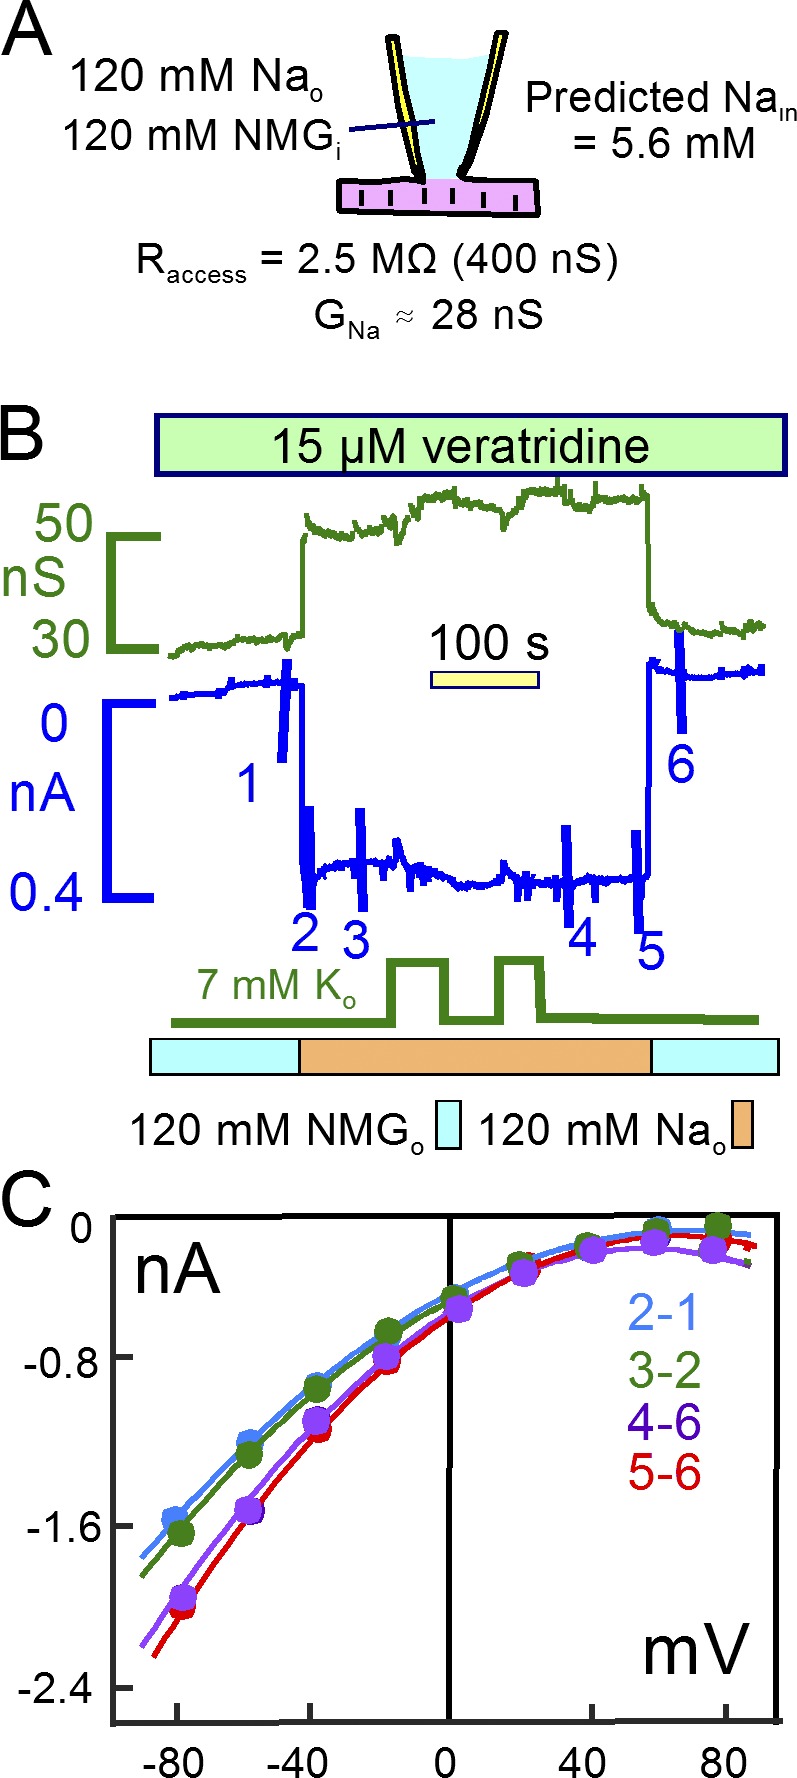
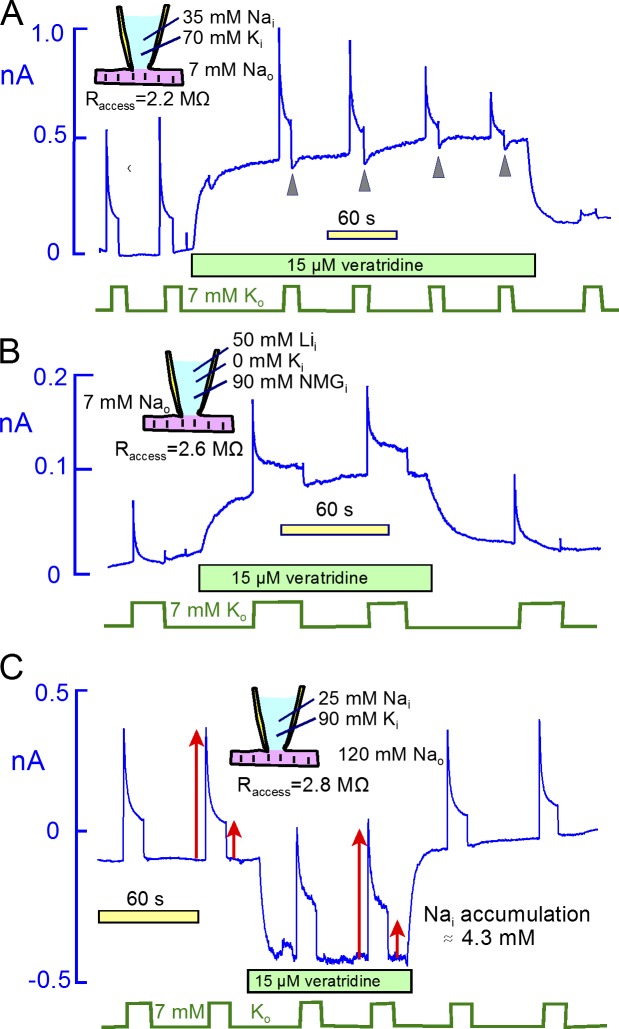
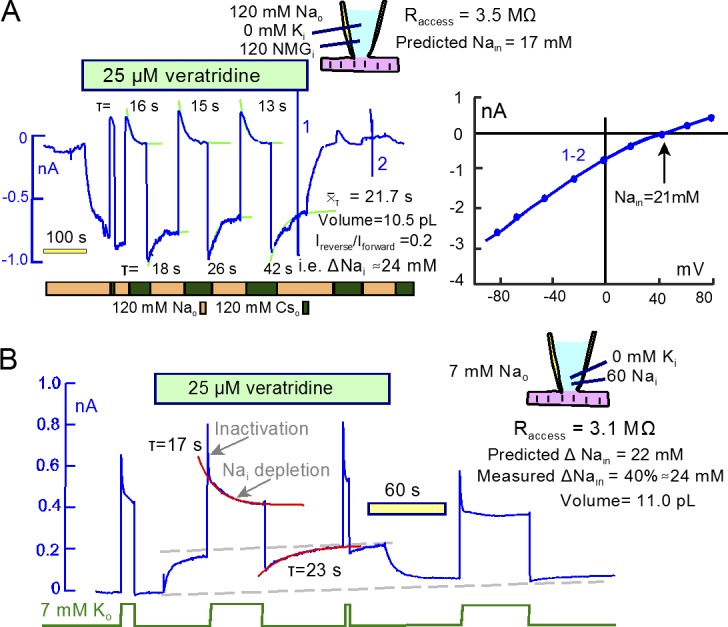
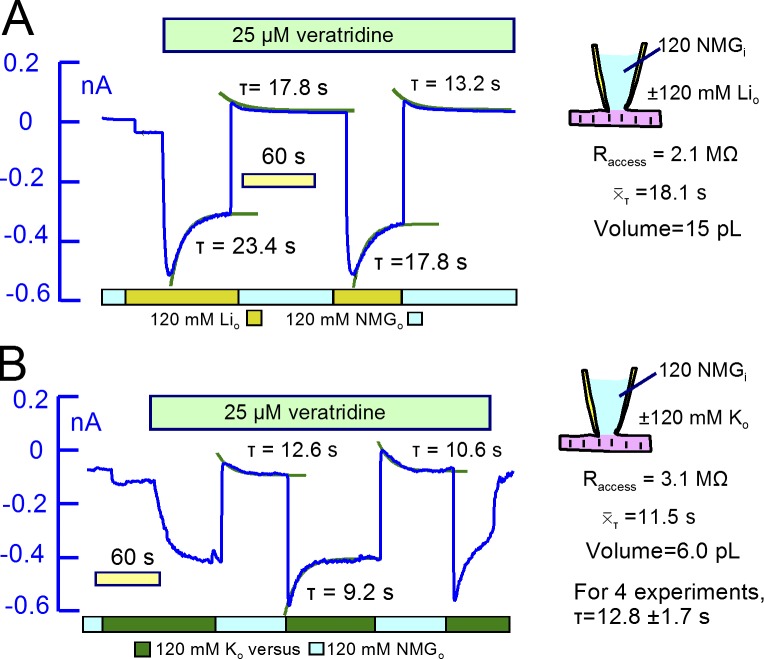
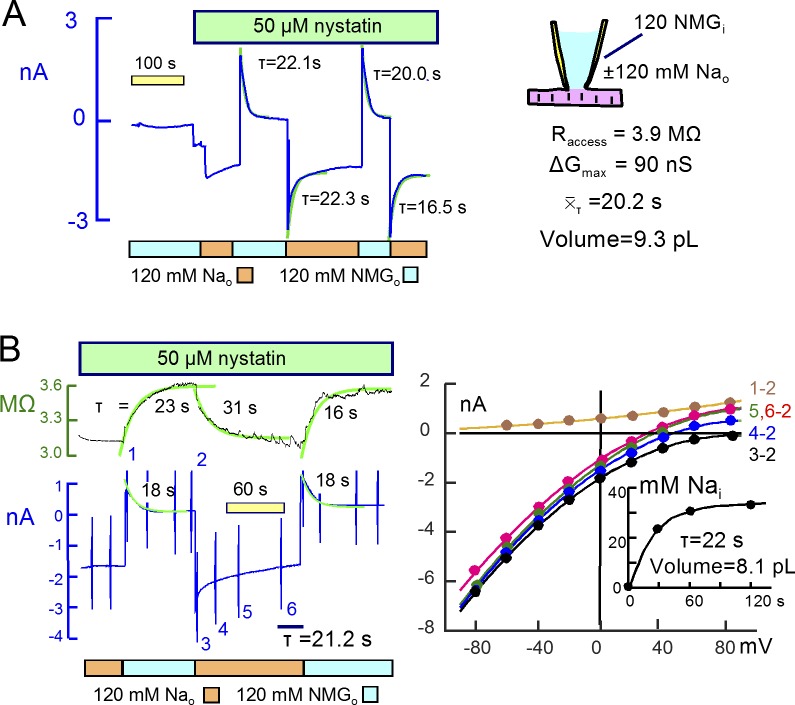
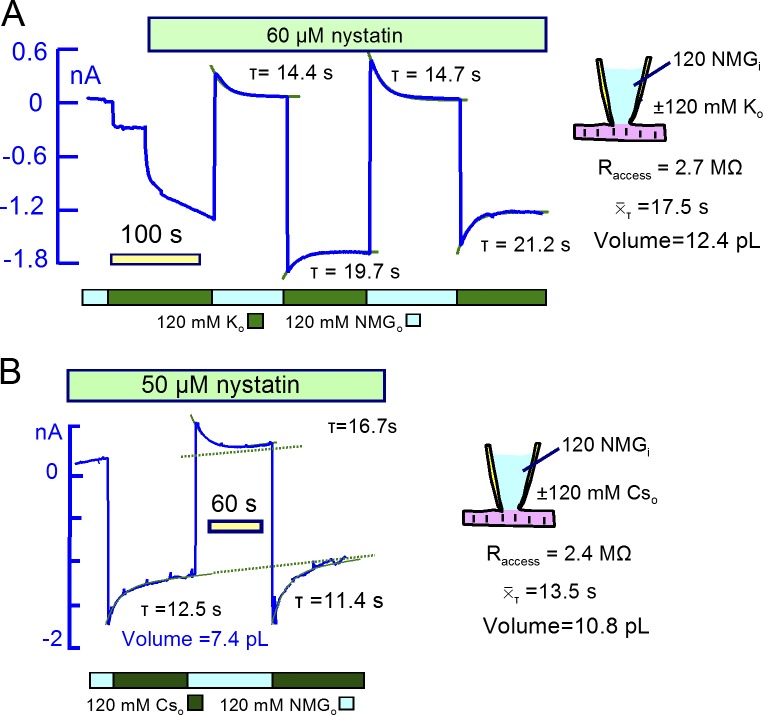
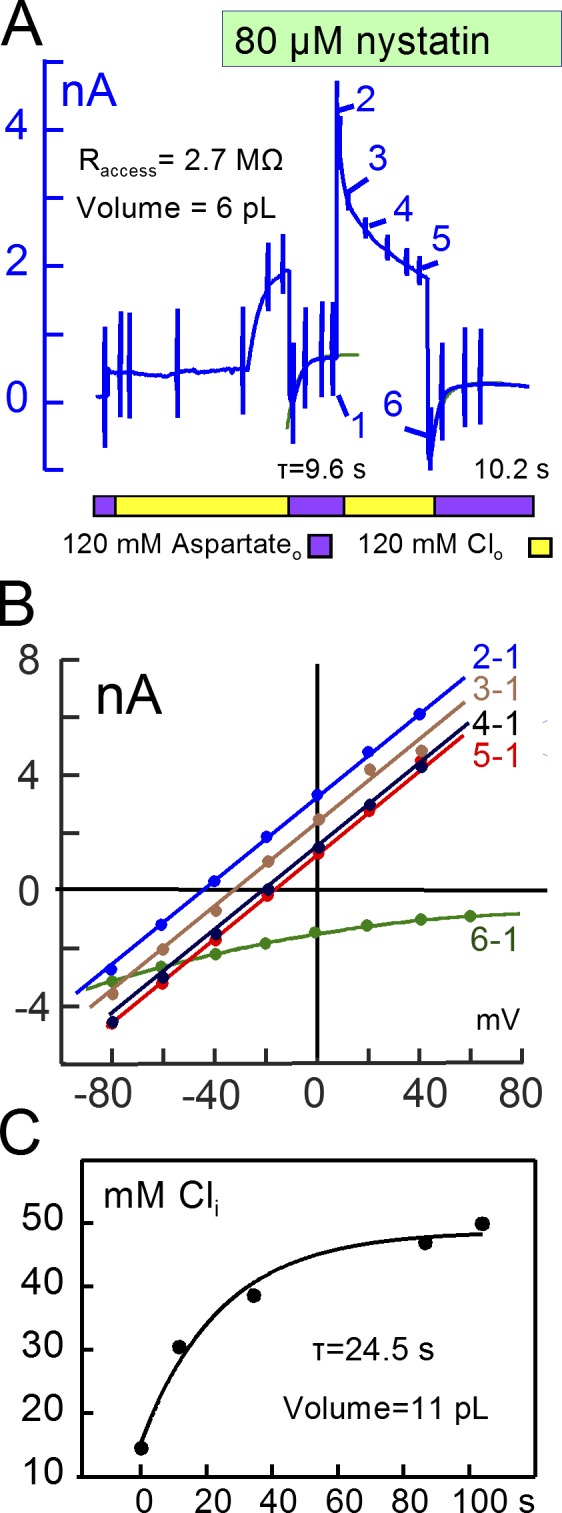
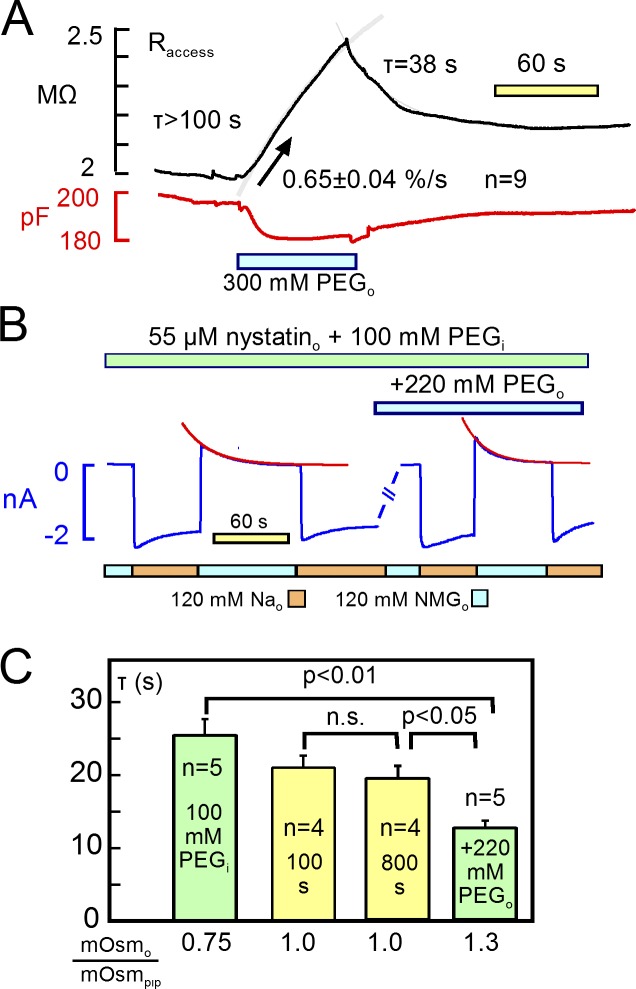
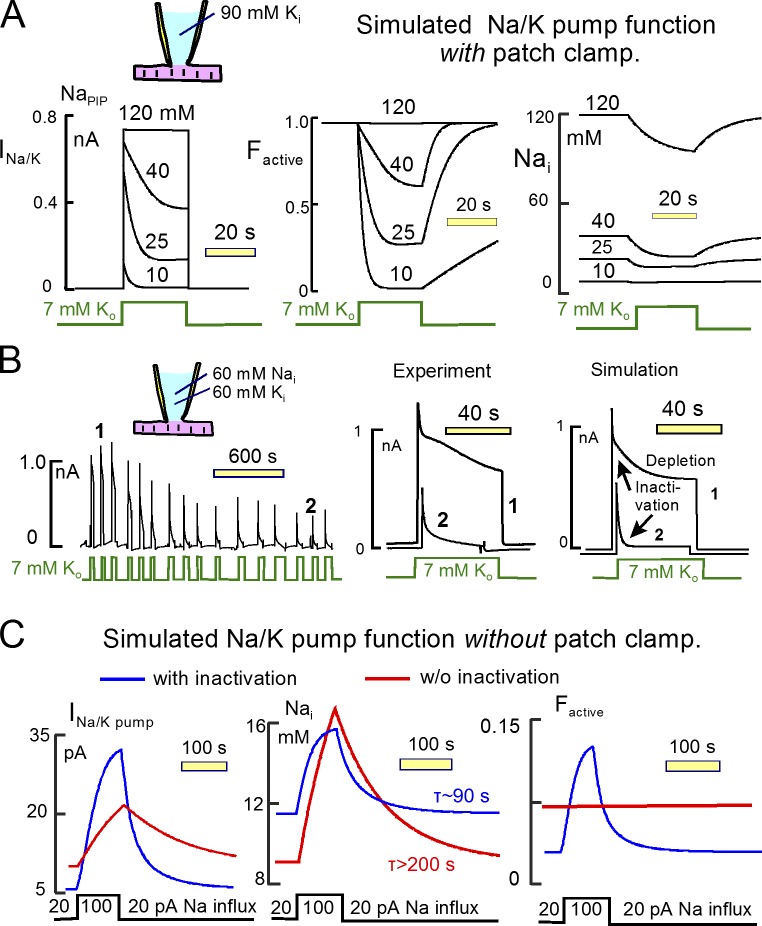
Decades ago, it was proposed that Na transport in cardiac myocytes is modulated by large changes in cytoplasmic Na concentration within restricted subsarcolemmal spaces. Here, we probe this hypothesis for Na/K pumps by generating constitutive transsarcolemmal Na flux with the Na channel opener veratridine in whole-cell patch-clamp recordings. Using 25 mM Na in the patch pipette, pump currents decay strongly during continuous activation by extracellular K (τ, ∼2 s). In contradiction to depletion hypotheses, the decay becomes stronger when pump currents are decreased by hyperpolarization. Na channel currents are nearly unchanged by pump activity in these conditions, and conversely, continuous Na currents up to 0.5 nA in magnitude have negligible effects on pump currents. These outcomes are even more pronounced using 50 mM Li as a cytoplasmic Na congener. Thus, the Na/K pump current decay reflects mostly an inactivation mechanism that immobilizes Na/K pump charge movements, not cytoplasmic Na depletion. When channel currents are increased beyond 1 nA, models with unrestricted subsarcolemmal diffusion accurately predict current decay (τ ∼15 s) and reversal potential shifts observed for Na, Li, and K currents through Na channels opened by veratridine, as well as for Na, K, Cs, Li, and Cl currents recorded in nystatin-permeabilized myocytes. Ion concentrations in the pipette tip (i.e., access conductance) track without appreciable delay the current changes caused by sarcolemmal ion flux. Importantly, cytoplasmic mixing volumes, calculated from current decay kinetics, increase and decrease as expected with osmolarity changes (τ >30 s). Na/K pump current run-down over 20 min reflects a failure of pumps to recover from inactivation. Simulations reveal that pump inactivation coupled with Na-activated recovery enhances the rapidity and effectivity of Na homeostasis in cardiac myocytes. In conclusion, an autoregulatory mechanism enhances cardiac Na/K pump activity when cytoplasmic Na rises and suppresses pump activity when cytoplasmic Na declines.


Figures

Figure 1.
Figure 1.
Simulation of Na diffusion and turnover in a patch-clamped cardiac myocyte. The pipette resistance is 3.6 MΩ when using the standard low-conductance (5.2 mS/cm) NMDG-Asp–containing pipette solution. Myocyte volume is 9.4 pL, and the longitudinal myocyte resistance is 1.4 MΩ. (A) The micrograph of the pipette includes the microscope reticule (15 µm/large divisions). The pipette dimensions are accurately duplicated by a rectangular hyperbola (green lines). Diffusion of three ions was simulated as described in Materials and methods. The predicted electrical potential, Na concentration, and osmolarity gradients are shown during a 1 nA Na current at a 40-s time point. (B) Time dependence of Na concentration changes in the middle of the myocyte during activation of a 1 nM Na current for 60 s with 0 mM Na in the pipette. Here and in subsequent figures, we superimpose individual records with the best-fit exponential functions used to estimate time constants as faint lines, here in green. (C) Time dependence of membrane current during the responses in C. (D) Time dependence of cytoplasmic Na concentration changes with a 25 mM pipette Na concentration, during and after activation of enough Na/K pumps to generate a 0.5 nA pump current. Na/K pumps do not inactivate and the simulation includes no other conductance. (E) Time dependence of membrane current during the responses simulated in D.
Figure 2.
Figure 2.
Simulation of Na turnover in a patch-clamped cardiac myocyte with instantaneous ion mixing. Cell volume is 10 pL, access resistance is 3 MΩ, the patch pipette contains no Na, and the cell membrane has a Na conductance of 38 nS Na in the presence of 120 mM extracellular Na. The cytoplasm is assumed to contain initially 120 mM Asp and NMDG. (A) Application of 120 mM extracellular Na supports a 0.95 nA Na current that decays by ∼12% with a τ of 14 s. Cytoplasmic Na accumulates by 14 mM, and NMDG and Asp decrease and increase, respectively, to maintain electroneutrality. Upon removing extracellular Na, an outward Na current develops with a magnitude equal to the decaying inward current. The reverse Na current decays with nearly the same time constant as the forward current decays. (B) Complete description of the simple model in dependence on the peak Na current activated from 0 to 6 nA. From top to bottom, the tip potential increases linearly from 0 to 18 mV, the τ with which current decays decreases from 16 to 9 s, cytoplasmic Na increases from 0 to 50 mM, the fractional decay of Na current increases from 0 to 0.5, cytoplasmic NMDG decreases from 120 to 60 mM, cytoplasmic Asp increases from 120 to 240 mM, and osmolarity increases from baseline (290 mosM/liter) to 120 mosM/liter over baseline.
Figure 3.
Figure 3.
Na/K pump model with Na-dependent inactivation from E1 states. (A) Cartoon of Na/K pump function with electrogenic steps marked by lightning bolts. Binding sites open to the cytoplasmic side in E1 states and to the extracellular side in E2 states. Translocation of three Na outwardly with ATP hydrolysis and 2K inwardly with dephosphorylation are irreversible reactions under the assumption that cytoplasmic ADP and Pi are negligible. Release of the first Na ion moves 0.75 charges through membrane field, binding/release reactions of the other ions within E2 states moves 0.3 charges, and occlusion of Na from E1 states moves 0.25 charges. Inactivation occurs from all E1 states and recovery has the same Na and voltage dependence as the occlusion of cytoplasmic Na. (B) State diagram used to model Na/K pump function. The normal cycle occurs clockwise. Kinetically defined states are numbered from 0 to 7, and their ion occupancy is indicated. Reaction rates are designated by the numbering of states. E1 states bind 3Na and 2K instantaneously. Reaction rates K12 and K71 are assumed to be zero.
Figure 4.
Figure 4.
Representative Na/K pump currents and capacitance transients in the presence of 25 mM Na and 90 mM K on the cytoplasmic side. (A) Pump currents are activated by substituting 7 mM Na for 7 mM K on the extracellular side. Outward pump current decays by 70% with a τ of ∼2 s and recovers with a τ of ∼8 s. Membrane capacitance falls immediately upon pump activation by 1 to 2% and recovers with a time course that matches the recovery of pump currents. Dots above the current and capacitance records are scaled to one another to illustrate the close temporal correlation between recovery of pump current and membrane capacitance. (B) Plot of Na/K pump current changes versus capacitance changes during pump current recovery. (C) Voltage dependence of K-induced capacitance changes in the presence of 120 mM extracellular Na (blue, n = 7) and for the substitution of 7 mM Na for 7 mM K (red, n = 13, except for −120 mV, where n = 7). The bell shaped capacitance curve with 120 mM Na reflects the major charge movement of the pump with a Boltzmann slope of 29 mV and a midpoint of −60 mV. (D) Voltage dependence of capacitance in the presence of 120 mM Na in the absence (blue) and the presence (green) of 7 mM K. Note that the midpoint of the bell shifts at most 10 mV to more negative potentials. Assuming that Na and K binding are mutually exclusive, this result requires that time-dependent steps separate Na and K binding.
Figure 5.
Figure 5.
Voltage dependence of Na/K pump currents and K-induced capacitance changes with 120 and 7 mM extracellular Na. Cytoplasmic K was omitted to ensure minimal K conductance. (A) Na/K pump currents and capacitance changes recorded at five voltages from −60 to +60 mV. K-induced capacitance changes decrease and Na/K pump current decay attenuates progressively with depolarization. (B) Mean peak (blue) and 20 s (red) pump currents plotted against membrane voltage, together with the fractional decay of pump currents (black) and the magnitude of K-induced capacitance changes (red). The voltage range is too narrow to reveal the bell shape of capacitance changes with 120 mM Na. Solid curves are simulation results scaled to the data points. According to the model, capacitance changes reflect primarily the voltage dependence of Na-dependent charge movements. The attenuation of current decay with depolarization reflects a shift of pumps from E1 to E2 configurations. Although the dissociation of Na in E2 conformations is favored by depolarization, thereby promoting a shift to E1, extracellular K binding is progressively hindered and Na occlusion from the cytoplasmic side is progressively favored. With depolarization, these latter influences become dominant and pumps shift on average to E2 from E1. (C and D) Equivalent results for experiments in which 7 mM extracellular Na was replaced with 7 mM K to activate pump currents. Voltage dependence of pump current is reduced in characteristic fashion, whereas other patterns are principally similar.
Figure 6.
Figure 6.
Veratridine-activated Na currents cause Na concentration changes that are consistent with unrestricted cytoplasmic Na diffusion. (A) Conductance and membrane current records during application of 15 µM veratridine. As apparent in the records, veratridine activates no conductance in the absence of Na and K. Application of 120 mM Na in replacement for NMDG then activates an inward current that is initially 860 pA in magnitude and that decays by 13% over 90 s. Removal of veratridine reversibly reduces the Na-dependent current and conductance by 55%. Thus, 45% of the Na current may be carried by mechanisms other than veratridine-modified Na channels, and Fig. S3 gives evidence for nonselective cation channels in murine myocytes. (B) Na-defined current–voltage relations obtained by subtracting the records 3, 4, and 5 from record 2. During the 90 s of Na application (3′ to 5′), the Na-defined current–voltage relation shifts from having no clear reversal to having a reversal at +41 mV, indicating a subsarcolemmal Na concentration of 19.8 mM. (C) Veratridine-defined current–voltage relation. The current–voltage relations defined by removing (5–6) and reapplying (7–6) veratridine reverse at +62 mV, corresponding to a subsarcolemmal Na concentration of 11 mM.
Figure 7.
Figure 7.
A continuous 400 pA Na current does not cause a detectable rise of subsarcolemmal Na. (A) The cartoon summarizes patch-clamp conditions and the predicted 5.6 mM cytoplasmic Na concentration during a continuous 0.38 nA Na current. (B) Veratridine was applied in the absence of Na, and the subsequent application of 120 mM Na activated a 0.38 nA inward current. Na/K pump currents activated by applying 7 mM K were at the threshold of reliable detection, indicating that subsarcolemmal Na remains with good certainty less than 10 mM. (C) Current–voltage relations given by the indicated subtractions do not reverse up to 80 mV, verifying that subsarcolemmal Na remains <10 mM.
Figure 8.
Figure 8.
Continuous veratridine-activated Na currents only weakly affect Na/K pump currents that decay by 70% to 90%. Na/K (or Li/K) pump currents were repeatedly activated for 20 s by applying 7 mM extracellular K. (A) With 35 mM Na and 70 mM K on the cytoplasmic side, 15 µM veratridine activates a 0.4 nA outward current. Small inward current deflections upon deactivating pump currents, marked by arrowheads, are consistent with a 10% depletion of subsarcolemmal Na by pump activity. However, the deflections do not change as current runs down, indicating that they are not caused by pump activity. (B) In the presence of 50 mM Li and no K on the cytoplasmic side, Li/K pump currents decay almost completely in the absence of veratridine and decay by ∼85% in the presence of veratridine. The veratridine-activated outward Li current, upon deactivating pump current, is unaffected by Li/K pump currents. (C) In the presence of 120 mM extracellular Na, 25 mM cytoplasmic Na and 90 mM extracellular K, 15 µM veratridine activates a 0.4 nA inward current that is unaffected by activating and deactivating Na/K pump currents. Arrows indicate the magnitudes of peak and steady-state pump current without veratridine. Peak and steady-state pump currents are increased by 8% and 24%, respectively, in the presence of inward current, consistent with an increase of Na by 4.3 mM (Lu et al., 2016).
Figure 9.
Figure 9.
Large Na and Na/K pump currents cause cytoplasmic Na concentration changes with a τ of ∼20 s. (A) A high veratridine concentration (25 µM) activates continuous Na currents of ∼1 nA. The Na-activated currents decay by 22% with an mean τof 28 s. Reverse currents activated upon Na removal decay with a τ of ∼15 s. The mean τ and the access resistance give a mixing volume of 10.5 pL, and the magnitudes of decaying currents in relation to peak current (0.2) indicate that Na accumulated by 24 mM. As indicted in the cartoon, calculations from Eq. 26 give a steady-state cytoplasmic Na concentration of 17 mM. The reversal potential of the veratridine-activated current indicates a steady-state cytoplasmic Na concentration of 21 mM, ∼40% greater than predicted by the simple model. (B) Using 60 mM cytoplasmic Na, Na/K pump currents decay in two distinct phases, a fast phase with a τ of ∼1 s and a slow phase with a τ of ∼17s. The veratridine-activated outward Na current is decreased by ∼40% immediately after deactivation of pump current, and it recovers with a τ of 23 s. These results project to a Na depletion of 24 mM and a mixing volume of 11.0 pL. Using the same protocol as in B, Fig. S4 describes very similar results using current–voltage relations to define the cytoplasmic Na accumulation.
Figure 10.
Figure 10.
Li and K currents carried by veratridine-modified Na channels. For both Li and K currents, the decaying components of inward currents are substantially larger than the reverse currents that develop upon removing the extracellular cations. (A) NMDG was substituted for 120 mM Li. 25 µM veratridine then rapidly activated a 0.55 nA inward current that decayed with a τ of ∼20 s. The mean for the decay phases was 18.1 s, and the mixing volume is estimated to be 7.5 pL. (B) NMDG was substituted for 120 mM K, and 25 µM veratridine application then activated a 0.30 nA inward current. When activated by applying extracellular K, the current decayed partially with a τ of 9.2 s. The mean τ was 11.1 s, and the mixing volume is estimated to be 6.0 pL.
Figure 11.
Figure 11.
Large Na currents carried by nystatin channels have similar kinetics to those carried by veratridine-modified Na channels. (A) 50 µM nystatin was applied in the absence of Na, and NMDG was then replaced by Na, generating an initial steady-state current of ∼1 nA. The outward current activated by removing Na amounts to 2 nA, and peak inward current on reapplying Na was 3 nA with current decay amounting to approximately one half of peak current. The mean τ for current decay was 20.2 s, the peak conductance was 90 nS, and the access resistance was 90 nS. We estimate the mixing volume to be 9.3 pL and the steady-state cellular Na concentration to be 43 mM. (B) Current–voltage relations and access resistance changes during the same protocol. Access resistance rises and falls with a time course that is similar to the Na current, therefore revealing no longitudinal diffusion delays. Note that inward current decay is not a simple exponential function, possibly reflecting a change of the nystatin conductance. Reversal potentials (right) shift negatively as Na accumulates, and the calculated cytoplasmic Na concentration (inset) approach a steady state of 32 mM monotonically with a τ of 22 s, similar to the mean τ for outward current decay (21.2 s).
Figure 12.
Figure 12.
Large K and Cs currents carried by nystatin channels project to similar mixing volumes as results for Na currents. (A) Nystatin-carried K current. Extracellular NMDG was replaced by K and 60 µM nystatin was applied, generating an inward current of ∼1.7 nA. The outward current activated by removing K amounted to 0.3 nA and decayed with a time constant of 14.4 s. The fractional decay of inward current is less than for equivalent Na currents (or for K currents in veratridine-modified Na channels), and the mean τ of current decay is 17.5 s. The projected mixing volume is 10.1 pL. (B) Nystatin-carried Cs current. In the presence of 50 µM nystatin, extracellular NMDG was replaced with Cs multiple times, activating peak inward currents of ∼1.6 nA. Currents decayed with a mean τ of 13.5 s, projecting to a mixing volume of 10.8 pL.
Figure 13.
Figure 13.
Large Cl currents carried by nystatin channels project to similar mixing volumes as cation currents. (A) Nystatin-carried Cl current. Extracellular aspartate was replaced with Cl, and 80 µM nystatin was applied, generating an outward current of 1.8 nA. Removal of Cl then generated peak inward currents of 0.7 to 1 nA with decay time constants of 9.6 and 10.2 s. The peak Cl-activated outward current reached 4 nA and, similar to the nystatin-carried Na current, decayed in a nonexponential fashion. (B) Current–voltage relations during decay of outward current and upon reapplying extracellular Cl. (C) Cytoplasmic Cl concentrations calculated from reversal potentials in B. Cl increases monotonically from 21 mM to 48 mM with a τ of 24.5 s, projecting to a mixing volume of 11 pL.
Figure 14.
Figure 14.
Mixing volumes determined by nystatin-mediated currents are predictably changed by osmolarity gradients. (A) Representative record of access resistance and capacitance when extracellular osmolarity is doubled for 80 s by 300 mM extracellular polyethylene glycol (PEG; 500 MW). Otherwise, solution compositions were standard, with no Na. Access resistance, which includes longitudinal myocyte resistance, increases as expected for a reduction of the myocyte diameter. Note that resistance does not return to baseline after removing PEG. (B) Membrane current transients in the presence of nystatin when 120 mM NMDG is replaced with 120 mM Na. Osmolarity of the pipette solution was increased to 400 mosM/liter with 100 mM PEG. After recording the initial responses to Na changes, the extracellular solution was switched to a hyperosmotic solution containing 220 mM PEG. Responses to cation substitution were recorded again and compared with the initial currents. (C) With 100 mM hyperosmotic pipette solution, the τ of current decay is 25 ± 2 s (n = 5) versus 12 ± 2 s (n = 5) in the 220 mM hyperosmotic solution. Mean τ values with isosmotic (290 mosM/liter) solutions on both sides amounted to 20 ± 3 s initially and did not change significantly after 800 s of recording time (not depicted, n = 4). Error bars indicate SEM.
Figure 15.
Figure 15.
Projected roles of Na depletion and Na/K pump inactivation with (A and B) and without (B) patch clamp. (A) Simulation of Na/K pump currents, the fraction of pumps that are actively pumping (Factive), and cytoplasmic Na concentrations in a cell model with instantaneous ion diffusion (Fig. 2) and Na/K pumps that inactivate (Fig. 3). Inactivation occurs from all E1 conformations, whereas recovery occurs only when three Na ions are bound to inactive states. The simulation reproduces well the corresponding experiments with different cytoplasmic Na concentrations (Lu et al., 2016). Current decay involves both inactivation and Na depletion with the contributions depicted in the central panel for inactivation and in the right panel for Na concentration changes. (B) Representative long-duration experiment with 60 mM cytoplasmic Na. In the central panel, pump current decay records are shown from the initial (1) and late (2) portions of the experiment. Initially (1), pump current decays in a biphasic fashion. The initial phase has a τ of ∼1 s and amounts to 10% to 20% of peak current magnitude. The slow phase develops with a lag, continues over 40 s, and merges with the usual slow run-down of pump current that occurs in these experiments. After 30 min (2), run-down of pump current has progressed so that peak currents are ∼30% of initial peak currents, and current decay amounts to ∼90% during a 20s application of extracellular K. The right panel reproduces these pump current decay records using slightly modified model parameters. The initial fast current decay in record “1” corresponds largely to inactivation, and the latter decay phase in 1 corresponds largely to Na depletion. Because Na depletion promotes inactivation, however, the processes are interdependent, and the model can develop small oscillations via this feedback. (C) Simulated function of the inactivation process when Na load is changed in a cardiac myocyte that is not patch clamped. Using the same simulation parameters as in A, C depicts model function when Na influx is increased and decreased. The initial Na influx is equivalent to a 20 pA current. It is then increased for 100 s to 100 pA and decreased again to 20 pA. From left to right, the three panels show cytoplasmic Na currents with (blue) and without (red) the simulated Na/K pump inactivation mechanism, cytoplasmic Na concentration changes, and changes of the active state probability of the pump. In summary, the inactivation mechanism promotes the pump to minimize, relatively, cytoplasmic Na changes in the face of Na influx changes. Importantly, cytoplasmic Na concentrations approach a steady state markedly faster (τ ∼90 and ∼200 s with and without inactivation) than the actual turnover of the mean cytoplasmic Na ion to the extracellular space (τ ∼700 s).

Comment in

Similar articles

Cited by

References

    1. Agarwal S.R., Clancy C.E., and Harvey R.D.. 2016. Mechanisms restricting diffusion of intracellular cAMP. Sci. Rep. 6:19577 10.1038/srep19577 - DOI - PMC - PubMed
    1. Akera T., Bennett R.T., Olgaard M.K., and Brody T.M.. 1976. Cardiac Na+, K+-adenosine triphosphatase inhibition by ouabain and myocardial sodium: A computer simulation. J. Pharmacol. Exp. Ther. 199:287–297. - PubMed
    1. Apell H.J., Schneeberger A., and Sokolov V.S.. 1998. Partial reactions of the Na,K-ATPase: Kinetic analysis and transport properties. Acta Physiol. Scand. Suppl. 643:235–245. - PubMed
    1. Belardinelli L., Giles W.R., Rajamani S., Karagueuzian H.S., and Shryock J.C.. 2015. Cardiac late Na+ current: Proarrhythmic effects, roles in long QT syndromes, and pathological relationship to CaMKII and oxidative stress. Heart Rhythm. 12:440–448. 10.1016/j.hrthm.2014.11.009 - DOI - PubMed
    1. Bensley J.G., De Matteo R., Harding R., and Black M.J.. 2016. Three-dimensional direct measurement of cardiomyocyte volume, nuclearity, and ploidy in thick histological sections. Sci. Rep. 6:23756 10.1038/srep23756 - DOI - PMC - PubMed