

Quantitative Temporal Viromics of an Inducible HIV-1 Model Yields Insight to Global Host Targets and Phospho-Dynamics Associated with Protein Vpr
- PMID: 28606917
- PMCID: PMC5546197
- DOI: 10.1074/mcp.M116.066019
Quantitative Temporal Viromics of an Inducible HIV-1 Model Yields Insight to Global Host Targets and Phospho-Dynamics Associated with Protein Vpr
Abstract
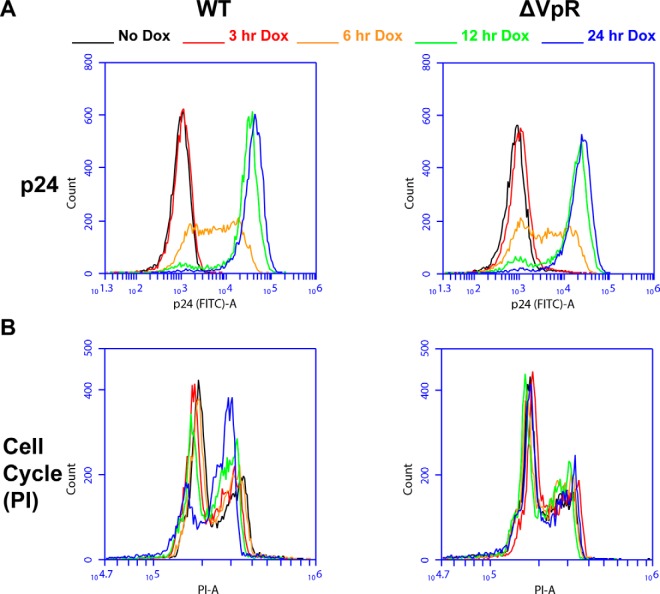
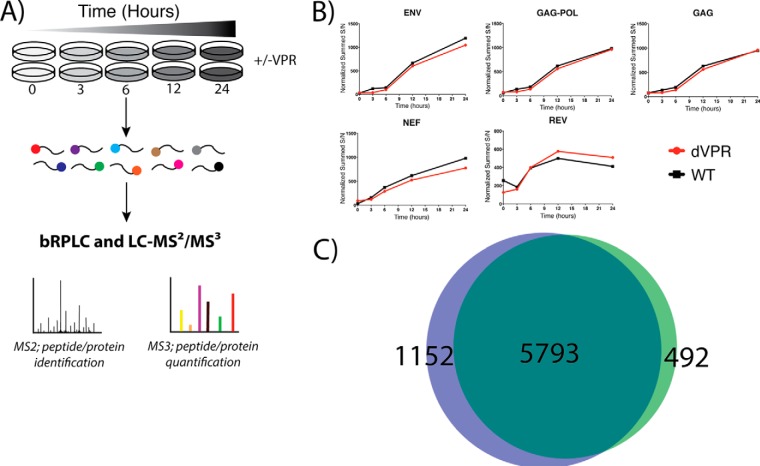
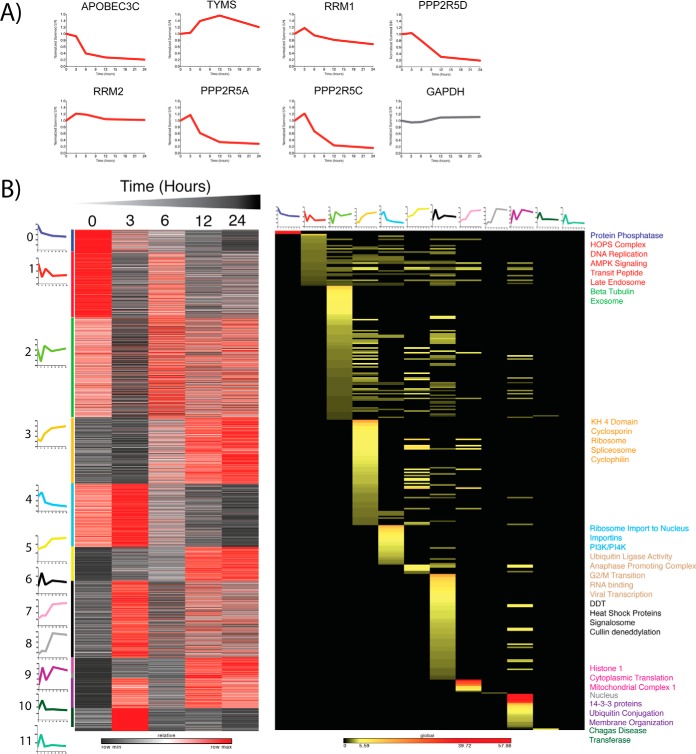
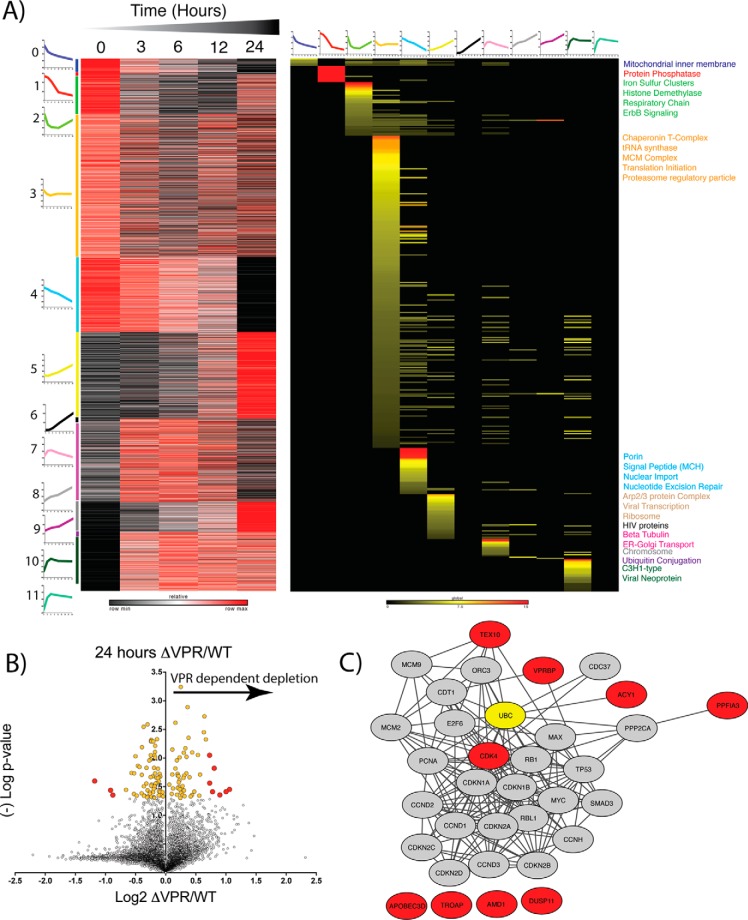
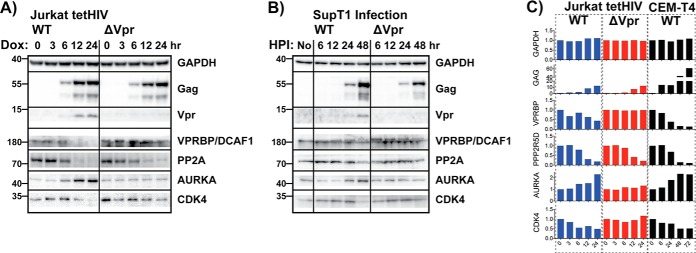
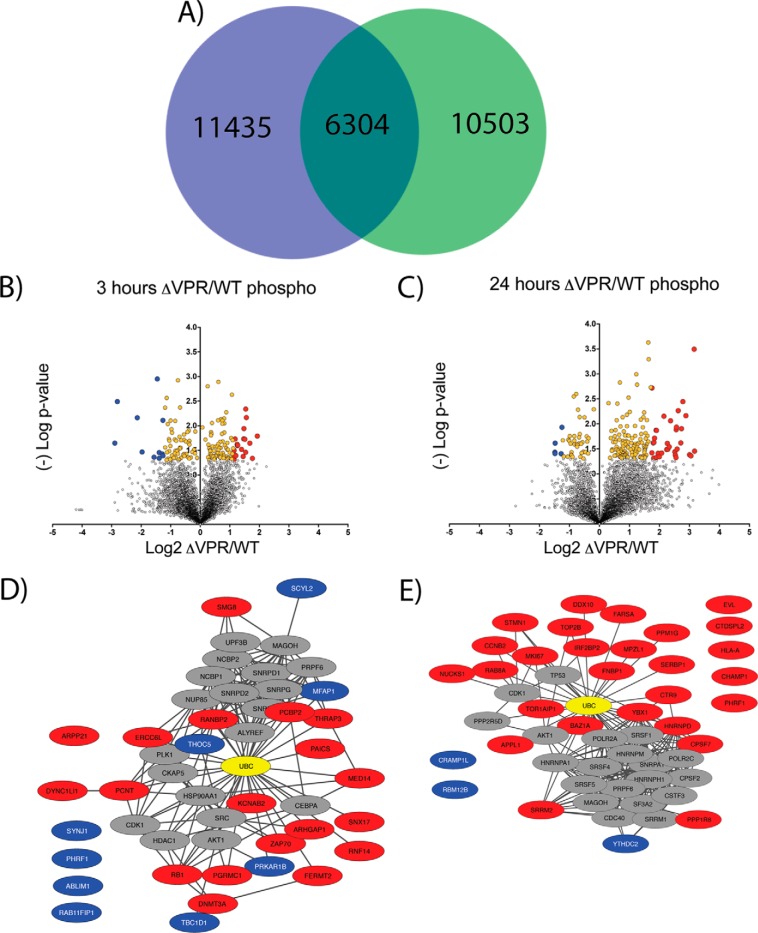
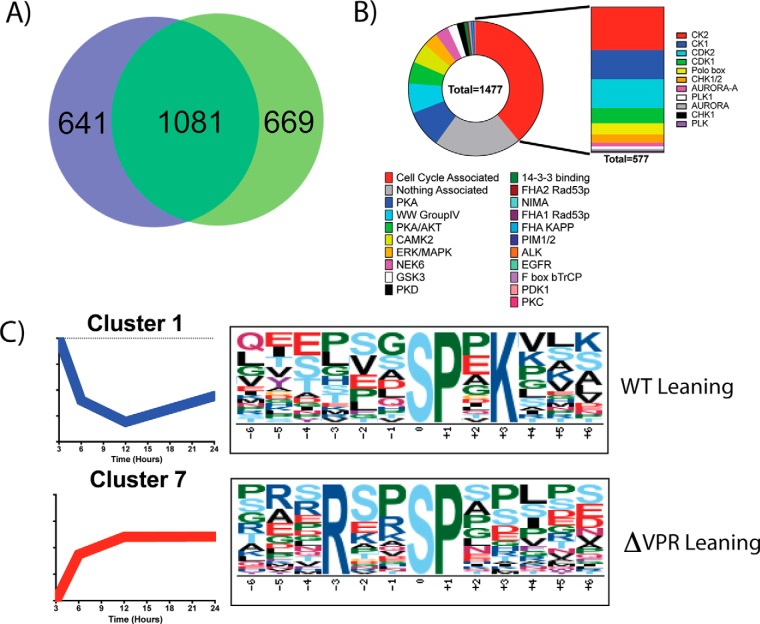
The mechanisms by which human immunodeficiency virus (HIV) circumvents and coopts cellular machinery to replicate and persist in cells are not fully understood. HIV accessory proteins play key roles in the HIV life cycle by altering host pathways that are often dependent on post-translational modifications (PTMs). Thus, the identification of HIV accessory protein host targets and their PTM status is critical to fully understand how HIV invades, avoids detection and replicates to spread infection. To date, a comprehensive characterization of HIV accessory protein host targets and modulation of their PTM status does not exist. The significant gap in knowledge regarding the identity and PTMs of HIV host targets is due, in part, to technological limitations. Here, we applied current mass spectrometry techniques to define mechanisms of viral protein action by identifying host proteins whose abundance is affected by the accessory protein Vpr and the corresponding modulation of down-stream signaling pathways, specifically those regulated by phosphorylation. By utilizing a novel, inducible HIV-1 CD4+ T-cell model system expressing either the wild type or a vpr-negative viral genome, we overcame challenges associated with synchronization and infection-levels present in other models. We report identification and abundance dynamics of over 7000 proteins and 28,000 phospho-peptides. Consistent with Vpr's ability to impair cell-cycle progression, we observed Vpr-mediated modulation of spindle and centromere proteins, as well as Aurora kinase A and cyclin-dependent kinase 4 (CDK4). Unexpectedly, we observed evidence of Vpr-mediated modulation of the activity of serine/arginine-rich protein-specific kinases (SRPKs), suggesting a possible role for Vpr in the regulation of RNA splicing. This study presents a new experimental system and provides a data-resource that lays the foundation for validating host proteins and phosphorylation-pathways affected by HIV-1 and its accessory protein Vpr.
© 2017 by The American Society for Biochemistry and Molecular Biology, Inc.
Conflict of interest statement
The content is solely the responsibility of the authors and does not necessarily represent the official views of the National Institutes of Health
Figures
Similar articles
-
Human Immunodeficiency Virus Type 1 Vpr Mediates Degradation of APC1, a Scaffolding Component of the Anaphase-Promoting Complex/Cyclosome.J Virol. 2021 Jul 12;95(15):e0097120. doi: 10.1128/JVI.00971-20. Epub 2021 Jul 12. J Virol. 2021. PMID: 34011540 Free PMC article.
-
HIV-1 Vpr redirects host ubiquitination pathway.J Virol. 2014 Aug;88(16):9141-52. doi: 10.1128/JVI.00619-14. Epub 2014 Jun 4. J Virol. 2014. PMID: 24899191 Free PMC article.
-
Dual regulation of L-selectin (CD62L) by HIV-1: Enhanced expression by Vpr in contrast with cell-surface down-modulation by Nef and Vpu.Virology. 2018 Oct;523:121-128. doi: 10.1016/j.virol.2018.07.031. Epub 2018 Aug 14. Virology. 2018. PMID: 30119013
-
Vpr-host interactions during HIV-1 viral life cycle.J Neuroimmune Pharmacol. 2011 Jun;6(2):216-29. doi: 10.1007/s11481-011-9261-z. Epub 2011 Feb 12. J Neuroimmune Pharmacol. 2011. PMID: 21318276 Free PMC article. Review.
-
HIV-1 Vpr Functions in Primary CD4+ T Cells.Viruses. 2024 Mar 9;16(3):420. doi: 10.3390/v16030420. Viruses. 2024. PMID: 38543785 Free PMC article. Review.
Cited by
-
Vpr and Its Cellular Interaction Partners: R We There Yet?Cells. 2019 Oct 24;8(11):1310. doi: 10.3390/cells8111310. Cells. 2019. PMID: 31652959 Free PMC article. Review.
-
A Cdk4/6-dependent phosphorylation gradient regulates the early to late G1 phase transition.Sci Rep. 2021 Jul 19;11(1):14736. doi: 10.1038/s41598-021-94200-w. Sci Rep. 2021. PMID: 34282211 Free PMC article.
-
Functional proteomic atlas of HIV infection in primary human CD4+ T cells.Elife. 2019 Mar 12;8:e41431. doi: 10.7554/eLife.41431. Elife. 2019. PMID: 30857592 Free PMC article.
-
De Novo Expressed Vpr Stimulates HIV-1 Replication in T Cells.Viruses. 2025 Jul 7;17(7):958. doi: 10.3390/v17070958. Viruses. 2025. PMID: 40733575 Free PMC article.
-
CLK1 reorganizes the splicing factor U1-70K for early spliceosomal protein assembly.Proc Natl Acad Sci U S A. 2021 Apr 6;118(14):e2018251118. doi: 10.1073/pnas.2018251118. Proc Natl Acad Sci U S A. 2021. PMID: 33811140 Free PMC article.
References
-
- UNAIDS. (2016) UNAIDS Fact Sheet 2016. 2016 Ed., Unaids.org
-
- Gisslen M., Svedhem V., Lindborg L., Flamholc L., Norrgren H., Wendahl S., Axelsson M., and Sonnerborg A. (2016) Sweden, the first country to achieve the Joint United Nations Programme on HIV/AIDS (UNAIDS)/World Health Organization (WHO) 90–90-90 continuum of HIV care targets. HIV Med. 18, 305–307 - PMC - PubMed
-
- Garcia F., Plana M., Vidal C., Cruceta A., O'Brien W. A., Pantaleo G., Pumarola T., Gallart T., Miro J. M., and Gatell J. M. (1999) Dynamics of viral load rebound and immunological changes after stopping effective antiretroviral therapy. AIDS 13, F79–F86 - PubMed
-
- Frankel A. D., and Young J. A. (1998) HIV-1: fifteen proteins and an RNA. Annu. Rev. Biochem. 67, 1–25 - PubMed
Publication types
MeSH terms
Substances
Grants and funding
LinkOut - more resources
Full Text Sources
Other Literature Sources
Medical
Research Materials
Miscellaneous
