. 2017 Sep 15;23(18):5561-5572.
doi: 10.1158/1078-0432.CCR-17-0369. Epub 2017 Jun 12.

Single-Cell Dynamics Determines Response to CDK4/6 Inhibition in Triple-Negative Breast Cancer

Affiliations

Single-Cell Dynamics Determines Response to CDK4/6 Inhibition in Triple-Negative Breast Cancer

Uzma S Asghar et al. Clin Cancer Res. .

Abstract

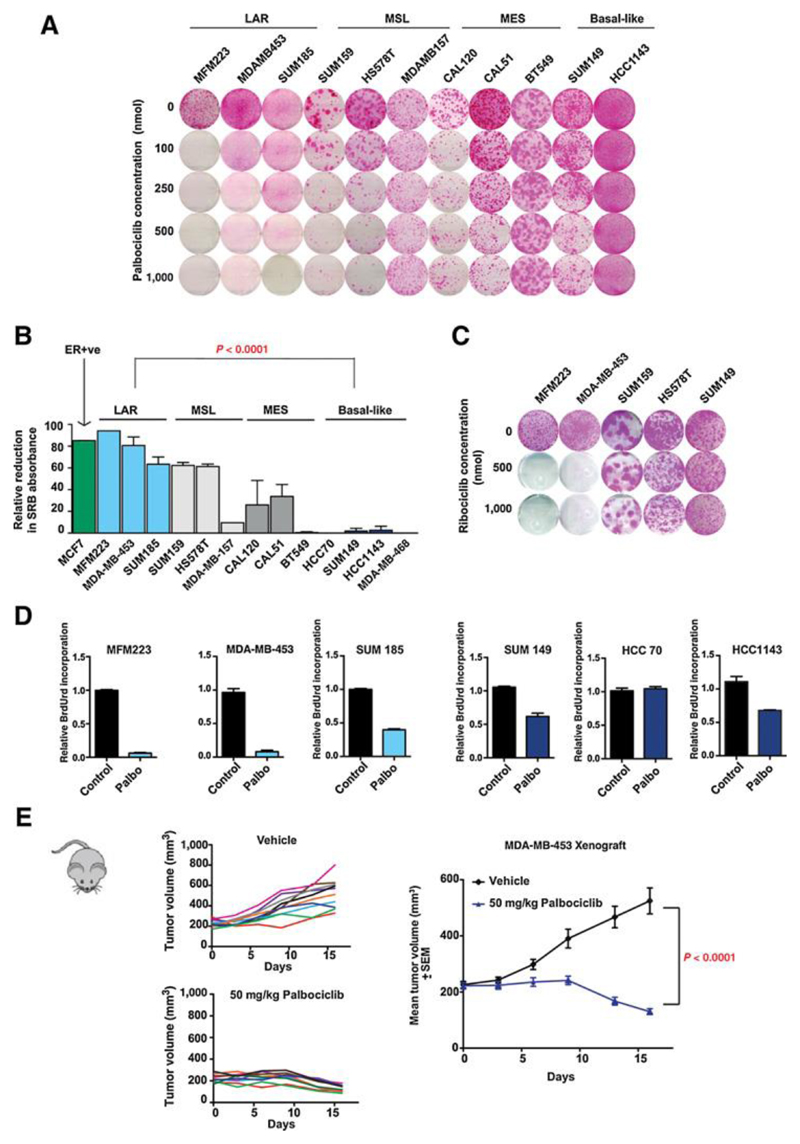
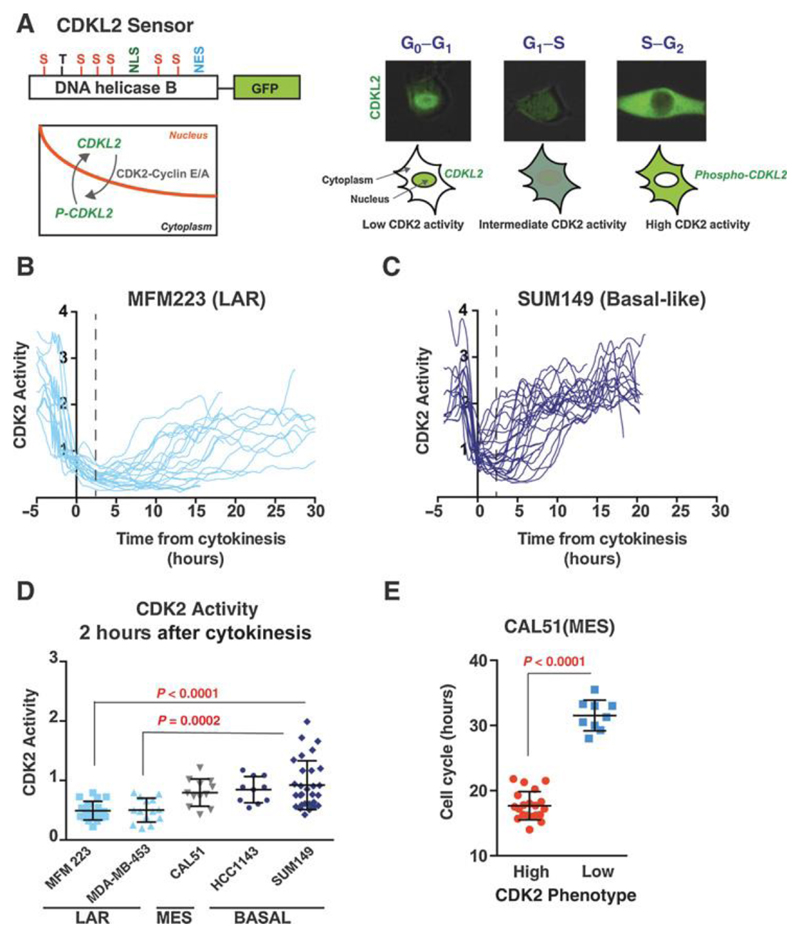
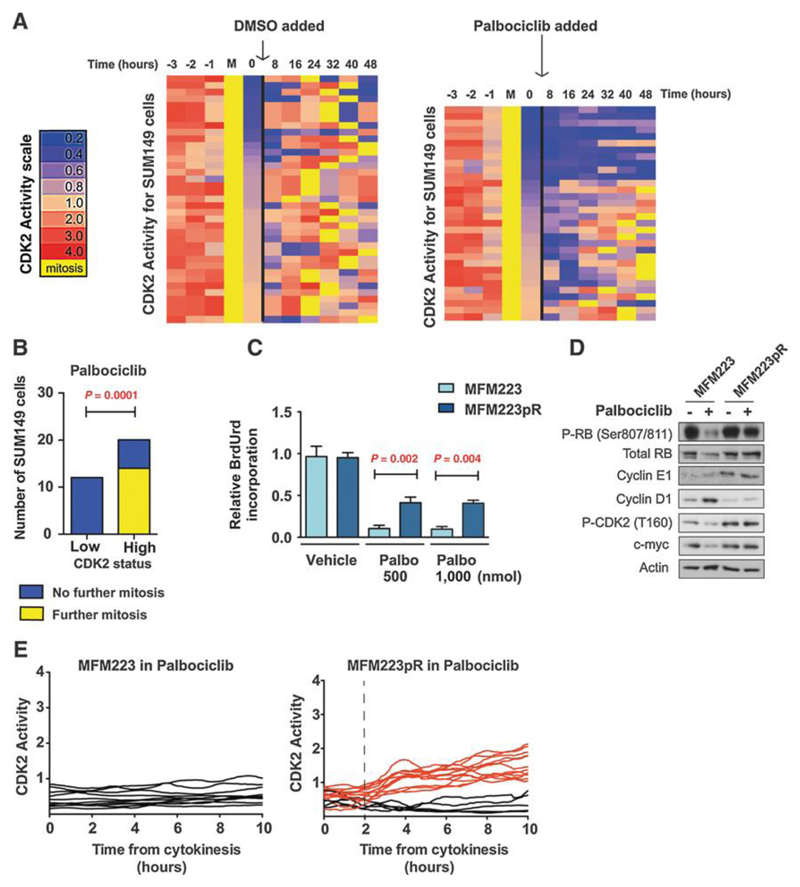
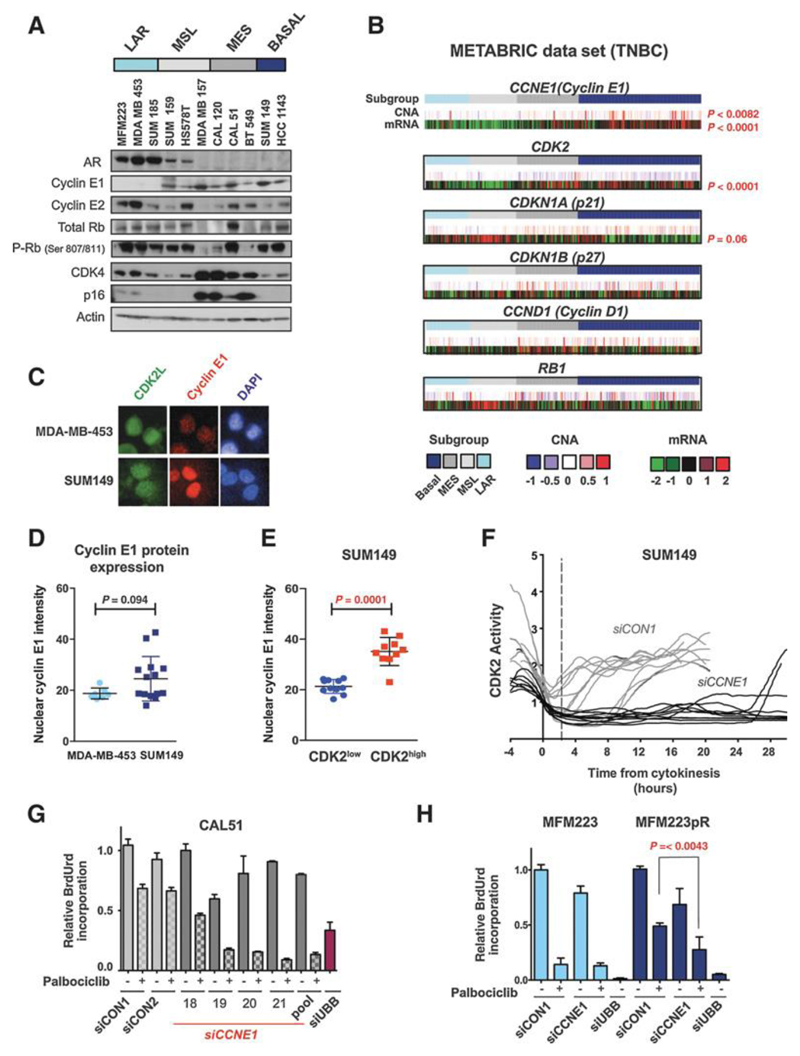
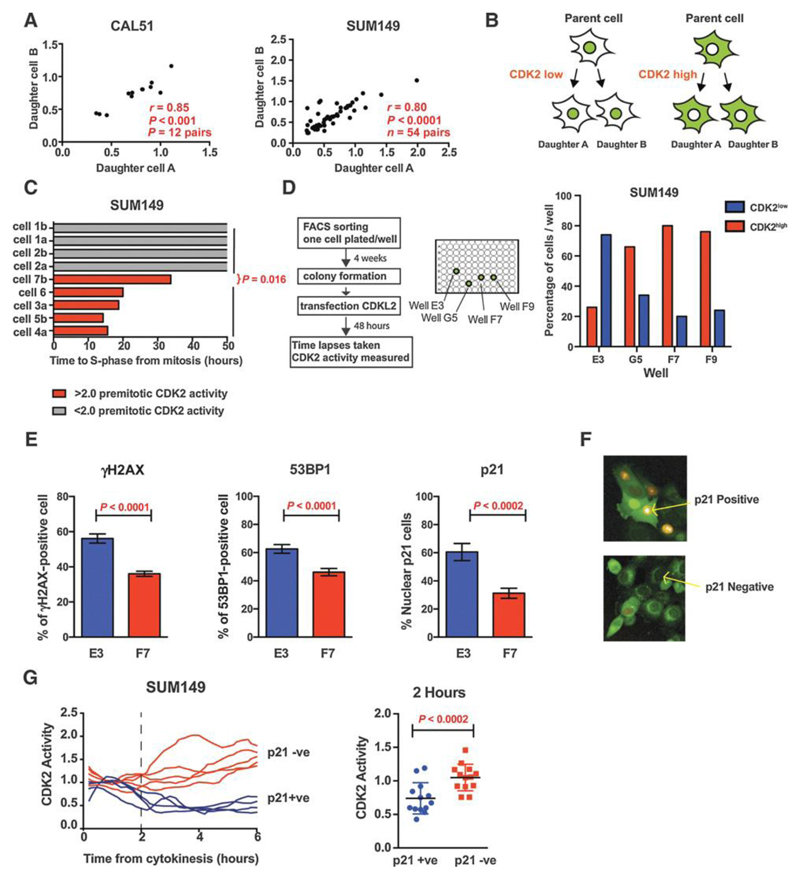
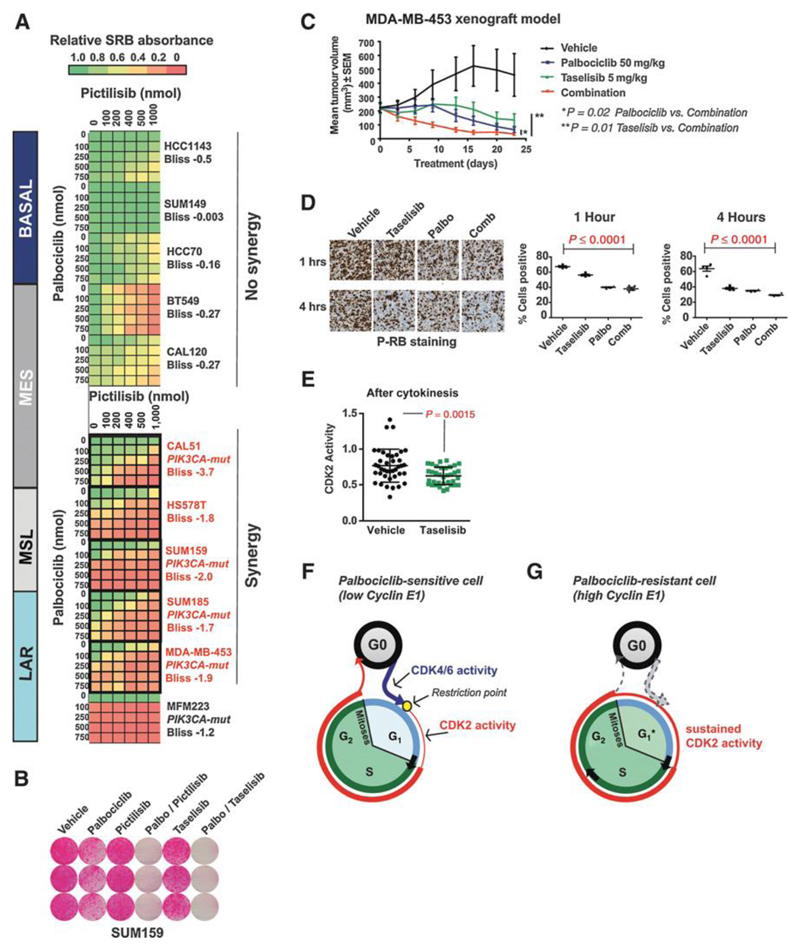
Purpose: Triple-negative breast cancer (TNBC) is a heterogeneous subgroup of breast cancer that is associated with a poor prognosis. We evaluated the activity of CDK4/6 inhibitors across the TNBC subtypes and investigated mechanisms of sensitivity.Experimental Design: A panel of cell lines representative of TNBC was tested for in vitro and in vivo sensitivity to CDK4/6 inhibition. A fluorescent CDK2 activity reporter was used for single-cell analysis in conjunction with time-lapse imaging.Results: The luminal androgen receptor (LAR) subtype of TNBC was highly sensitive to CDK4/6 inhibition both in vitro (P < 0.001 LAR vs. basal-like) and in vivo in MDA-MB-453 LAR cell line xenografts. Single-cell analysis of CDK2 activity demonstrated differences in cell-cycle dynamics between LAR and basal-like cells. Palbociclib-sensitive LAR cells exit mitosis with low levels of CDK2 activity, into a quiescent state that requires CDK4/6 activity for cell-cycle reentry. Palbociclib-resistant basal-like cells exit mitosis directly into a proliferative state, with high levels of CDK2 activity, bypassing the restriction point and the requirement for CDK4/6 activity. High CDK2 activity after mitosis is driven by temporal deregulation of cyclin E1 expression. CDK4/6 inhibitors were synergistic with PI3 kinase inhibitors in PIK3CA-mutant TNBC cell lines, extending CDK4/6 inhibitor sensitivity to additional TNBC subtypes.Conclusions: Cell-cycle dynamics determine the response to CDK4/6 inhibition in TNBC. CDK4/6 inhibitors, alone and in combination, are a novel therapeutic strategy for specific subgroups of TNBC. Clin Cancer Res; 23(18); 5561-72. ©2017 AACR.


Conflict of interest statement

Conflict of Interest:

Nicholas C. Turner has received research funding from Pfizer and Roche and is a consultant/advisory board member for Novartis, Pfizer, and Roche. Deepak Sampath, Jennifer Arca Lacap, Lisa Crocker and Amy Young are employees of Genentech, Roche group. The other authors disclosed no potential conflicts of interest.

Figures

Figure 1
Figure 1. Luminal androgen receptor subgroup (LAR) of TNBC is sensitive to CDK4/6 inhibition
A. Clonogenic assays of triple negative breast cancer (TNBC) cell lines grown continuously in increasing concentrations of palbociclib, divided by gene expression subtypes: LAR=luminal androgen receptor, MSL=mesenchymal stem like, MES=mesenchymal and basal-like. All cell lines are RB1 wild-type except RB1 mutant BT549. B. Sensitivity to 500nmol palbociclib across 13 TNBC cell lines in clonogenic assays from part A. LAR subtype is highly sensitive to CDK4/6 inhibition [p<0.0001 Student’s T test LAR vs. basal-like]. ER+ve MCF7 cells are shown as positive control of sensitivity to palbociclib. C. Clonogenic assays of 5 TNBC cell lines treated with the CDK4/6 inhibitor ribociclib. D. Relative BrdU incorporation after 72 hours with or without 500nmol palbociclib for LAR cell lines (MFM223, MDAMB453 and SUM185), and basal-like cell lines (SUM149, HCC70 and HCC1143). E. Xenografts of LAR MDA-MB-453 cells, treated daily with vehicle (n=10) or palbociclib (n=10) for 2 weeks. p<0.0001 Student’s T test vehicle vs. palbociclib at end of treatment..
Figure 2
Figure 2. Palbociclib-sensitive cell lines have low post-mitotic CDK2 activity
A. Left: Schematic of CDK2 activity live-cell sensor (CDK2L-GFP). CDK2 consensus phosphorylation sites shown: S=serine and T=threonine. NLS=nuclear localization signal. NES= nuclear export signal. Left. Phosphorylation of CDK2L-GFP sensor by active CDK2 leads to export from the nucleus to the cytoplasm. Right. Schematic of changes in sensor localisation through the cell cycle. CDK2 activity is at its highest during S/G2 phase of the cell cycle. Fluorescence images correspond to CDKL2-GFP in a single MFM223 cell. B. and C. Single cell CDK2 activity traces of B. palbociclib-sensitive LAR MFM223, n=20 cells, 20% CDK2high and C. palbocicilb-resistant basal-like SUM149, n=30 cells, 74% CDK2high. D. Post-mitotic (2 hours post-cytokinesis) CDK2 activity in individual cells from five TNBC cell lines. LAR MFM223 vs. basal-like SUM149 cell lines (Student’s T-test p<0.0001). LAR MDAMB453 vs. basal-like SUM149 (p<0.0002). LAR=luminal androgen receptor subgroup (light blue), MES=mesenchymal (grey) and BASAL=basal-like (dark blue). E. Cell cycle lengths (hours) in post-mitotic CDK2high vs. CDK2low subpopulations in CAL51 (p<0.0001 Student’s T test).
Figure 3
Figure 3. The proliferative CDK2high subpopulation drives resistance to CDK4/6 Inhibition at the single cell level
A. Cells with low CDK2 activity post-mitosis do not re-enter the cell cycle when exposed to palbociclib. Heat-map of CDK2 activity in individual SUM149 cells treated with vehicle (left; n=37) or palbociclib (right; n=32) added 1-3 hours post-cytokinesis. CDK2 activity was synchronized and aligned in silico to point of cytokinesis (mitosis, M, yellow). T=0 hours corresponds to CDK2 activity post-cytokinesis and prior to palbociclib/vehicle addition. Each row represents one single cell. Heat map is ordered by CDK2 activity post-mitosis. B. Quantification of cells undergoing a second mitosis in SUM149 cells exposed to palbociclib 1-3 hours post-mitosis as in part A, post-mitosis CDK2 activity CDK2high versus CDK2low. Cells that underwent a second mitosis (yellow) versus those that did not underwent a second mitosis (blue) during the tracking period (p=0.0001 Fisher’s exact test). C. Relative BrdU incorporation in MFM223 and MFM223pR treated with vehicle, palbociclib 500nmol and 1000nmol for 72 hours (Student’s T-test p<0.002 and p<0.004). D. Western blot of MFM223 and MFM223pR cells treated with vehicle or palbociclib 500nmol for 72 hours and probed with the indicated antibodies. E. Single cell CDK2 activity traces of cells grown in 500nmol Palbociclib Left: parental MFM223, Right: Palbocicilb-resistant MFM223pR. Red: Cells with CDK2 activity>1 at 10 hours (proliferating). Black: Cells with CDK2 activity <1 at 10 hours (quiescent).
Figure 4
Figure 4. High cyclin E1 expression post-mitosis drives high CDK2 activity and CDK4/6 inhibitor resistance.
A. Western blot of lysates from a panel of TNBC cell lines (n=11 cell lines), probed with the indicated antibodies (Not shown: Densitometry for LAR vs. non-LAR for androgen receptor (AR) p=0.01; Cyclin E1 p= 0.02; Mann-Whitney test). B. Copy number aberrations (CNA upper track) and gene expression (mRNA lower track) from 219 primary triple negative breast cancers, clustered according to gene expression subtypes: LAR (n=35); MSL (n=38); MES (n=49); Basal-like (n=97). P values generated from multiple t-tests (1% false discovery rate) for gene expression comparisons LAR vs. basal-like TNBC subtypes: Cyclin E1 (CCNE1) p<0.0001; CDK2 p<0.0001; CDKN1A (p21) p=0.06; CDKN1B (p27) p=0.23. Copy number gain LAR vs. basal-like: CCNE1 p=0.0082. Red: statistical significance. C. Immunofluorescent staining of nuclear cyclin E1 (red) in CDK2L positive (GFP) MDA-MB-453 cells and SUM149 cells 1 hour after mitosis. DAPI (blue). D. Cyclin E1 nuclear intensity assessed by immunofluorescence and quantified with Columbus software in individual cells 1-2 hours post-mitosis, in LAR MDAMB453 and Basal-like SUM149 cell lines (p= 0.094 Student’s T-test). E. Cyclin E1 nuclear intensity assessed by immunofluorescence in SUM149 cells 1-2 hours post-cytokinesis in CDK2low versus CDK2high cells (p value <0.0001 Student’s T-test). F. Single cell CDK2 activity traces of proliferating SUM149 cells transfected 72 hours earlier with siCON1 or siCCNE1. G. Relative BrdU incorporation in CAL51 cells transfected 72 hours earlier with siCON1, multiple individual CCNE1 siRNAs and siCCNE1 pool, treated with vehicle or palbociclib 500nmol. H. Relative BrdU incorporation in MFM223 and MFM223pR cells transfected with the indicated siRNAs and treated with vehicle or palbociclib.
Figure 5
Figure 5. Post-mitotic CDK2 activity is determined pre-mitosis
A. Correlation of CDK2 activity 2 hours post-cytokinesis between the daughter cell pairs generated in the same mitosis, in CAL51 (left) and SUM149 (right). B. Schematic illustrating shared levels of CDK2 activity between daughter cells. C. Time to S phase entry for SUM149 cells which divided between 0-2 hours after palbociclib was added. Pre-mitotic CDK activity (-2hrs) was measured in cells before palbociclib addition. Red: cells with pre-mitotic CDK2 activity >2; Grey: cells with pre-mitotic activity <2.0, none of which entered S phase by time-point 50 hours, post cytokinesis (p=0.016 Mann-Whitney). D. SUM149 cells were single cell sorted by FACS and clones expanded from single cells for 4 weeks before transfection with CDK2L-GFP sensor (left). Percentage of CDK2low and CDK2high SUM149 cells per well, 50 cells tracked per well (right). E. Percentage of cell positive for gamma H2AX (E3=total 860 cells; F7 =total 1508), 53BP1 (E3=total 719 cells; F7 =total 1298) and p21 (E3=total 275 cells; F7 =total 539) by immunofluorescence in the predominately CDK2low E3 clones and CDK2high F7 clone. F. Immunofluorescence staining of p21 (yellow) in SUM149 cells transfected with CDK2 biosensor (green) G. CDK2 activity in SUM149 cell in relation to the p21 staining status at 6 hours post-mitosis in SUM149 cells. Left: CDK2 activity traces and Right: CDK2 activity at 2 hours post cytokinesis, in p21 positive and p21 negative cells.
Figure 6
Figure 6. Inhibition of PI3 kinase signalling synergises with CDK4/6 inhibition in PIK3CA mutant TNBC.
A. Synergy heat maps matrices of clonogenic assays in TNBC cell lines treated with palbociclib and/or pictilisib (PI3 Kinase inhibitor) at increasing concentrations. Red: cell lines with combination synergy assessed using Bliss additivity score. PIK3CA mut = PIK3CA mutant. The lowest Bliss additivity score for each cell line is indicated. B. Clonogenic assays in PIK3CA mutant SUM159 MSL TNBC cell line grown in palbociclib 500nmol, pictilisib (pan-PI3 kinase inhibitor) 200nmol, taselisib (alpha specific PI3 kinase inhibitor) 100nmol, and indicated combinations. C. Mouse xenografts of LAR MDAMB453 cells, treated daily with vehicle (n=10), palbociclib (n=10), taselisib (n=10) or combination (n=10) (p=0.02 palbociclib vs. combination p=0.02; taselisib vs. combination p=0.01). Error bars are mean tumour volume and SD. D. Left: Immunohistochemistry of MDAMB453 mouse xenografts stained for phosphorylated RB1 (Ser807/811) after 1 and 4 hours of indicated drug treatment(s). Right: Scatter plots with percentage of positively stained cells for phosphorylated RB1 in IHC sections (left) after 1 hour and 4 hours treatment. E. CDK2 activity post-mitosis in PIK3CA mutant CAL51 treated with vehicle or taselisib 100nmol. F. Model of cell cycle dynamics in CDK2low cells. Cells exits mitosis into a quiescent state with CDK4/6 activity (blue) necessary to pass through the restriction point (yellow circle) after which CDK2 activity (red) promotes S phase entry. G. Model of cell cycle dynamics in CDK2high cells. Cells exit mitosis into an active proliferating state with high CDK2 activity, bypassing the restriction point, and CDK4/6 activity is not necessary to enter S phase. Consequently CDK2high cells, and cancers with a high proportion of CDK2high cells, are resistant to CDK4/6 inhibition.

References

    1. Hanahan D, Weinberg RA. Hallmarks of cancer: the next generation. Cell. 2011;144(5):646–74. - PubMed
    1. Asghar U, et al. The history and future of targeting cyclin-dependent kinases in cancer therapy. Nat Rev Drug Discov. 2015;14(2):130–46. - PMC - PubMed
    1. Finn RS, et al. The cyclin-dependent kinase 4/6 inhibitor palbociclib in combination with letrozole versus letrozole alone as first-line treatment of oestrogen receptor-positive, HER2-negative, advanced breast cancer (PALOMA-1/TRIO-18): a randomised phase 2 study. Lancet Oncol. 2015;16(1):25–35. - PubMed
    1. Turner NC, et al. Palbociclib in Hormone-Receptor-Positive Advanced Breast Cancer. N Engl J Med. 2015;373(3):209–19. - PubMed
    1. Finn RS, et al. Palbociclib and Letrozole in Advanced Breast Cancer. N Engl J Med. 2016;375(20):1925–1936. - PubMed

MeSH terms