. 2017 Jul 3;216(7):2091-2105.
doi: 10.1083/jcb.201701085. Epub 2017 Jun 12.

mTOR controls ChREBP transcriptional activity and pancreatic β cell survival under diabetic stress

Affiliations

mTOR controls ChREBP transcriptional activity and pancreatic β cell survival under diabetic stress

Gia Cac Chau et al. J Cell Biol. .

Abstract

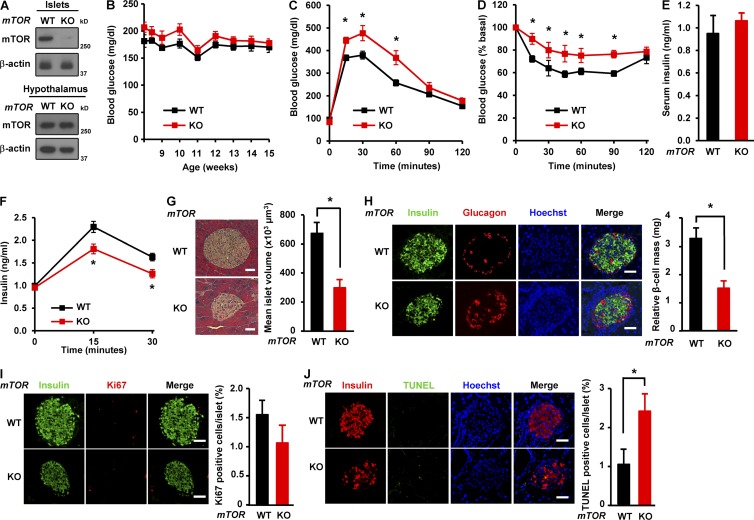
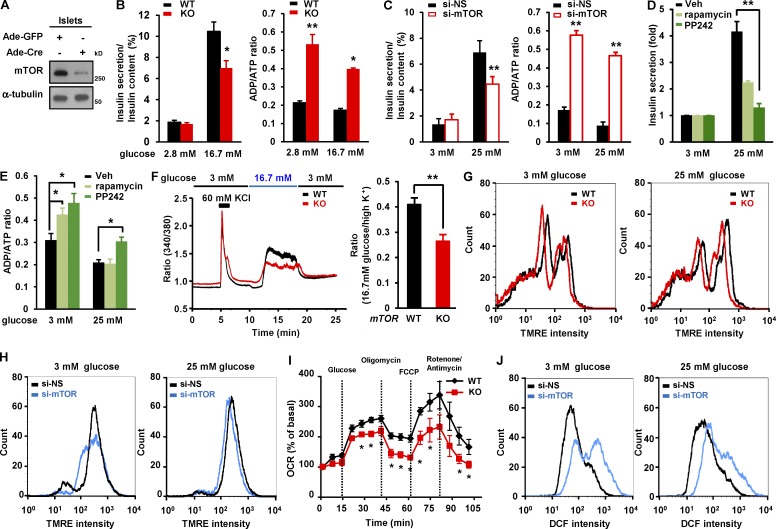
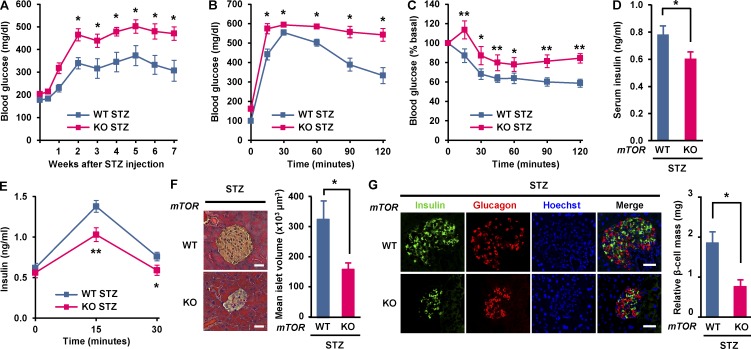
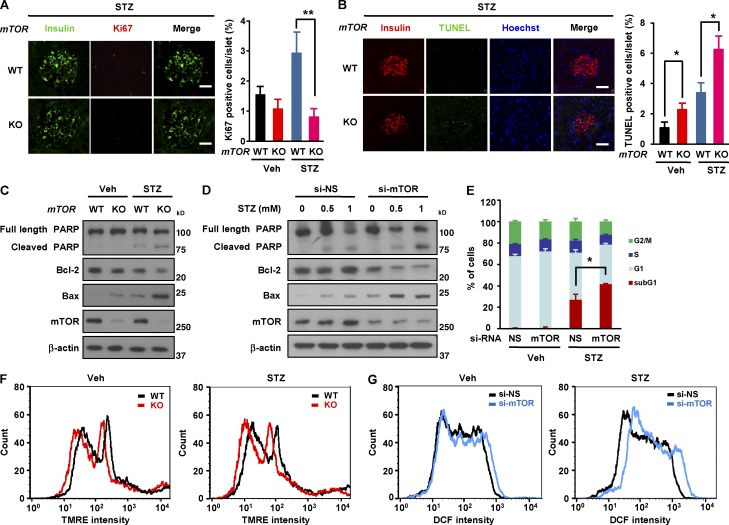
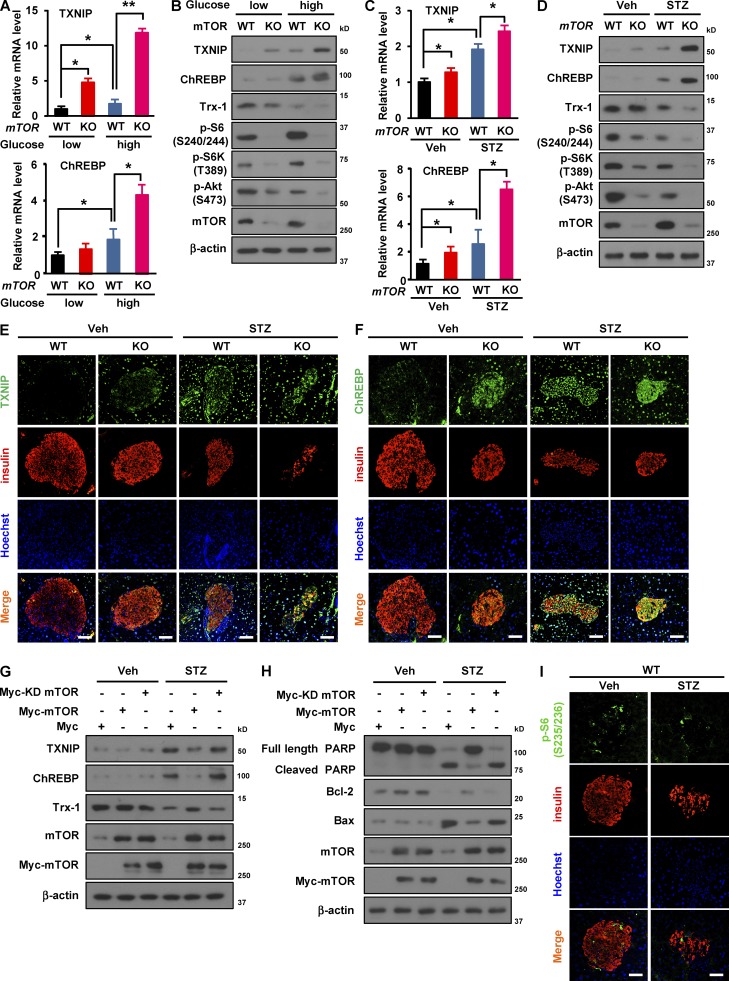
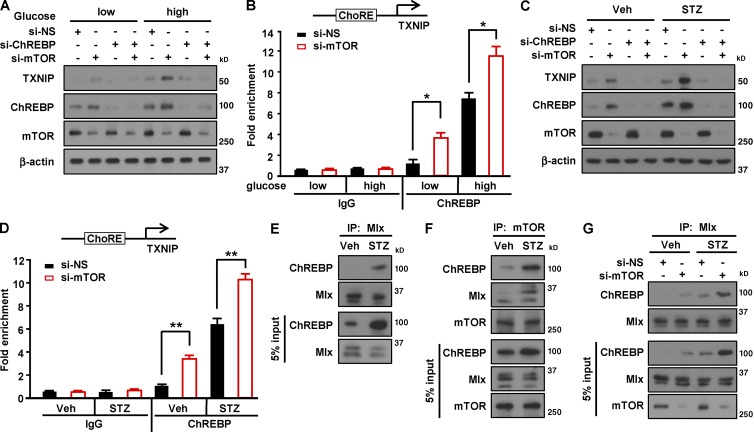
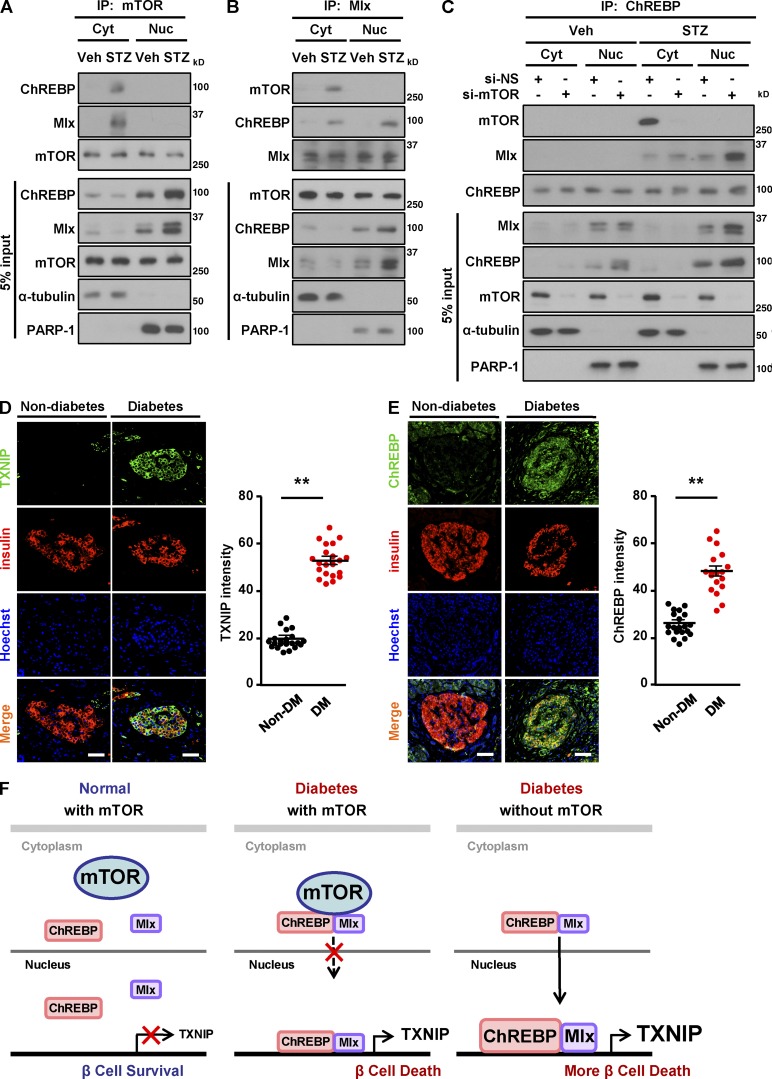
Impaired nutrient sensing and dysregulated glucose homeostasis are common in diabetes. However, how nutrient-sensitive signaling components control glucose homeostasis and β cell survival under diabetic stress is not well understood. Here, we show that mice lacking the core nutrient-sensitive signaling component mammalian target of rapamycin (mTOR) in β cells exhibit reduced β cell mass and smaller islets. mTOR deficiency leads to a severe reduction in β cell survival and increased mitochondrial oxidative stress in chemical-induced diabetes. Mechanistically, we find that mTOR associates with the carbohydrate-response element-binding protein (ChREBP)-Max-like protein complex and inhibits its transcriptional activity, leading to decreased expression of thioredoxin-interacting protein (TXNIP), a potent inducer of β cell death and oxidative stress. Consistent with this, the levels of TXNIP and ChREBP were highly elevated in human diabetic islets and mTOR-deficient mouse islets. Thus, our results suggest that a nutrient-sensitive mTOR-regulated transcriptional network could be a novel target to improve β cell survival and glucose homeostasis in diabetes.


Figures

Figure 1.
Figure 1.
β Cell–specific deficiency of mTOR leads to reduction in islet size and β cell mass. (A) Immunoblots showing mTOR expression in isolated islets and hypothalamus from WT (mTORflox/flox) or βmTOR knockout (KO) mice (mTORflox/floxRIP Cre). (B) Blood glucose levels were monitored weekly for 8 wk. (C) Glucose tolerance tests were performed in 12-wk-old mice (2 g glucose per kilogram body weight). (D) Insulin tolerance tests were performed in 12-wk-old mice (0.75 U insulin per kilogram body weight). (E) Serum insulin levels in 12 wk-old WT and mTOR-deficient mice fed standard chow. In B–E, WT, n = 8; knockout, n = 6. (F) Serum insulin levels were measured during glucose tolerance testing (WT, n = 7; knockout, n = 6). (G, left) Representative hematoxylin and eosin staining of pancreatic sections from WT and βmTORKO mice. Bars, 75 µm. (right) Mean islet volume was calculated in hematoxylin and eosin–stained pancreatic sections. (H, left) Immunofluorescence staining for insulin (green) or glucagon (red) in WT and βmTORKO mice; Nuclei are shown with Hoechst (blue) staining. Bars, 50 µm. (right) Relative β cell mass. (I) β Cell proliferation in WT and βmTORKO mice. (left) Representative immunofluorescence images of pancreatic sections from WT and βmTORKO mice using antibodies against insulin (green) or Ki67 (red). Bars, 50 µm. (right) β Cell proliferation was quantified by percentage of Ki67-positive cells. (J, left) Representative immunofluorescence images of mouse islets stained for TUNEL (green), or insulin (red). Nuclei are stained blue with Hoechst. Bars, 50 µm. (right) Quantification of TUNEL-positive islets in pancreatic sections. In G–J, 18 sections from six WT mice and 15 sections from five knockout mice were stained. In B–J, values are given as mean ± SEM. *, P < 0.05 versus WT (ANOVA).
Figure 2.
Figure 2.
mTOR deficiency in β cells leads to impaired nutrient dependent insulin secretion in β cells. (A) Immunoblots showing deletion of mTOR in primary islets. Isolated islets were infected with either Ad-GFP or Ad-Cre at an MOI of 25 for 48 h. (B) Glucose-stimulated insulin secretion and ADP/ATP ratio in WT and mTOR-deficient islets (n = 4 per group). (C) Insulin secretion and ADP/ATP ratio after mTOR depletion. INS-1 cells transfected with 10 nM si-NS or si-mTOR were incubated with 3 mM glucose or 25 mM glucose in KRBH buffer for 1 h. (D) Insulin secretion in rapamycin- or PP242-treated cells. INS-1 cells were treated with either 20 nM rapamycin or 1 µM PP242 for 24 h. (E) ADP/ATP ratio in rapamycin- or PP242-treated cells. (F) Glucose-induced Ca2+ influx in WT and mTOR-deficient islets. Representative trace (left) and quantification of [Ca2+]i with Fura-2 (right) in isolated islets stimulated with the indicated amounts of glucose (n = 5 per group). (G) Mitochondrial membrane potential in WT and mTOR-deficient islets (WT, n = 5; knockout [KO], n = 4). (H) Mitochondrial membrane potential in INS-1 cells after mTOR depletion. (I) Oxygen consumption rate (OCR) was measured in mTOR-deficient islets (n = 5 per group). (J) Histogram showing ROS levels in INS-1 cells after mTOR knockdown. In C, D, E, H, and J, n = 3 independent experiments; values are given as mean ± SEM. In C, D, and E, *, P < 0.05; **, P < 0.01 versus control (si-NS or vehicle; ANOVA). In B, F, and I, *, P < 0.05; **, P < 0.01 versus WT (ANOVA). DCF, Dicholorofluorescein; TMRE, tetramethylrhodamine ethyl ester; Veh, vehicle.
Figure 3.
Figure 3.
Deletion of mTOR in pancreatic β cells exacerbates the development of chemically induced diabetes. Vehicle (Veh) or STZ (100 mg/kg body weight) were administered twice a week for 2 wk. (A) Blood glucose levels were monitored weekly for 8 wk after STZ administration. (B) Glucose tolerance tests were performed 21 d after STZ injection. (C) Insulin tolerance tests were performed 21 d after STZ injection. (D) Serum insulin levels were measured in random fed WT and mTOR-deficient mice 21 d after STZ injection. In A–D, WT, n = 8; knockout [KO], n = 6. (E) Insulin secretion measured during glucose tolerance testing (WT, n = 7; knockout, n = 6). (F, left) Representative hematoxylin and eosin staining of pancreatic sections from WT and βmTORKO mice 8 wk after STZ injection. Bars, 75 µm. (right) Mean islet volume was calculated in hematoxylin and eosin–stained pancreatic sections. (G) β Cell number in WT and βmTORKO mice upon STZ exposure. (left) Immunofluorescence staining for insulin (green), or glucagon (red). Nuclei are shown with Hoechst (blue) staining. Bars, 50 µm. (right) Relative β cell mass. In F and G, 18 sections from six WT mice and 15 sections from five knockout mice were stained. In A–G, values are given as mean ± SEM. *, P < 0.05; **, P< 0.01 versus WT (ANOVA).
Figure 4.
Figure 4.
mTOR protects β cell survival in STZ-induced diabetes. (A, left) β Cell proliferation in WT and βmTORKO mice after 8 wk of STZ injection. Representative immunofluorescence images of pancreatic sections from WT and βmTORKO mice using antibodies against insulin (green) or Ki67 (red). (right) β Cell proliferation was quantified by percentage of Ki67-positive cells. Data for Veh group is from Fig. 1 I. (B, left) Representative immunofluorescence images of mouse islets stained for TUNEL (green), or insulin (red) 8 wk after STZ injection. Nuclei are stained blue with Hoechst. (right) Quantification of TUNEL positive islets in pancreatic sections. Data for Veh group is from Fig. 1 J. Bars, 50 µm. 18 sections from six WT mice and 15 sections from five knockout mice were stained. (C) Expression of apoptosis-related proteins in mouse islets after 1 mM STZ treatment for 6 h (n = 4 per group). (D) Expression of apoptosis-related proteins in INS-1 cells after treatment with 1 mM STZ. (E) Percentage of sub-G1 phase cells after mTOR depletion under STZ exposure (n = 5 per group). (F) Mitochondrial membrane potential in WT and mTOR-deficient islets after STZ treatment (n = 5 per group). (G) ROS levels after mTOR knockdown after STZ treatment (n = 3). In A, B, and E, values are given as mean ± SEM. *, P < 0.05 versus control (WT or si-NS); **, P < 0.01 versus WT (ANOVA).
Figure 5.
Figure 5.
Deficiency of mTOR induces expression of TXNIP and ChREBP in β cells upon metabolic stress. (A) TXNIP and ChREBP mRNA levels in WT and mTOR-deficient islets after low- (5 mM) or high-glucose (25 mM) treatment. (B) Immunoblots showing TXNIP and ChREBP expression in mouse islets under high-glucose treatment. (C) mRNA levels of TXNIP and ChREBP in WT and mTOR-deficient islets after STZ treatment. (D) Immunoblots showing TXNIP and ChREBP expression in mouse islets upon STZ treatment. In A–D, WT, n = 6; knockout (KO), n = 5. (E and F) Expression levels of TXNIP and ChREBP in WT and βmTORKO islets upon STZ exposure. Representative immunofluorescence images of pancreatic sections from WT mice after 8 wk of STZ injection using antibodies against TXNIP (green; E) or ChREBP (green; F) and insulin (red). Nuclei are shown with Hoechst (blue) staining. (G) Immunoblots showing expression of TXNIP and ChREBP in mTOR-overexpressing cells after STZ treatment. (H) Immunoblots showing levels of apoptosis-related proteins in mTOR-overexpressing cells. Myc-KD mTOR, Myc-kinase dead mTOR. (I) Phosphorylation of S6 protein (p-S6 Ser 235/236) upon STZ treatment. Representative immunofluorescence images of pancreatic sections from WT mice after 8 wk of STZ injection using antibodies against p-S6 (Ser 235/236) (green) and insulin (red). Nuclei are shown with Hoechst (blue) staining. In E, F, and I, bars, 50 µm; WT, n = 6; knockout, n = 5. In A and C, values are given as mean ± SEM of three independent experiments. *, P < 0.05; **, P < 0.01 versus WT (ANOVA).
Figure 6.
Figure 6.
mTOR interacts with the ChREBP–Mlx complex to inhibit its binding to TXNIP promoter. (A) Expression of TXNIP and ChREBP after mTOR knockdown after high-glucose treatment. (B) Binding affinity of ChREBP to TXNIP promoter in INS-1 cells transfected with si-NS or si-mTOR upon high-glucose treatment. (C) Expression of TXNIP and ChREBP after mTOR knockdown under STZ treatment. (D) Binding of ChREBP to the ChoRE region of TXNIP promoter in INS-1 cells transfected with si-NS or si-mTOR after STZ treatment. (E) Interaction between Mlx and ChREBP in INS-1 cells upon STZ treatment. INS-1 cells were incubated with 1 mM STZ for 2 h. (F) Binding between mTOR and ChREBP or Mlx in INS-1 cells after STZ exposure. (G) Interaction between ChREBP and Mlx in INS-1 cells after STZ treatment. In B and D, values are given as mean ± SEM of three independent experiments. *, P < 0.05; **, P < 0.01 versus si-NS (ANOVA). IP, immunoprecipitate; Veh, vehicle.
Figure 7.
Figure 7.
Increased expression levels of TXNIP and ChREBP in human diabetic islets. (A) Formation of ChREBP–Mlx complex after STZ treatment. (B) Translocation of the ChREBP–Mlx complex from the cytoplasm into the nucleus after STZ treatment. (C) Recruitment of the ChREBP–Mlx complex into the nucleus by mTOR knockdown after STZ treatment. (D) Increased expression levels of TXNIP in islets of nondiabetic and diabetic patients. (left) Representative pancreatic sections of nondiabetic control subjects and subjects with diabetes stained for TXNIP (green) and insulin (red). (right) Quantification of mean TXNIP intensity. (E) Enhanced expression levels of ChREBP in islets of diabetic patients. (left) Representative immunofluorescence images of human pancreatic sections from nondiabetic control subjects and subjects with diabetes using antibodies against ChREBP (green) and insulin (red). (right) Quantification of mean ChREBP intensity. (F) Proposed model of how mTOR regulates TXNIP expression and β cell survival in diabetic conditions. mTOR associates with the ChREBP–Mlx complex to inhibit its translocation into nucleus, blocking transcriptional activity, leading to the decrease in TXNIP transcription, and thereby protecting β cell survival upon STZ treatment. In D and E, nuclei are shown with Hoechst (blue) staining. Bars, 75 µm; non–diabetes mellitus (non-DM), n = 22 sections from 10 subjects; diabetes mellitus (DM), n = 16 sections from 7 subjects. Values are given as mean ± SEM. **, P < 0.01 versus non–diabetes mellitus (ANOVA). Cyt, cytoplasm; Nuc, nucleus; Veh, vehicle.

References

    1. Alejandro E.U., Gregg B., Wallen T., Kumusoglu D., Meister D., Chen A., Merrins M.J., Satin L.S., Liu M., Arvan P., and Bernal-Mizrachi E.. 2014. Maternal diet-induced microRNAs and mTOR underlie β cell dysfunction in offspring. J. Clin. Invest. 124:4395–4410. 10.1172/JCI74237 - DOI - PMC - PubMed
    1. Barlow A.D., Nicholson M.L., and Herbert T.P.. 2013. Evidence for rapamycin toxicity in pancreatic β-cells and a review of the underlying molecular mechanisms. Diabetes. 62:2674–2682. 10.2337/db13-0106 - DOI - PMC - PubMed
    1. Bar-Peled L., Schweitzer L.D., Zoncu R., and Sabatini D.M.. 2012. Ragulator is a GEF for the rag GTPases that signal amino acid levels to mTORC1. Cell. 150:1196–1208. 10.1016/j.cell.2012.07.032 - DOI - PMC - PubMed
    1. Bar-Peled L., Chantranupong L., Cherniack A.D., Chen W.W., Ottina K.A., Grabiner B.C., Spear E.D., Carter S.L., Meyerson M., and Sabatini D.M.. 2013. A Tumor suppressor complex with GAP activity for the Rag GTPases that signal amino acid sufficiency to mTORC1. Science. 340:1100–1106. 10.1126/science.1232044 - DOI - PMC - PubMed
    1. Bell E., Cao X., Moibi J.A., Greene S.R., Young R., Trucco M., Gao Z., Matschinsky F.M., Deng S., Markman J.F., et al. 2003. Rapamycin has a deleterious effect on MIN-6 cells and rat and human islets. Diabetes. 52:2731–2739. 10.2337/diabetes.52.11.2731 - DOI - PubMed

MeSH terms

LinkOut - more resources