. 2017 Jul 28;37(16):e00248-17.
doi: 10.1128/MCB.00248-17. Print 2017 Aug 15.

Targeting Oxygen-Sensing Prolyl Hydroxylase for Metformin-Associated Lactic Acidosis Treatment

Affiliations

Targeting Oxygen-Sensing Prolyl Hydroxylase for Metformin-Associated Lactic Acidosis Treatment

Tomoko Oyaizu-Toramaru et al. Mol Cell Biol. .

Abstract

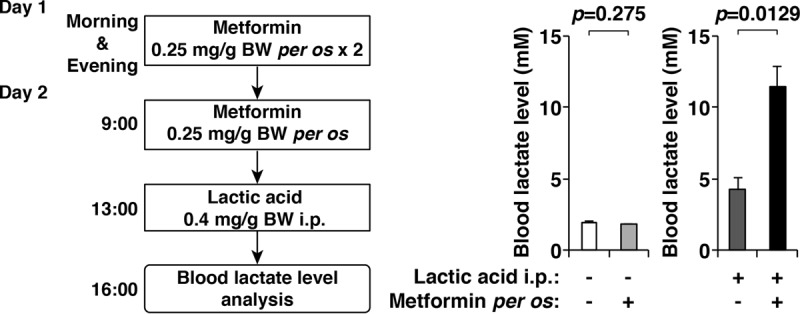
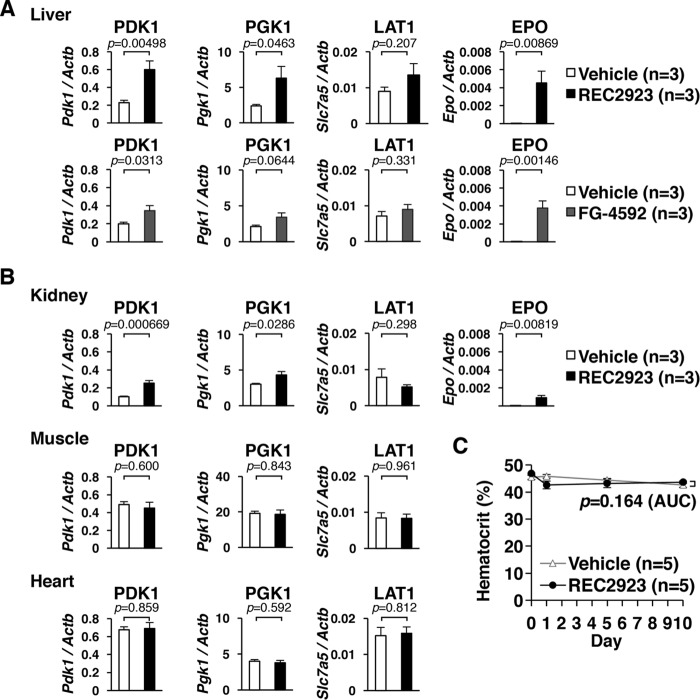
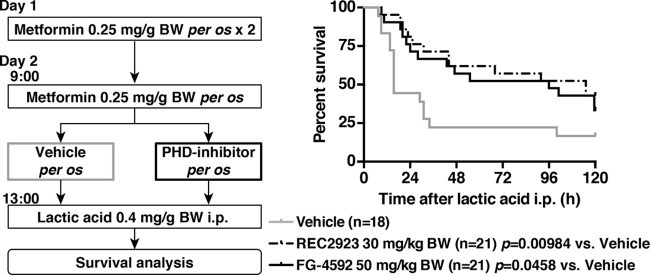
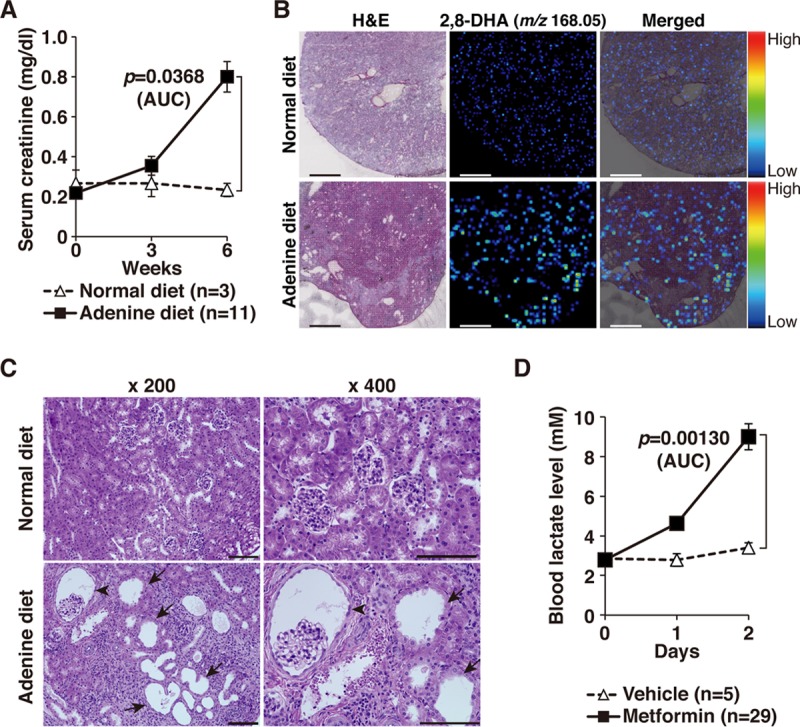
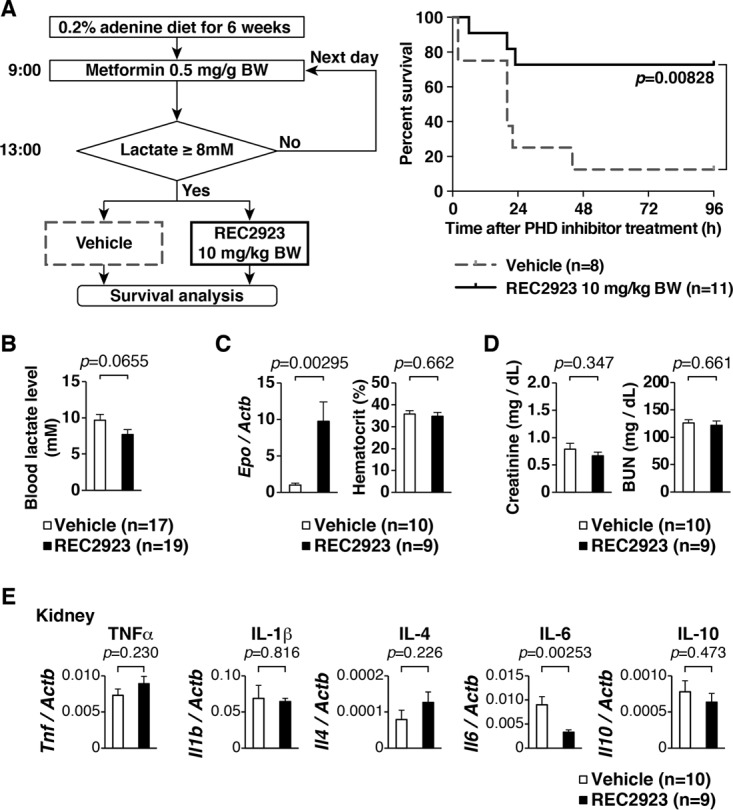
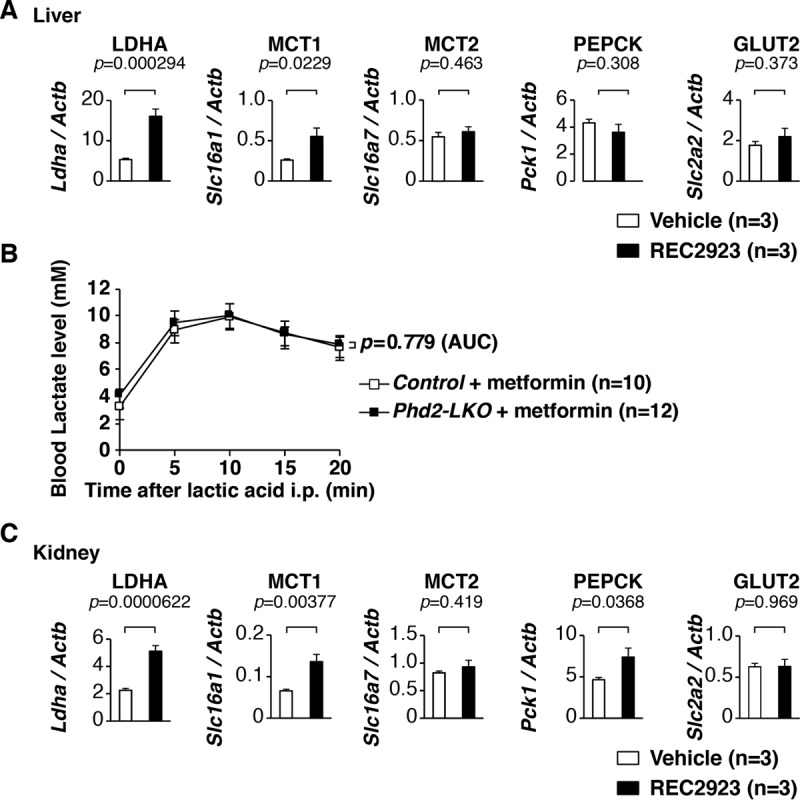
Metformin is one of the most widely used therapeutics for type 2 diabetes mellitus and also has anticancer and antiaging properties. However, it is known to induce metformin-associated lactic acidosis (MALA), a severe medical condition with poor prognosis, especially in individuals with renal dysfunction. Inhibition of prolyl hydroxylase (PHD) is known to activate the transcription factor hypoxia-inducible factor (HIF) that increases lactate efflux as a result of enhanced glycolysis, but it also enhances gluconeogenesis from lactate in the liver that contributes to reducing circulating lactate levels. Here, we investigated the outcome of pharmaceutical inhibition of PHD in mice with MALA induced through the administration of metformin per os and an intraperitoneal injection of lactic acid. We found that the PHD inhibitors significantly increased the expression levels of genes involved in gluconeogenesis in the liver and the kidney and significantly improved the survival of mice with MALA. Furthermore, the PHD inhibitor also improved the rate of survival of MALA induced in mice with chronic kidney disease (CKD). Thus, PHD represents a new therapeutic target for MALA, which is a critical complication of metformin therapy.

Keywords: CKD; Cori cycle; HIF; MALA; PHD; gluconeogenesis; hypoxia; lactic acidosis; metformin; prolyl hydroxylase.


Figures

FIG 1
FIG 1
Development of a mouse model of metformin-associated lactic acidosis (MALA). Blood lactate levels in mice with or without the administration of metformin per os and an intraperitoneal (i.p.) injection of lactic acid (n = 3 per treatment group) were determined (right). A detailed timetable of the experiment is also shown (left). Note that metformin exacerbated the hyperlactatemia that was induced by an i.p. injection of lactic acid. Error bars indicate 1 standard error of the mean. BW, body weight.
FIG 2
FIG 2
Tissue-dependent effects of prolyl hydroxylase (PHD) inhibitors administered per os in wild-type mice. (A) Real-time RT-PCR analysis of the direct hypoxia-inducible factor (HIF) target genes, Pdk1, Pgk1, Slc7a5 (L-type amino acid transporter 1 [LAT1]), and Epo, in the livers of mice after 4 h of administration per os of the vehicle (n = 3; 0.5% methyl cellulose), REC2923 (n = 3; 30 mg/kg body weight), or FG-4592 (n = 3; 50 mg/kg body weight). Error bars indicate 1 standard error of the mean. (B) Real-time RT-PCR analysis of the direct HIF target genes (Pdk1, Pgk1, and Slc7a5) in the kidneys, muscles, and hearts of C57BL/6J male mice after 4 h of administration per os of the vehicle (n = 3; 0.5% methyl cellulose) or REC2923 (n = 3; 30 mg/kg body weight). Epo was also analyzed in the kidneys. Error bars indicate 1 standard error of the mean. (C) Hematocrit levels of mice treated with either the vehicle (n = 5; 0.5% methyl cellulose) or REC2923 (n = 5; 30 mg/kg body weight) on day 0 (control), day 1 (after 4 h of treatment), day 5, and day 10 (left). The values of the area under the concentration-time curve (AUC) for each group were compared using an unpaired Student t test. Error bars indicate 1 standard error of the mean.
FIG 3
FIG 3
Treatment model of MALA with PHD inhibitors. A schematic of the treatment model of MALA with PHD inhibitors and the survival analysis are shown. Mice were administered metformin (0.25 mg/g body weight) with the vehicle (n = 18; 0.5% methyl cellulose), REC2923 (n = 21; 30 mg/kg body weight), or FG-4592 (n = 21; 50 mg/kg body weight) per os 4 h prior to an i.p. injection of lactic acid (0.4 mg/g body weight).
FIG 4
FIG 4
Generation of a mouse model of MALA in adenine-induced chronic kidney disease (CKD). (A) Serum creatinine levels in mice that were fed a normal diet (n = 3) or a 0.2% adenine-containing diet (n = 11) for the indicated time periods. The values for the area under the concentration-time curve (AUC) for each group were compared using an unpaired Student t test. Error bars indicate 1 standard error of the mean. (B) Imaging mass spectrometry (MALDI-IMS) analysis of 2,8-dihydroxy adenine (2,8-DHA; m/z 168.05) in the kidneys of the mice that were fed a normal or 0.2% adenine-containing diet for 6 weeks. Note that crystals of 2,8-dihydroxy adenine were detected in mice receiving the adenine-containing diet. Scale bar, 500 μm. (C) Histological analysis of the kidneys in the mice that were fed a normal diet or a 0.2% adenine-containing diet for 6 weeks. Representative data from three mice per treatment group are shown. Tubular dilation (arrows) and dilated Bowman's space (arrowhead) are observed in mice with adenine-induced CKD. Scale bar, 100 μm. (D) The CKD mice were administered a vehicle (n = 5; 0.5% methyl cellulose) or metformin (n = 29; 0.5 mg/g body weight) per os, and lactate levels were measured after 4 h. The experiment was repeated the following day. The values of the area under the concentration-time curve of each group were compared using an unpaired Student t test. Error bars indicate 1 standard error of the mean. H&E, hematoxylin and eosin.
FIG 5
FIG 5
Treatment model of MALA in CKD mice treated with a PHD inhibitor. (A) Schematic of the treatment of MALA in CKD mice and survival analysis of MALA in CKD mice that were treated with the vehicle or the PHD inhibitor REC2923. Mice were administered metformin (0.5 mg/g body weight) per os in the morning, and those with blood lactate levels of >8 mmol/liter after 4 h of metformin administration were then treated with either the vehicle (n = 8. 0.5% methyl cellulose) or the PHD inhibitor REC2923 (n = 11; 10 mg/kg body weight) per os. (B) Blood lactate levels of CKD mice after 6 h of treatment with the vehicle (n = 10; 0.5% methyl cellulose) or REC2923 (n = 9; 10 mg/kg body weight). Error bars indicate 1 standard error of the mean. (C) Real-time RT-PCR analysis of the direct HIF target gene Epo in the kidneys of CKD mice and hematocrit levels of CKD mice after 6 h of treatment with the vehicle or REC2923. Error bars indicate 1 standard error of the mean. (D) Serum creatinine and BUN levels in the CKD mice after 6 h of treatment with the vehicle or REC2923. Error bars indicate 1 standard error of the mean. (E) Real-time RT-PCR analysis of inflammatory mRNAs of Tnf, Il1b, Il4, Il6, and Il10 in CKD mice treated with the vehicle (n = 10) or REC2923 (n = 9). Error bars indicate 1 standard error of the mean. TNF-α, tumor necrosis factor alpha.
FIG 6
FIG 6
Upregulation of the mRNAs involved in gluconeogenesis in both the livers and kidneys of PHD inhibitor-treated mice. (A) Real-time RT-PCR analysis of the genes involved in gluconeogenesis, Ldha, Slc16a1 (monocarboxylate transporter 1 [MCT1] gene), Slc16a7 (MCT2 gene), Pck1, and Slc2a2 (glucose transporter 2 [GLUT2] gene), in the livers of C57BL/6J male mice after 4 h of administration per os of the vehicle (0.5% methyl cellulose; n = 3) or REC2923 (30 mg/kg body weight; n = 3). Error bars indicate 1 standard error of the mean. (B) Lactate tolerance test. Control (n = 10) and Phd2 liver-specific knockout (Phd2-LKO; n = 12) male mice were administered 0.25 mg/g body weight metformin dissolved in distilled water in the morning and evening of day 1 and in the morning of day 2 per os. After 4 h, the mice then received an i.p. injection of 0.4 mg/g body weight lactic acid, and blood lactate levels were measured at the indicated times. The values of the area under the concentration-time curve of each group were compared using an unpaired Student t test. Error bars indicate 1 standard error of the mean. (C) Real-time RT-PCR analysis of the genes involved in gluconeogenesis, Ldha, Slc16a1 (monocarboxylate transporter 1 [MCTs]), Slc16a7 (MCT2), Pck1, and Slc2a2 (glucose transporter 2 [GLUT2]), in the livers of C57BL/6J male mice after 4 h of administration per os of the vehicle (n = 3; 0.5% methyl cellulose) or REC2923 (n = 3; 30 mg/kg body weight). Error bars indicate 1 standard error of the mean.

Similar articles

Cited by

References

    1. Minamishima YA, Kaelin WG. 2010. Reactivation of hepatic EPO synthesis in mice after PHD loss. Science 329:407–407. doi:10.1126/science.1192811. - DOI - PMC - PubMed
    1. Suhara T, Hishiki T, Kasahara M, Hayakawa N, Oyaizu T, Nakanishi T, Kubo A, Morisaki H, Kaelin WG Jr, Suematsu M, Minamishima YA. 2015. Inhibition of the oxygen sensor PHD2 in the liver improves survival in lactic acidosis by activating the Cori cycle. Proc Natl Acad Sci U S A 112:11642–11647. doi:10.1073/pnas.1515872112. - DOI - PMC - PubMed
    1. Inzucchi SE, Lipska KJ, Mayo H, Bailey CJ, McGuire DK. 2014. Metformin in patients with type 2 diabetes and kidney disease: a systematic review. JAMA 312:2668–2675. doi:10.1001/jama.2014.15298. - DOI - PMC - PubMed
    1. Panzer U, Kluge S, Kreymann G, Wolf G. 2004. Combination of intermittent haemodialysis and high-volume continuous haemofiltration for the treatment of severe metformin-induced lactic acidosis. Nephrol Dial Transplant 19:2157–2158. doi:10.1093/ndt/gfh337. - DOI - PubMed
    1. Tanaka T, Doi K, Maeda-Mamiya R, Negishi K, Portilla D, Sugaya T, Fujita T, Noiri E. 2009. Urinary L-type fatty acid-binding protein can reflect renal tubulointerstitial injury. Am J Pathol 174:1203–1211. doi:10.2353/ajpath.2009.080511. - DOI - PMC - PubMed

MeSH terms

LinkOut - more resources