. 2017 Aug 11;37(17):e00060-17.
doi: 10.1128/MCB.00060-17. Print 2017 Sep 1.

Multiplication of Ribosomal P-Stalk Proteins Contributes to the Fidelity of Translation

Affiliations

Multiplication of Ribosomal P-Stalk Proteins Contributes to the Fidelity of Translation

Leszek Wawiórka et al. Mol Cell Biol. .

Abstract

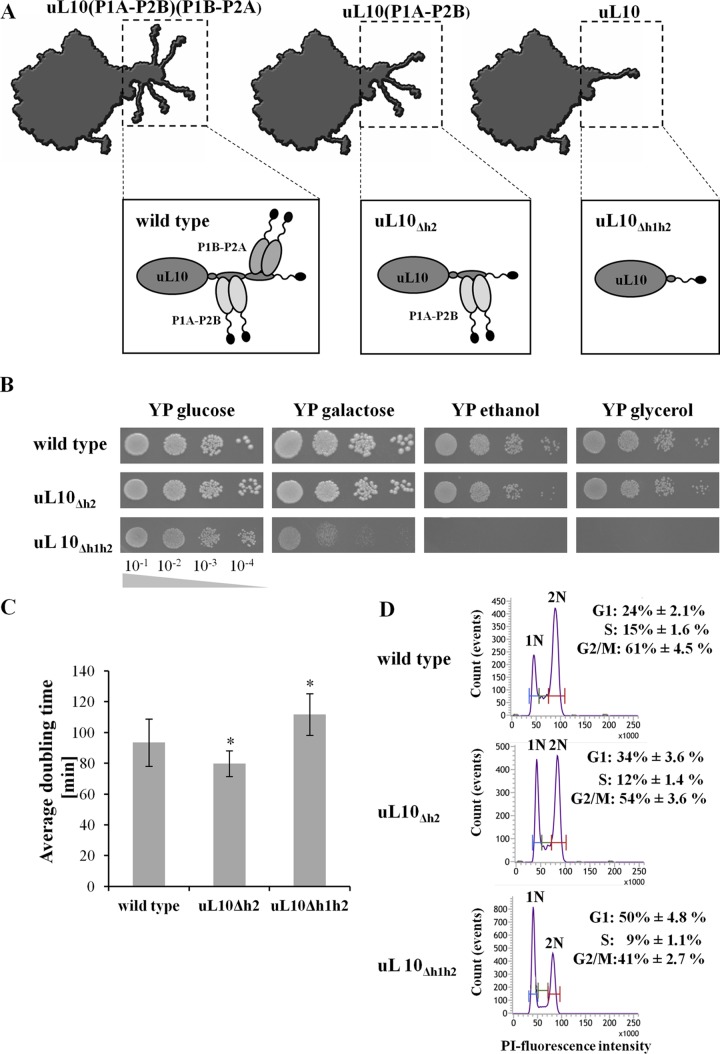
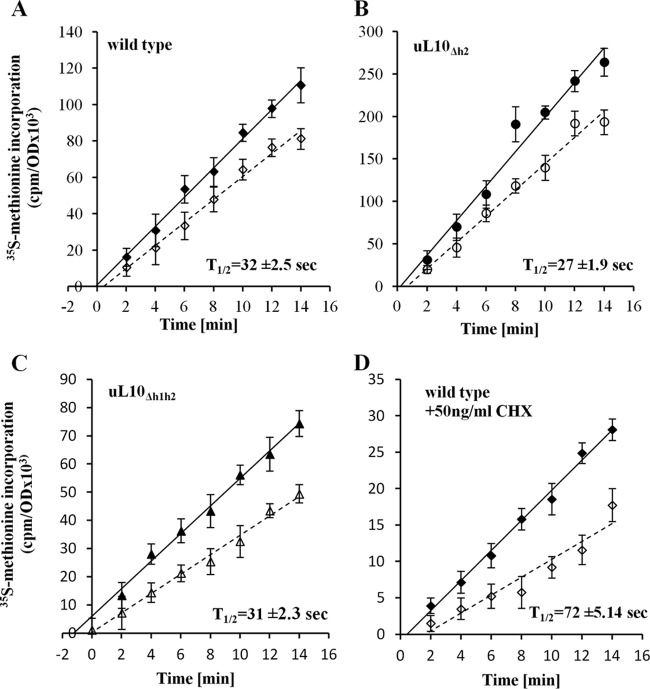
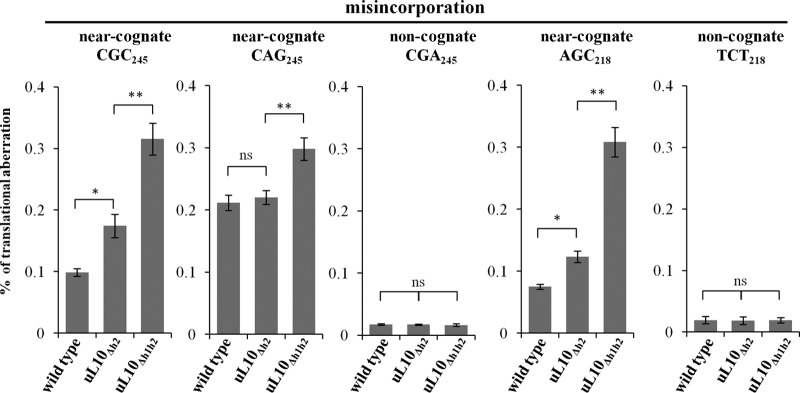
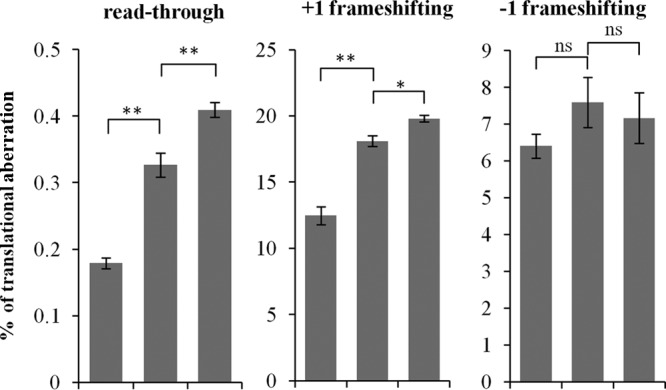
The P-stalk represents a vital element within the ribosomal GTPase-associated center, which represents a landing platform for translational GTPases. The eukaryotic P-stalk exists as a uL10-(P1-P2)2 pentameric complex, which contains five identical C-terminal domains, one within each protein, and the presence of only one such element is sufficient to stimulate factor-dependent GTP hydrolysis in vitro and to sustain cell viability. The functional contribution of the P-stalk to the performance of the translational machinery in vivo, especially the role of P-protein multiplication, has never been explored. Here, we show that ribosomes depleted of P1/P2 proteins exhibit reduced translation fidelity at elongation and termination steps. The elevated rate of the decoding error is inversely correlated with the number of the P-proteins present on the ribosome. Unexpectedly, the lack of P1/P2 has little effect in vivo on the efficiency of other translational GTPase (trGTPase)-dependent steps of protein synthesis, including translocation. We have shown that loss of accuracy of decoding caused by P1/P2 depletion is the major cause of translation slowdown, which in turn affects the metabolic fitness of the yeast cell. We postulate that the multiplication of P-proteins is functionally coupled with the qualitative aspect of ribosome action, i.e., the recoding phenomenon shaping the cellular proteome.

Keywords: ribosomal proteins; ribosomal stalk; ribosome.


Figures

FIG 1
FIG 1
Phenotype analysis of the mutant yeast strains. (A) Schematic representation of the genetically engineered 60S ribosomal subunits with an altered stalk structure: wild type, 60S ribosomal subunit with the intact yeast stalk uL10(P1A-P2B)(P1B-P2A); uL10Δh2 and uL10Δh1h2 mutant strains, 60S with a stalk lacking marginal P1B-P2A or all P1/P2 proteins, respectively; the black blobs represents conserved C-terminal oligopeptides. (B) Growth of mutant yeast strains on various carbon sources. Yeast cells were spotted onto agar plates with YP medium supplemented with various carbon sources as indicated; growth was continued for 3 days. (C) Doubling time determination. The results are presented as the mean ± standard deviation; asterisks indicate statistically significant differences at a P of <0.001 determined using Student's t test. (D) Flow cytometry PI fluorescence intensity histograms of the yeast cell cycle; 1N and 2N represent haploid and diploid cell populations, respectively. The inset shows signal distribution between G1, S, and G2/M phases expressed in percentages; the values are means ± SD (n = 3).
FIG 2
FIG 2
Determination of translational fitness and polysome profile analysis. (A) Measured kinetics of [35S]methionine incorporation into newly synthesized polypeptides, as indicated with arrows. Error bars represent standard deviations obtained from three independent experiments. Inset, translational impairment with respect to the control wild-type cells expressed as 100%, determined based on the slope value for individual graphs. Error bars, standard errors of the mean (SEM) (n = 3); *, P < 0.05 by Student's t test. (B to D) Polysome profile analyses using equal numbers of cells. Each inset shows the following: the total surface area that was calculated for all 40S, 60S, and 80S peaks and four polysomal peaks, the polysome-to-monosome (P/M) ratio that was calculated for each profile by dividing the area of the first four polysomal peaks by the area of the peak for the 80S monosome, and the 40S/60S ratio. All values, i.e., total surface area, P/M ratio, and ratio of individual 40/60 subunits are shown in each panel as means ± SD (n = 3). The sedimentation vector of the ribosomal fractions is indicated by a horizontal arrow, and the optical density value at 254 nm is shown on the y axis; the positions of individual ribosomal subunits are indicated in panel D.
FIG 3
FIG 3
Polysome profile analysis under runoff conditions. (A, C, and E) Control polysome profiles from the wild-type and uL10Δh2 and uL10Δh1h2 strains in the presence of CHX. (B, D, and F) Runoff experiments in the absence of CHX. The insets show the polysome-to-monosome (P/M) ratio calculated for each profile by dividing the area of the first three polysomal peaks by the area of the peak for the 80S monosome. The P/M ratio and 40S/60S ratio are shown in each panel as means ± SD (n = 3). The sedimentation vector of the ribosomal fractions is indicated by a horizontal arrow, and the optical density at 254 nm is indicated by a vertical arrow. The positions of individual ribosomal subunits are indicated in panel A.
FIG 4
FIG 4
Ribosomal half-transit time. The incorporation of [35S]methionine into total proteins (nascent and completed) (filled symbols) and completed proteins (open symbols) is shown for each strain. The half-transit time was measured as the displacement between two lines by linear regression analysis and is shown in each panel as an inset. t1/2 values are means ± SD (n = 3). (A to C) Half-transit times determined for the wild-type (A), uL10Δh2 (B), and uL10Δh1h2 (C) strains. (D) Measured half-transit time for the wild-type strain in the presence of a low dose of 50 ng/ml CHX. Error bars represent standard deviations obtained from three independent experiments.
FIG 5
FIG 5
Antibiotic sensitivity test with inhibitors acting on the elongation cycle of protein synthesis. (A) The wild-type and mutant strains were spotted onto YPD agar plates as a serial 10-fold dilution of the original cell culture with an OD600 of 0.1 and grown for 3 days. The medium was supplemented with 100 μg/ml G418, 100 μg/ml HygB, 250 μg/ml Par, 0.1 μg/ml CHX, and 2 μg/ml Sor. (B) Growth of wild-type and mutant yeast strains on glucose, ethanol, or glycerol as the only carbon source; the growth medium was supplemented with 100 μg/ml G418. Yeast cells were cultivated as described for panel A.
FIG 6
FIG 6
Effect of G418 on the BY4741 wild-type strain. (A) Translational fitness determined as a function of [35S]methionine incorporation in the presence of a sublethal dose of G418 (100 μg/ml). wt, wild-type strain. Error bars represent standard deviations obtained from three independent experiments. Inset, translational efficiency normalized to nontreated cells; error bars, SEM (n = 3); *, P < 0.01, Student's t test. (B) Half-transit time determined for the wild-type strain in the presence of 100 μg/ml G418. (C) Polysome profile from wild-type cells grown in the presence of 100 μg/ml G418 and stalled with CHX. (D) Polysome profile analysis under runoff conditions. (E and F) Polysome profile analyses using equal numbers of cells. The analysis was done as described in the legend to Fig. 2.
FIG 7
FIG 7
Misincorporation analysis using a dual-luciferase reporter assay. CGC245, CAG245, and AGC218 describe near-cognate codons at positions 245 and 218 of the firefly reporter enzyme; CGA245 and TCT218 represent the noncognate codons used at the respective positions within the firefly reporter enzyme. All data are presented as the percentage of translational aberration; error bars represent standard deviations. Statistical significance of differences assessed using the one-way analysis of variance (ANOVA) method, followed by the post hoc Tukey honest significant difference (HSD) test, is indicated by asterisks: *, P < 0.01; **, P < 0.001; ns, not significant.
FIG 8
FIG 8
Read-through and −1/+1 programmed frameshifting (PRF) analysis using a dual-luciferase reporter assay. All data are presented as the percentage of translational aberration. Error bars represent standard deviations. Statistical significance of differences assessed using one-way ANOVA method, followed by the post hoc Tukey HSD test, is indicated by asterisks: *, P < 0.01; **, P < 0.001; ns, not significant.
FIG 9
FIG 9
Complementation experiment of the uL10Δh1h2 mutant strain and wild-type cells. (A) Growth of uL10Δh1h2 yeast mutant and wild-type strains on SD−Ura medium supplemented with various carbon sources; the cells were transformed with an empty vector (vector control [VC]) or with a vector bearing genes for full-length uL10 or truncated uL10Δh1h2; yeast cells were spotted onto agar plates and cultivated for 3 days in the absence or presence of doxycycline (DOX) in order to induce or suppress expression of the uL10 or uL10Δh1h2 genes. (B) Western blotting of the full-length and truncated uL10 protein using specific polyclonal anti-uL10 antibodies; two fractions were analyzed, the total ribosomal fraction and the cytoplasmic fraction deprived of ribosomes.

Similar articles

Cited by

References

    1. Maracci C, Rodnina MV. 2016. Review: translational GTPases. Biopolymers 105:463–475. doi:10.1002/bip.22832. - DOI - PMC - PubMed
    1. Liljas A, Ehrenberg M. 2013. Structural aspects of protein synthesis, 2nd ed World Scientific, Singapore.
    1. Diaconu M, Kothe U, Schlunzen F, Fischer N, Harms JM, Tonevitsky AG, Stark H, Rodnina MV, Wahl MC. 2005. Structural basis for the function of the ribosomal L7/12 stalk in factor binding and GTPase activation. Cell 121:991–1004. doi:10.1016/j.cell.2005.04.015. - DOI - PubMed
    1. Wahl MC, Moller W. 2002. Structure and function of the acidic ribosomal stalk proteins. Curr Protein Pept Sci 3:93–106. doi:10.2174/1389203023380756. - DOI - PubMed
    1. Gonzalo P, Reboud JP. 2003. The puzzling lateral flexible stalk of the ribosome. Biol Cell 95:179–193. doi:10.1016/S0248-4900(03)00034-0. - DOI - PubMed

MeSH terms

LinkOut - more resources