

Drivers of expenditure on primary care prescription drugs in 10 high-income countries with universal health coverage
- PMID: 28606975
- PMCID: PMC5468103
- DOI: 10.1503/cmaj.161481
Drivers of expenditure on primary care prescription drugs in 10 high-income countries with universal health coverage
Abstract
Background: Managing expenditures on pharmaceuticals is important for health systems to sustain universal access to necessary medicines. We sought to estimate the size and sources of differences in expenditures on primary care medications among high-income countries with universal health care systems.
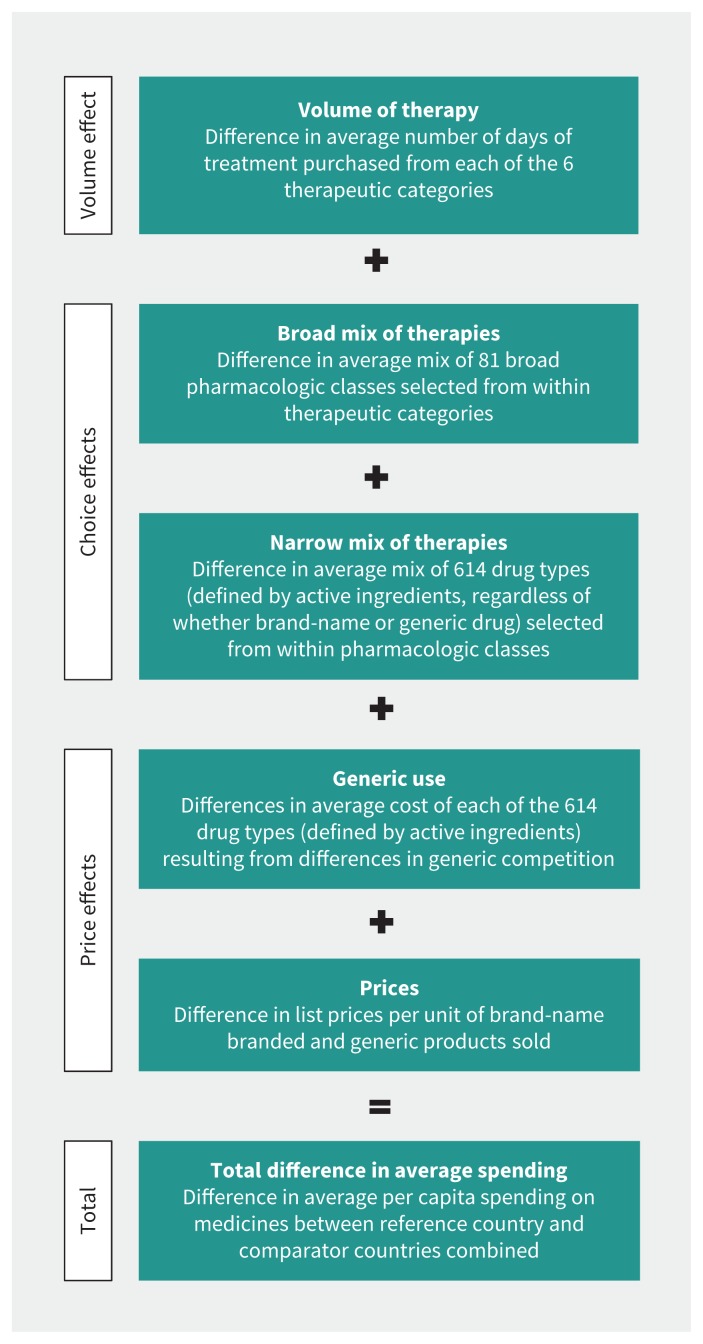
Methods: We compared data on the 2015 volume and cost per day of primary care prescription drug therapies purchased in 10 high-income countries with various systems of universal health care coverage (7 from Europe, in addition to Australia, Canada and New Zealand). We measured total per capita expenditure on 6 categories of primary care prescription drugs: hypertension treatments, pain medications, lipid-lowering medicines, noninsulin diabetes treatments, gastrointestinal preparations and antidepressants. We quantified the contributions of 5 drivers of the observed differences in per capita expenditures.
Results: Across countries, the average annual per capita expenditure on the primary care medicines studied varied by more than 600%: from $23 in New Zealand to $171 in Switzerland. The volume of therapies purchased varied by 41%: from 198 days per capita in Norway to 279 days per capita in Germany. Most of the differences in average expenditures per capita were driven by a combination of differences in the average mix of drugs selected within therapeutic categories and differences in the prices paid for medicines prescribed.
Interpretation: Significant international differences in average expenditures on primary care medications are driven primarily by factors that contribute to the average daily cost of therapy, rather than differences in the volume of therapy used. Average expenditures were lower among single-payer financing systems that appeared to promote lower prices and the selection of lower-cost treatment options.
© 2017 Canadian Medical Association or its licensors.
Conflict of interest statement
Competing interests: None declared.
Figures
Comment in
-
Drug prices: How do we get to a better place?CMAJ. 2017 Jun 12;189(23):E792-E793. doi: 10.1503/cmaj.170440. CMAJ. 2017. PMID: 28606974 Free PMC article. No abstract available.
Similar articles
-
An analysis of expenditures on primary care prescription drugs in the United States versus ten comparable countries.Health Policy. 2018 Sep;122(9):1012-1017. doi: 10.1016/j.healthpol.2018.07.005. Epub 2018 Jul 21. Health Policy. 2018. PMID: 30041827
-
Cost-related non-adherence to prescribed medicines among older adults: a cross-sectional analysis of a survey in 11 developed countries.BMJ Open. 2017 Jan 31;7(1):e014287. doi: 10.1136/bmjopen-2016-014287. BMJ Open. 2017. PMID: 28143838 Free PMC article.
-
Paying for Prescription Drugs Around the World: Why Is the U.S. an Outlier?Issue Brief (Commonw Fund). 2017 Oct 1;2017:1-14. Issue Brief (Commonw Fund). 2017. PMID: 28990747
-
The High Cost of Prescription Drugs in the United States: Origins and Prospects for Reform.JAMA. 2016 Aug 23-30;316(8):858-71. doi: 10.1001/jama.2016.11237. JAMA. 2016. PMID: 27552619 Review.
-
An income-weighted international average for comparative analysis of health expenditures.Int J Health Plann Manage. 1991 Jan-Mar;6(1):3-22. doi: 10.1002/hpm.4740060103. Int J Health Plann Manage. 1991. PMID: 10113547 Review.
Cited by
-
Integrating public preferences into national reimbursement decisions: a descriptive comparison of approaches in Belgium and New Zealand.BMC Health Serv Res. 2020 Apr 25;20(1):351. doi: 10.1186/s12913-020-05152-2. BMC Health Serv Res. 2020. PMID: 32334579 Free PMC article.
-
The impact of proposed price regulations on new patented medicine launches in Canada: a retrospective cohort study.CMAJ. 2024 May 26;196(20):E691-E701. doi: 10.1503/cmaj.231485. CMAJ. 2024. PMID: 38802136 Free PMC article.
-
Capacity of Kidney Care in Canada: Identifying Barriers and Opportunities.Can J Kidney Health Dis. 2019 Aug 30;6:2054358119870540. doi: 10.1177/2054358119870540. eCollection 2019. Can J Kidney Health Dis. 2019. PMID: 31516717 Free PMC article.
-
Increasing Prevalence and Direct Health Care Cost of Inflammatory Bowel Disease Among Adults: A Population-Based Study From a Western Canadian Province.J Can Assoc Gastroenterol. 2021 Mar 16;4(6):296-305. doi: 10.1093/jcag/gwab003. eCollection 2021 Dec. J Can Assoc Gastroenterol. 2021. PMID: 34877469 Free PMC article.
-
Assessing the Consequences of External Reference Pricing for Global Access to Medicines and Innovation: Economic Analysis and Policy Implications.Front Pharmacol. 2022 Apr 6;13:815029. doi: 10.3389/fphar.2022.815029. eCollection 2022. Front Pharmacol. 2022. PMID: 35462921 Free PMC article.
References
-
- OECD health statistics 2016. Paris: Organisation for Economic Co-operation and Development; 2016.
-
- Global medicines use in 2020 — outlook and implications. Parsippany (NJ): IMS Health; 2015.
-
- Osborn R, Moulds D, Squires D, et al. International survey of older adults finds shortcomings in access, coordination, and patient-centered care. New York: The Commonwealth Fund; 2014. - PubMed
-
- Patented Medicine Prices Review Board: annual report 2014. Ottawa: Patented Medicine Prices Review Board; 2015.
-
- Barnes S, Anderson L. Low earnings, unfilled prescriptions: employer-provided health benefit coverage in Canada. Toronto: Wellesley Institute; 2015.
Publication types
MeSH terms
Substances
Grants and funding
LinkOut - more resources
Full Text Sources
Other Literature Sources