. 2017 Jul 3;214(7):2103-2119.
doi: 10.1084/jem.20161512. Epub 2017 Jun 12.

TLR7/8 activation in neutrophils impairs immune complex phagocytosis through shedding of FcgRIIA

Affiliations

TLR7/8 activation in neutrophils impairs immune complex phagocytosis through shedding of FcgRIIA

Christian Lood et al. J Exp Med. .

Abstract

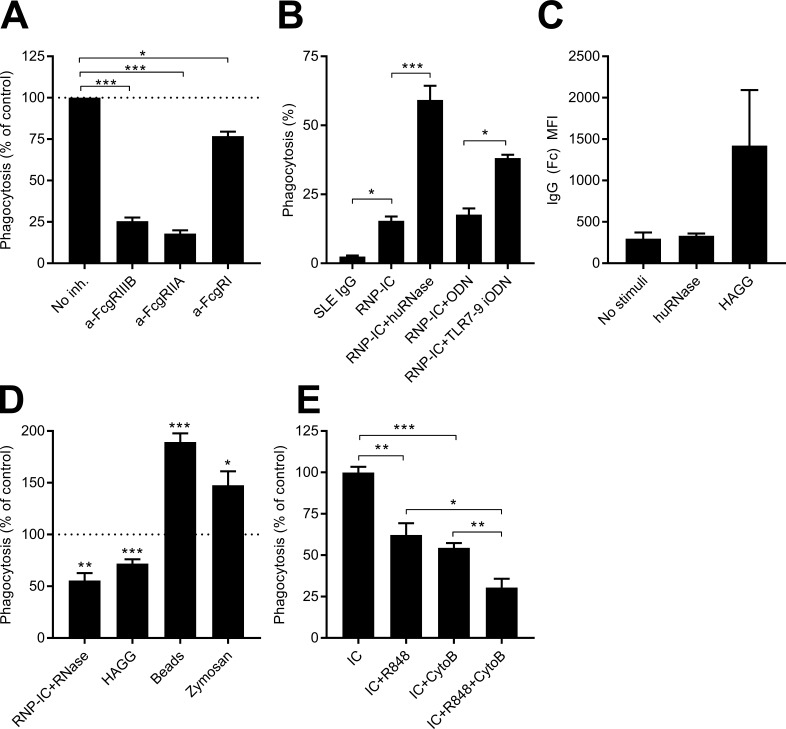
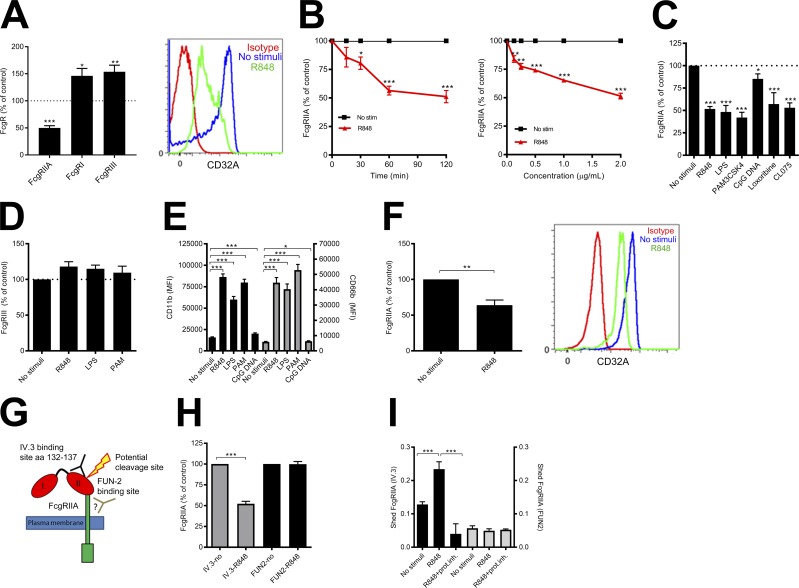
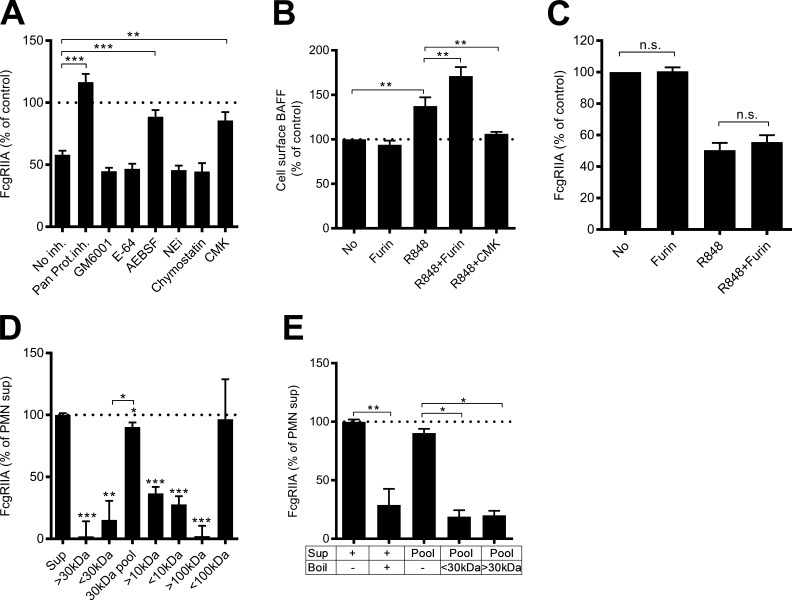
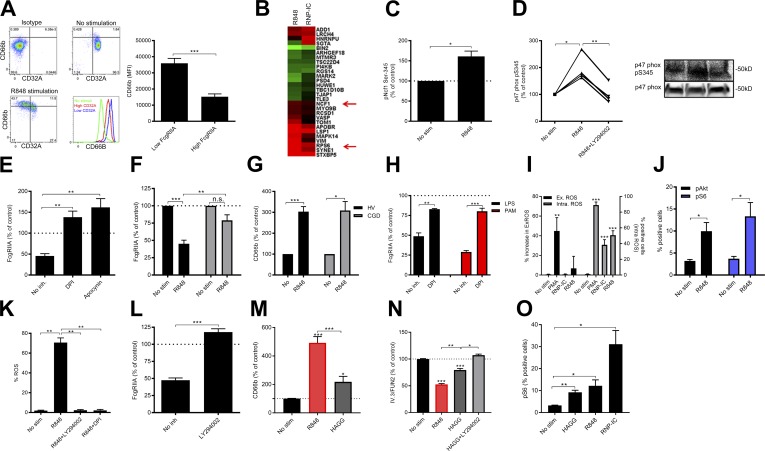
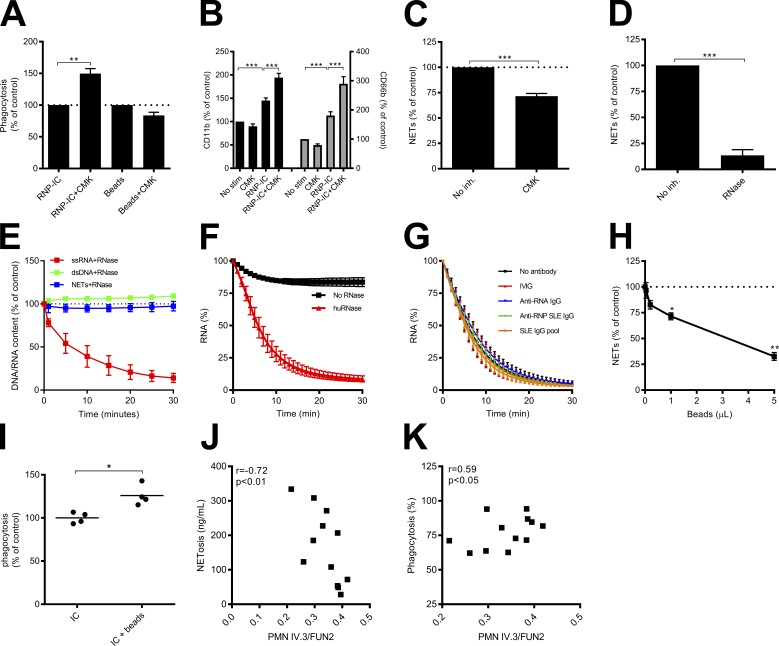
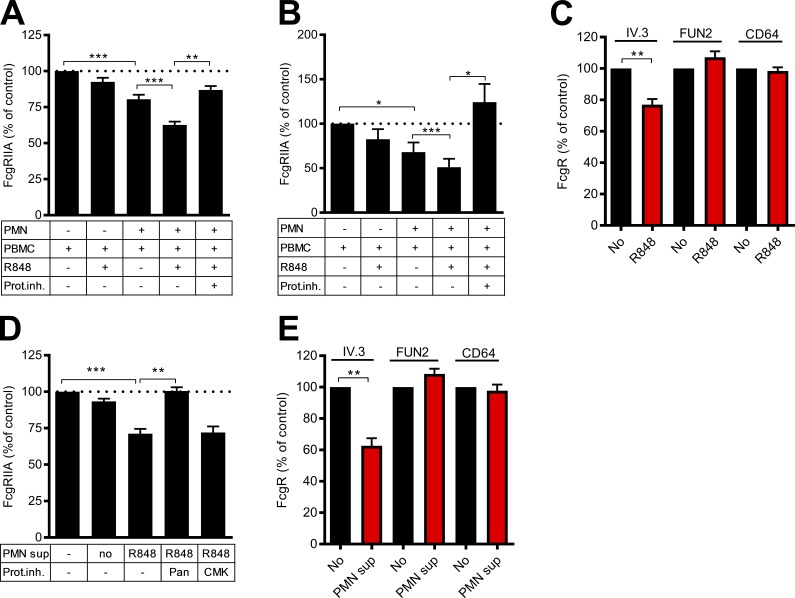
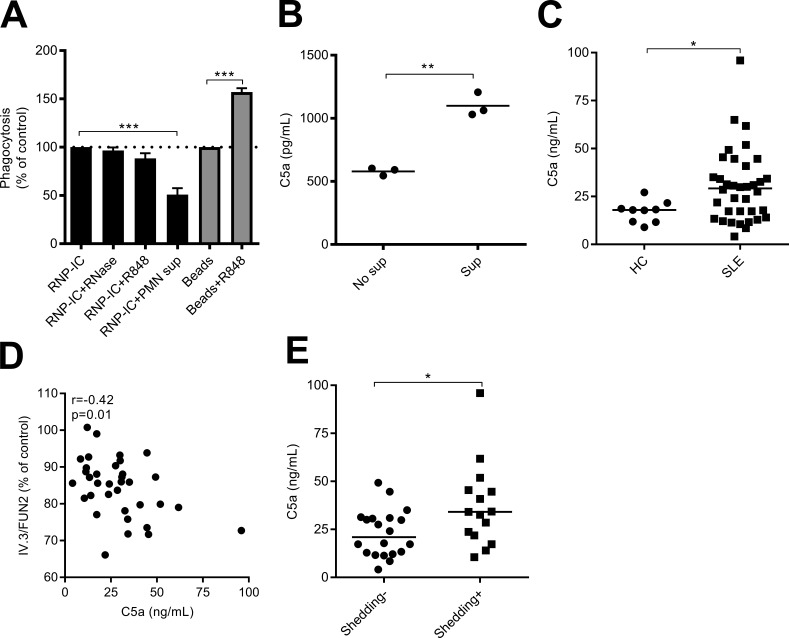
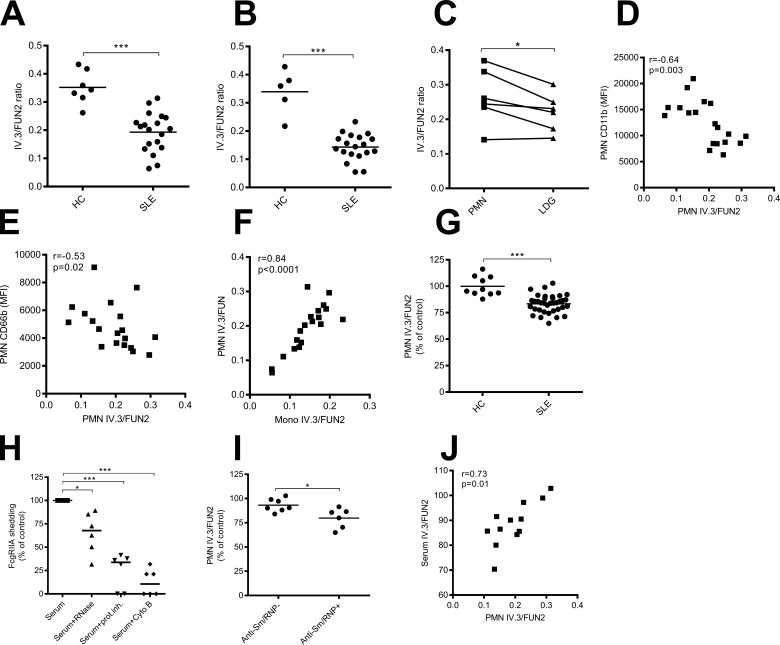
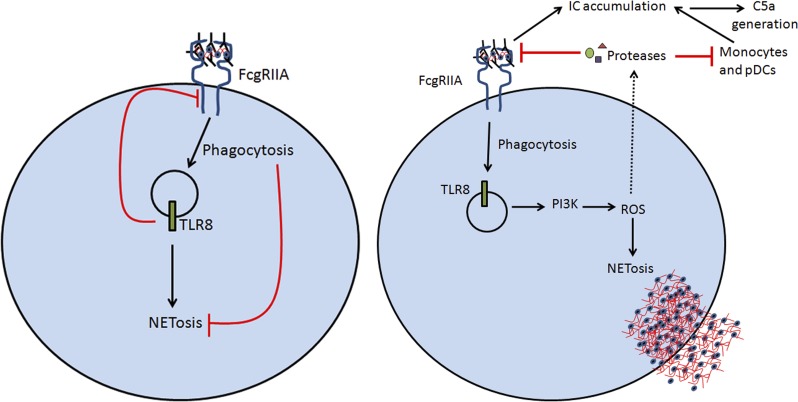
Neutrophils play a crucial role in host defense. However, neutrophil activation is also linked to autoimmune diseases such as systemic lupus erythematosus (SLE), where nucleic acid-containing immune complexes (IC) drive inflammation. The role of Toll-like receptor (TLR) signaling in processing of SLE ICs and downstream inflammatory neutrophil effector functions is not known. We observed that TLR7/8 activation leads to a furin-dependent proteolytic cleavage of the N-terminal part of FcgRIIA, shifting neutrophils away from phagocytosis of ICs toward the programmed form of necrosis, NETosis. TLR7/8-activated neutrophils promoted cleavage of FcgRIIA on plasmacytoid dendritic cells and monocytes, resulting in impaired overall clearance of ICs and increased complement C5a generation. Importantly, ex vivo derived activated neutrophils from SLE patients demonstrated a similar cleavage of FcgRIIA that was correlated with markers of disease activity, as well as complement activation. Therapeutic approaches aimed at blocking TLR7/8 activation would be predicted to increase phagocytosis of circulating ICs, while disarming their inflammatory potential.


Figures

Figure 1.
Figure 1.
FcgRIIA and TLR7/8 activation regulates phagocytosis of RNP-ICs. (A) Neutrophils were incubated with antibodies against FcgRs before stimulation with RNP-ICs. Phagocytosis was quantified by flow cytometry and compared with isotype antibody added (percentage of control). The experiment was repeated three times; combined results are shown and compared using paired Student’s t test (P = 0.013; P < 0.0001; P = 0.0009 for FcgRI, FcgRIIA, and FcgRIIIB, respectively). (B) TLR7/8 activation was inhibited by RNase or TLR7-9 iODN treatment before incubation of RNP-ICs with neutrophils and phagocytosis analyzed by flow cytometry. The experiment was repeated three times (ODN) or six times (RNase); combined results are compared using paired Student’s t test (P = 0.015; P = 0.0006; P = 0.014 for SLE IgG, huRNase, and TLR7-9 iODN, respectively). (C) Neutrophils were incubated with human (hu)RNase or HAGG and analyzed for IgG-Fc binding by flow cytometry. The experiment was repeated three times; combined results are shown. (D) Neutrophils were stimulated with R848 before incubation with RNase-treated RNP-ICs, HAGG, beads or zymosan. The results are expressed as phagocytosis as compared with no R848 added (% of control). The experiment was repeated six (zymosan), eight (RNP-IC+RNase), nine (HAGG), or ten (beads) times; combined results are shown and compared using paired t test (P = 0.0005, P = 0.0001, P < 0.0001, and P = 0.017 for RNP-IC+RNase, HAGG, beads, and zymosan, respectively). (E) Neutrophils, treated with or without R848 followed by cytochalasin B (CytoB; 5 µM), were analyzed for binding and uptake of RNP-ICs by flow cytometry. The experiment was repeated six times; combined results are shown and compared using paired Student’s t test (P < 0.0001 for IC vs. IC+CytoB; P = 0.0066 for IC vs. IC+R848; P = 0.0078 for IC+CytoB vs. IC+R848+CytoB; and P = 0.0158 for IC+R848 vs. IC+R848+CytoB). *, P < 0.05; **, P < 0.01; ***, P < 0.001.
Figure 2.
Figure 2.
TLR7/8 activation induces shedding of FcgRIIA. (A) Neutrophils were activated with R848 and cell surface expression of FcgRs analyzed by flow cytometry. The results are presented as FcgR levels as compared with no R848 added (percentage of control). The experiment was repeated 5 (FcgRI), 7 (FcgRIII), and 25 (FcgRIIA) times; combined results are shown and compared using paired Student’s t test (FcgRIIA, P < 0.0001; FcgRI, P = 0.027; FcgRIII, P = 0.0044). (B) Neutrophils were activated with the TLR7/8 agonist R848 and analyzed for FcgRIIA at different time-points and concentrations. The experiment was repeated four (concentration) and six (kinetics) times; combined results are shown and compared using paired Student’s t test (30 min, P = 0.0158; 60 min, P < 0.0001; 120 min, P = 0.0003; 0.125 µg/ml, P = 0.0071; 0.25 µg/ml, P = 0.0058; 0.5 µg/ml, P = 0.0008; 1 µg/ml, P < 0.0001; 2 µg/ml, P < 0.0001). (C) Neutrophils were activated with TLR ligands (LPS, 1 µg/ml, PAM3CSK4 (5 µg/ml), CpG DNA (2 µg/ml), Loxoribine (0.1 mM), CL075 (2.5 µg/ml), or R848 (2 µg/ml) for 60 min or (D) 4 h and analyzed for (C) FcgRIIA, (D) FcgRIII, or (E) CD11b (black bars) and CD66b (gray bars) cell surface expression by flow cytometry. For C, the experiment was repeated 6 (LPS, P = 0.0008), 8 (CpG DNA, P = 0.035; Loxoribine, P < 0.0001; CL075, P < 0.0001), 10 (PAM3CSK4, P < 0.0001), and 40 times (R848, P < 0.0001); combined results are shown and compared using paired Student’s t test. For D and E, the experiment was repeated four (D) and eight (E) times; combined results are shown and compared using paired Student’s t test (CD11b: R848, P < 0.0001; LPS, P = 0.0002; PAM, P < 0.0001; CpG DNA, P < 0.0001; CD66b: R848, P < 0.0001; LPS, P < 0.0001; PAM, P < 0.0001; CpG DNA, P = 0.014). F) Neutrophils were activated with R848 and FcgRIIA levels analyzed in permeabilized cells by flow cytometry. The experiment was repeated five times and compared using paired Student’s t test (P = 0.0075). (G) Cartoon illustrating the FcgRIIA receptor with the binding site for the IV.3 antibody (aa 132–137), potential cleavage site of FcgRIIA, and likely binding site of FUN2 indicated. (H) FcgRIIA cell surface expression was analyzed by flow cytometry using two antibodies, FUN2 and IV.3, in nonstimulated and R848-stimulated neutrophils. The experiment was repeated six times; combined results are shown and compared using paired Student’s t test (P < 0.0001). (I) Neutrophils were labeled with FITC-conjugated IV.3 anti-FcgRIIA or anti–FUN-2 antibodies and the shed antibody-FcgRIIA complex quantified by fluorimetry after R848 stimulation with or without prior addition of a pan-protease inhibitor. The experiment was repeated 4 (FUN2), 6 (IV.3 R848+prot.inh.), or 14 (IV.3 R848) times; combined results are shown and compared using paired Student’s t test (IV.3: R848, P < 0.0001; R848+prot.inh., P = 0.0001). *, P < 0.05; **, P < 0.01; ***, P < 0.001.
Figure 3.
Figure 3.
FcgRIIA shedding requires serine proteases. (A) Cell surface levels of FcgRIIA (IV.3) was analyzed by flow cytometry upon R848 activation in the presence of a pan protease inhibitor or inhibitors of matrix metalloproteases (GM6001, 10 µM), cysteine proteases (E-64, 1 µM), serine proteases (AEBSF, 100 µM), neutrophil elastase (Elastase inhibitor IV, 25 µM), cathepsin G (chymostatin, 10 µg/ml), or furin (chloromethylketone (CMK, 25 µM). The experiment was repeated three (E-64), four (Pan Prot.inh., P < 0.0001; AEBSF, P = 0.0004; chymostatin; and CMK, P = 0.0038), five (GM6001), and seven (NEi) times; combined results are shown and compared using paired Student’s t test. (B) Neutrophils were incubated with furin (100 ng/ml) or CMK 30 min before addition of R848. BAFF cell surface expression was analyzed by flow cytometry. The experiment was repeated seven times; combined results are shown and compared using paired Student’s t test (R848, P = 0.0095; R848+Furin, P = 0.0027; R848+CMK, P = 0.002). (C) Neutrophils were incubated with furin (100 ng/ml) in presence or absence of R848 and analyzed for FcgRIIA levels by flow cytometry. The experiment was repeated nine times; combined results are shown. (D and E) Supernatant from activated neutrophils was fractionated and analyzed for capacity to induce shedding of monocyte FcgRIIA (D) without or (E) with prior boiling of the fractions. In E, the 30-kD pool was used. In panel D, the experiment was repeated four (30kD pool), six (10kD and 100 kD) or seven (30 kD fractions) times; combined results are shown and compared using paired Student’s t test (>30 kD, P = 0.0003; <30 kD, P = 0.0015; 30 kD pool, P = 0.016 and P = 0.018 as compared with supernatant and <30 kD fraction, respectively; >10 kD, P < 0.0001; <10 kD, P = 0.0002; >100k D, P = 0.0001). In E, the experiment was repeated three (30 kD fraction and pool) or six (boiled supernatant) times; combined results are shown and compared using paired Student’s t test (boiled supernatant, P = 0.0035; Boiled >30 kD, P = 0.017; Boiled <30 kD, P = 0.011). *, P < 0.05; **, P < 0.01; ***, P < 0.001.
Figure 4.
Figure 4.
FcgRIIA shedding requires reactive oxygen species. (A) Neutrophils were activated with R848, and FcgRIIA and CD66b levels were analyzed by flow cytometry. The experiment was repeated eight times; combined results are shown and compared using paired Student’s t test (P < 0.0001). (B) Heat-map illustrating phosphoproteins modified upon TLR7/8 activation by R848 and RNP-ICs. Results are expressed as fold change as compared with nonstimulated neutrophils with green representing decreased phosphorylation and red indicating increased phosphorylation. (C) Phosphorylated ncf1 (p47 phox) at S345 upon R848 activation as determined by phosphoproteomics. The experiment was repeated three times; combined results are shown and compared using paired Student’s t test (P = 0.044). (D) Neutrophils were incubated with R848 in the absence or presence of the PI3K inhibitor Ly294002 and analyzed for pS345 or total levels of p47 phox using Western Blot. The experiment was repeated four times; combined results are shown and compared using paired t test (No stim, P = 0.03; R848+LY294002, P = 0.0011). (E) Neutrophils were treated with inhibitors of NADPH oxidase before addition of R848 and analyzed for cell surface expression of FcgRIIA by flow cytometry. The experiment was repeated six times; combined results are shown and compared using paired t test (DPI, P = 0.0042; Apocynin, P = 0.0044). (F) Neutrophils from healthy individuals (HV, n = 18) and CGD patients (n = 4) were stimulated with R848 and analyzed for FcgRIIA levels by flow cytometry. The data are analyzed using paired Student’s t test (HC, P < 0.0001) and unpaired Student’s t test (HC vs. CGD, P = 0.0097). (G) Neutrophils from healthy individuals (HV, n = 13) and CGD patients (n = 3) were activated by R848 and analyzed for CD66b expression by flow cytometry using paired Student’s t test (HC, P < 0.0001; CGD, P = 0.039). (H) Neutrophils were activated with LPS or PAM3CSK4 in presence of DPI and analyzed for FcgRIIA levels by flow cytometry. The experiment was repeated four times; combined results are shown and compared using paired Student’s t test (LPS, P = 0.0062; PAM, P = 0.0003). (I) Neutrophils were activated with R848, RNP-ICs, or PMA and analyzed for cellular localization for the ROS generation by flow cytometry and fluorimetry. The experiment was repeated five (extracellular) and eight (intracellular) times; combined results are shown and compared using paired Student’s t test (Extracellular: PMA, P = 0.007; Intracellular: PMA, P < 0.0001; RNP-IC, P = 0.0007; R848, P < 0.0001). (J) Phosphorylation of Akt and S6 was determined by flow cytometry upon TLR7/8 activation. The experiment was repeated four times; combined results are shown and compared using paired t test (pS6, P = 0.042; pAkt, P = 0.037). (K) Neutrophils, pretreated with inhibitors of PI3K (LY294002, 10 µM) or NADPH oxidase (DPI, 25 µM), were activated with R848 and analyzed for ROS generation by flow cytometry using DHR123. The experiment was repeated three times; combined results are shown and compared using paired Student’s t test (R848, P = 0.0049; R848+LY294002, P = 0.004; R848+DPI, P = 0.0031). (L) Neutrophils were pretreated with the PI3K inhibitor LY294002 (10 µM) and analyzed for R848-mediated shedding of FcgRIIA by flow cytometry. The experiment was repeated eight times; combined results are shown and compared using paired Student’s t test (P < 0.0001). (M–O) Neutrophils, with or without pretreatment with LY294002, were activated with heat-aggregated IgG (HAGG) and analyzed for (M) CD66b, (N) FcgRIIA shedding, and (O) pS6 expression by flow cytometry. In M and N, the experiments were repeated eight times. In O, the experiment was repeated five times; combined results are shown and compared using paired Student’s t test (M: R848, P < 0.0001; HAGG, P = 0.017; R848 vs. HAGG, P = 0.0001; N: R848, P < 0.0001; HAGG, P = 0.0002; R848 vs. HAGG, P = 0.0029; HAGG vs. HAGG+LY294002, P = 0.018; O: HAGG, P = 0.0024; R848, P = 0.0314; RNP-IC, P = 0.011). *, P < 0.05; **, P < 0.01; ***, P < 0.001.
Figure 5.
Figure 5.
FcgRIIA shedding differentially regulates neutrophil phagocytosis and NETosis. (A) Neutrophils were incubated with CMK (25 µM), before addition of stimuli and phagocytosis analyzed by flow cytometry. The experiment was repeated five times; combined results are shown and compared using paired Student’s t test (P = 0.0032). (B) Neutrophils were incubated with CMK before the addition of RNP-ICs and cell surface levels of CD11b and CD66b analyzed by flow cytometry. The results are expressed as CD11b or CD66b (percentage of control), as compared with nonstimulated cells. The experiment was repeated 15 times; combined results are compared using paired Student’s t test (CD11b: RNP-IC; P < 0.0001; RNP-IC+CMK, P = 0.0002; CD66b: RNP-IC; P < 0.0001; RNP-IC+CMK, P < 0.0001). (C) Neutrophils, pretreated with CMK, were activated with RNP-ICs and the ability to release NETs analyzed by fluorimetry. The experiment was repeated six times; combined results are compared using paired Student’s t test (P = 0.0001). (D) RNP-ICs were treated with RNases before addition to neutrophils and NET formation analyzed by fluorimetry. The experiment was repeated seven times; combined results are shown and compared using paired Student’s t test (P < 0.0001). (E) SmRNP, NETs, dsDNA, or ssRNA were degraded by human RNase without (E and F) or with (G) presence of autoantibodies, and analyzed by fluorimetry over time. The experiment was repeated three (G), four (E), or eight (F) times. (H) NET formation was analyzed upon preincubation with different amounts of beads. The experiment was repeated three times; combined results are shown and compared using paired Student’s t test (1 µl, P = 0.0135; 5 µl, P = 0.0031). (I) Neutrophil uptake of RNP-ICs was analyzed upon pretreatment with beads. The experiment was repeated four times; combined results are shown and compared using paired Student’s t test (P = 0.018). (J and K) Neutrophils from healthy individuals (n = 12) were analyzed for baseline FcgRIIA IV.3/FUN2 ratio in relation to IC-mediated NETosis (J) and phagocytosis (K). The combined results are shown and analyzed using Spearman’s correlation. *, P < 0.05; **, P < 0.01; ***, P < 0.001.
Figure 6.
Figure 6.
TLR7/8-activated neutrophils shed FcgRIIA from monocytes and pDCs. (A and B) PBMCs were coincubated with neutrophils (PMNs) in the presence of R848 and a pan-protease inhibitor. Levels of FcgRIIA on (A) monocytes (CD14+) and (B) pDCs (CD304+) were determined by flow cytometry and expressed as FcgRIIA (percentage of control) as compared with PBMCs incubated in medium in absence of neutrophils. In A, the experiment was repeated 11 times with the exception of the proteinase inhibitor (n = 5); combined results are shown and compared using paired t test (PMN+PBMC, P < 0.0001; PMN+PBMC vs. PMN+PBMC+R848, P < 0.0001; PMN+PBMC+R848 vs. PMN+PBMC+R848+Prot.inh., P = 0.002). In B, the experiment was repeated seven times; combined results are shown and compared using paired Student’s t test (PMN+PBMC, P = 0.0261; PMN+PBMC vs. PMN+PBMC+R848, P = 0.0002; PMN+PBMC+R848 vs. PMN+PBMC+R848+Prot.inh., P = 0.0128). (C) Monocytes were analyzed for the expression of FcgRI (CD64), as well as FcgRIIA using the monoclonal antibodies IV.3 and FUN2. The experiment was repeated four times; combined results are shown and compared using paired Student’s t test (P = 0.008). (D) Neutrophil supernatant, derived from nonstimulated (no, n = 5) or R848-stimulated (R848, n = 9) neutrophils, were added to monocytes in presence of indicated inhibitors (CMK; furin inhibitor, n = 5, and Pan; pan-protease inhibitor, n = 5) and monocyte FcgRIIA levels analyzed by flow cytometry. Combined results are shown and compared using paired Student’s t test (R848, P < 0.0001; R848+Pan, P = 0.003). (E) Neutrophil supernatant were added to monocytes and expression of FcgRIIA (IV.3 and FUN2) as well as FcgRI (CD64) analyzed by flow cytometry. The experiment was repeated four times; combined results are shown and compared using paired Student’s t test (P = 0.0043). *, P < 0.05; **, P < 0.01; ***, P < 0.001.
Figure 7.
Figure 7.
Proteolytic cleavage of monocyte FcgRIIA inhibits clearance of ICs. (A) Monocytes were incubated with R848 or neutrophil supernatant before addition of RNP-ICs or beads. Phagocytosis was determined by flow cytometry. The experiment was repeated four (beads, RNase, RNP-IC+R848) or seven (PMN sup) times; combined results are shown and compared using paired Student’s t test (RNP-IC, P = 0.0003; Beads, P = 0.0007). (B) ICs were added to PBMCs with or without prior treatment with neutrophil supernatant (A). After phagocytosis for 30 min, remaining cell-free ICs were analyzed for C5a-inducing ability upon addition of 1% normal human serum. The experiment was repeated three times; combined results are shown and compared using paired t test (P = 0.0084). C) C5a serum levels were measured in healthy controls (HC, n = 9) and SLE patients (n = 36) by ELISA. Combined results are shown and analyzed using Mann-Whitney U test (P = 0.047). (D and E) Serum levels of C5a in SLE patients were related to ability of serum to induce shedding of FcgRIIA on healthy control neutrophils. In D, combined results from 35 SLE patients are shown and analyzed using Spearman’s correlation test (r = −0.42; P = 0.011). In E, combined results are shown from SLE patients inducing shedding (n = 15) or not (n = 20), and compared using Mann-Whitney U test (P = 0.0281). *, P < 0.05; **, P < 0.01; ***, P < 0.001.
Figure 8.
Figure 8.
SLE patients have increased FcgRIIA shedding related to neutrophil activation. Neutrophils (A) and monocytes (B) were analyzed for FcgRIIA shedding using a ratio between shed FcgRIIA (IV.3) and total FcgRIIA levels (FUN2) in healthy controls (HC, n = 5–7) and SLE patients (n = 19). Combined results are shown and compared using Mann-Whitney U test (Neutrophils, P < 0.0001; Monocytes, P < 0.0001). (C) Normal-density neutrophils (PMNs) and low-density granulocytes (LDGs) were analyzed for FcgRIIA shedding by flow cytometry. Combined results from six SLE patients are shown and compared using paired Student’s t test (P = 0.026). Neutrophil FcgRIIA shedding was correlated with neutrophil activation as measured by neutrophil CD11b (D) and CD66b expression (E) in SLE patients (n = 19). Combined results are analyzed using Spearman’s correlation (CD66b, r = −0.64, P = 0.0029; CD11b, r = −0.53, P = 0.021). (F) Correlation analysis for ex vivo monocyte and neutrophil (PMN) FcgRIIA shedding in SLE patients. Combined results are analyzed using Spearman’s correlation (r = 0.84; P < 0.0001). (G) Healthy control neutrophils were incubated with 10% serum from healthy controls (HC, n = 10) or SLE patients (n = 36) and analyzed for FcgRIIA shedding by flow cytometry as determined by the IV.3/FUN2 ratio. Combined results are shown and compared using Mann-Whitney U test (P < 0.0001). (H) Sera from 6 SLE patients, preincubated with either RNase, a pan-protease inhibitor (prot.inh.), or cytochalasin B (Cyto B; 5 µM) were added to neutrophils from a healthy individual and FcgRIIA shedding analyzed by flow cytometry. Combined results are shown and compared using paired Student’s t test (RNase: P = 0.012; prot.inh.: P = 0.0002; Cyto B: P < 0.0001). (I) Serum-mediated shedding of FcgRIIA on healthy control neutrophils were analyzed in SLE patients with (n = 7) or without (n = 6) anti-Sm/RNP antibodies. Combined results are compared using Mann-Whitney U test (P = 0.035). (J) Correlation between ex vivo FcgRIIA shedding observed on SLE neutrophils with the shedding ability by the serum obtained from the same SLE patients (n = 12). Combined results are shown and analyzed by Spearman’s correlation (r = 0.73; P = 0.0096). *, P < 0.05; **, P < 0.01; ***, P < 0.001.
Figure 9.
Figure 9.
Schematic overview of main findings. Cartoons demonstrating the main findings described in the study. (left) Neutrophils may commit to phagocytosis or NETosis based on environmental triggers, in particular TLR activation. (right) Depiction of key signaling events resulting in TLR-mediated regulation of IC-mediated inflammation by neutrophils, monocytes, and pDCs. In brief, TLR activation results in activation of PI3K, contributing to generation of reactive oxygen species (ROS) via NADPH oxidase. ROS is essential for NET formation but also release of proteases able to shed FcgRIIA from immune cells. Loss of FcgRIIA results in increased ability of neutrophils to undergo IC-mediated NETosis, whereas also impairing phagocytic ability in neutrophils, monocytes, and pDCs. Noncleared ICs will instead activate the complement system to generate the anaphylatoxin C5a and be cleared through complement-dependent pathways.

Similar articles

Cited by

References

    1. Anders A., Gilbert S., Garten W., Postina R., and Fahrenholz F.. 2001. Regulation of the alpha-secretase ADAM10 by its prodomain and proprotein convertases. FASEB J. 15:1837–1839. - PubMed
    1. Assi L.K., Wong S.H., Ludwig A., Raza K., Gordon C., Salmon M., Lord J.M., and Scheel-Toellner D.. 2007. Tumor necrosis factor alpha activates release of B lymphocyte stimulator by neutrophils infiltrating the rheumatoid joint. Arthritis Rheum. 56:1776–1786. 10.1002/art.22697 - DOI - PMC - PubMed
    1. Berger M., Hsieh C.Y., Bakele M., Marcos V., Rieber N., Kormann M., Mays L., Hofer L., Neth O., Vitkov L., et al. . 2012. Neutrophils express distinct RNA receptors in a non-canonical way. J. Biol. Chem. 287:19409–19417. 10.1074/jbc.M112.353557 - DOI - PMC - PubMed
    1. Blander J.M., and Medzhitov R.. 2004. Regulation of phagosome maturation by signals from toll-like receptors. Science. 304:1014–1018. 10.1126/science.1096158 - DOI - PubMed
    1. Bota D.A., and Davies K.J.. 2002. Lon protease preferentially degrades oxidized mitochondrial aconitase by an ATP-stimulated mechanism. Nat. Cell Biol. 4:674–680. 10.1038/ncb836 - DOI - PubMed

MeSH terms