

ATM/Wip1 activities at chromatin control Plk1 re-activation to determine G2 checkpoint duration
- PMID: 28607002
- PMCID: PMC5510006
- DOI: 10.15252/embj.201696082
ATM/Wip1 activities at chromatin control Plk1 re-activation to determine G2 checkpoint duration
Abstract
After DNA damage, the cell cycle is arrested to avoid propagation of mutations. Arrest in G2 phase is initiated by ATM-/ATR-dependent signaling that inhibits mitosis-promoting kinases such as Plk1. At the same time, Plk1 can counteract ATR-dependent signaling and is required for eventual resumption of the cell cycle. However, what determines when Plk1 activity can resume remains unclear. Here, we use FRET-based reporters to show that a global spread of ATM activity on chromatin and phosphorylation of ATM targets including KAP1 control Plk1 re-activation. These phosphorylations are rapidly counteracted by the chromatin-bound phosphatase Wip1, allowing cell cycle restart despite persistent ATM activity present at DNA lesions. Combining experimental data and mathematical modeling, we propose a model for how the minimal duration of cell cycle arrest is controlled. Our model shows how cell cycle restart can occur before completion of DNA repair and suggests a mechanism for checkpoint adaptation in human cells.
Keywords: ATM; ATR; G2; Plk1; checkpoint recovery.
© 2017 The Authors.
Figures
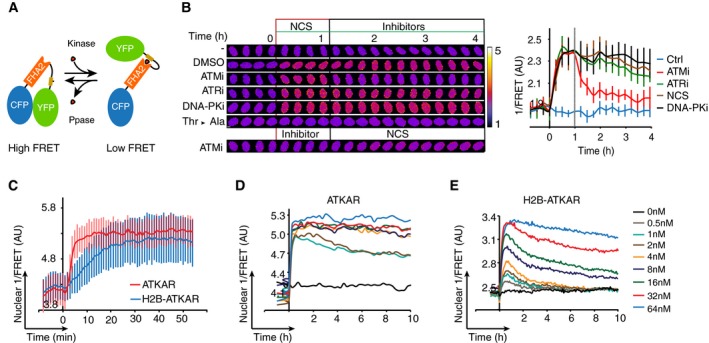
Schematic outline of FRET‐based probe. Phosphorylation of designated sequence (beige) leads to interaction with the phospho‐binding FHA2 domain (red). This is considered to lead to a conformation change that separates the fluorophores (blue and green), resulting in a decrease in FRET.
Change in FRET‐ratio of H2B‐ATKAR after neocarzinostatin (NCS) addition depends on ATM. Time‐lapse sequence (left) or quantification of 1/FRET (right) of U2OS cells expressing H2B‐ATKAR. Time point 0 indicates addition of 20 nM NCS, and time point 1 indicates addition of KU60019 (10 μM, ATMi), VE821 (1 μM, ATRi), or NU7026 (10 μM, DNAPKi). Thr‐Ala indicates alanine replacement of the designated phosphoacceptor in H2B‐ATKAR. Graph shows average and SD of at least 15 cells. Scale bars: 8 μm. Heat map indicates 1/FRET (AU).
Quantification of 1/FRET of a mixed population of H2B‐ATKAR‐ and ATKAR‐expressing U2OS cells after addition of NCS (5 nM). H2B‐ATKAR and ATKAR expressing cells were identified by the localization pattern of the expressed constructs. Graph shows average and SD of median pixel value of at least seven cells. Time point 0 indicates addition of NCS.
ATKAR signal reaches saturation at ˜4 nM NCS. Quantification of 1/FRET of U2OS cells expressing ATKAR, treated with the indicated NCS concentrations. Graph shows average 1/FRET of ≥ 10 U2OS cells/condition.
H2B‐ATKAR signal responds in a dose‐dependent manner to NCS addition and is reversed over time. Graph shows average 1/FRET of ≥ 10 U2OS cells/condition.
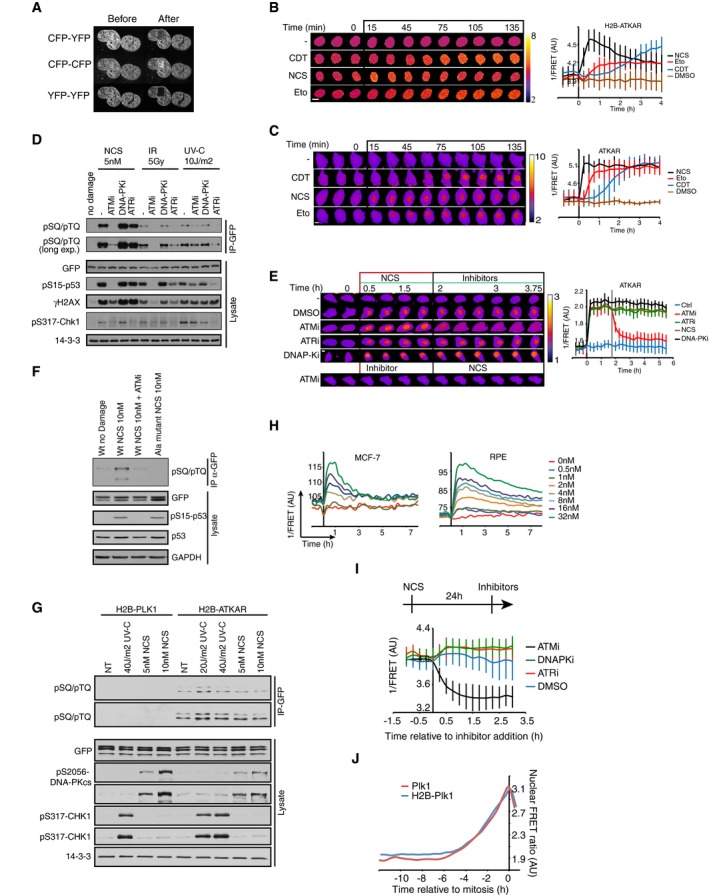
Acceptor photobleaching of H2B‐ATKAR. U2OS cells expressing H2B‐ATKAR were photobleached using a 514 nm laser, and images were acquired by using CFP‐YFP, YFP‐YFP, and CFP‐CFP excitation‐emission before and after photobleaching. The bleached area is visible in the YFP‐YFP images.
Kinetics of H2B‐ATKAR 1/FRET change after treatment with etoposide (Eto), neocarzinostatin (NCS) or cytolethal distending toxin (CDT). Time‐lapse sequence (left) or quantification of 1/FRET (right) of U2OS cells expressing H2B‐ATKAR. Graph shows average and SD of at least 15 cells. Time point 0 indicates addition of drugs. Scale bar: 15 μm. Heat map indicates 1/FRET (AU).
Kinetics of ATKAR 1/FRET change after treatment with etoposide (Eto), neocarzinostatin (NCS), or cytolethal distending toxin (CDT). Time‐lapse sequence (left) or quantification of 1/FRET (right) of U2OS cells expressing H2B‐ATKAR. Graph shows average and SD of at least 15 cells. Time point 0 indicates addition of drugs. Scale bar: 15 μm. Heat map indicates 1/FRET (AU).
H2B‐ATKAR phosphorylation after NCS addition depends on ATM. GFP pull‐down from U2OS cells expressing H2B‐ATKAR treated with NCS (5 nM) or exposed to IR (5 Gy) or UVC (10 J/m2). Immunoblots were probed with the indicated antibodies.
Change in ATKAR FRET‐ratio after NCS addition depends on ATM. Time‐lapse sequence (left) or quantification of 1/FRET (right) of U2OS cells expressing ATKAR. Time point 0 indicates addition of 5 nM NCS, and time point 1 indicates addition of KU60019 (10 μM, ATMi), VE821 (1 μM, ATRi), or NU7026 (10 μM, DNAPKi). Graph shows average and SD of at least 7 cells. Scale bar: 10 μm. Heat map indicates 1/FRET (AU).
GFP pull‐down from U2OS cells expressing ATKAR wild‐type (Wt) or alanine mutant (Ala) treated with NCS (10 nM) in presence or absence of ATM inhibitor. Immunoblot analysis shows the phosphorylation of ATKAR is on the expected target site residue and is ATM‐dependent upon NCS treatment.
H2B‐ATKAR phosphorylation after NCS treatment depends on ATM. GFP pull‐down from AT cells expressing H2B‐PLK1 or H2B‐ATKAR FRET probe treated with 5–10 nM NCS or 20–40 J/m2 UV‐C. Immunoblots were probed with indicated antibodies. Note that phosphorylation of H2B‐ATKAR is not induced by DNA damage in cells lacking ATM.
Quantification of 1/FRET of MCF‐7 and RPE cells expressing H2B‐ATKAR treated with the indicated concentrations of NCS. Graph shows average of at least 10 cells per condition.
ATKAR phosphorylation depends on ATM activity long after NCS addition. U2OS cells expressing ATKAR were treated with 5 nM NCS. The indicated inhibitors were added 24 h later. Graph shows average and SD of at least 15 cells.
Similar dynamics of phosphorylation of Plk1 sensor on chromatin or nucleoplasm. Quantification of nuclear 1/FRET of U2OS cells expressing either H2B‐Plk1 or Plk1 biosensor. Cells are synchronized upon mitotic entry in silico.
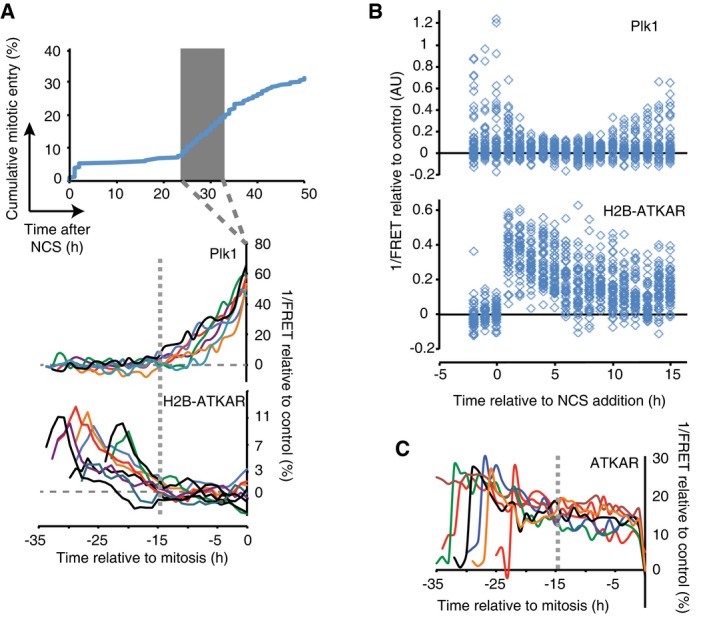
Reversal of H2B‐ATKAR correlates with resumption of Plk1 activity during cell cycle restart. A mixed population of U2OS cells expressing H2B‐ATKAR or Plk1 FRET probe were treated with 2 nM NCS, and mitotic entry was followed over time (top). Cells entering mitosis 24 to 33 h after NCS addition (gray rectangle) were synchronized in silico on mitosis and 1/FRET of individual cells was quantified (bottom). Gray dotted vertical line indicates 15 h before mitosis.
Resumption of Plk1 activity correlates with reversal of H2B‐ATKAR phosphorylation. A mixed population of RPE cells expressing H2B‐ATKAR or Plk1 FRET probe were transfected with p53 siRNA and treated with 8 nM NCS. 1/FRET was quantified of at least 41 cells per time point for each probe. H2B‐ATKAR or Plk1 FRET were recognized by their nuclear or whole‐cell localization. Each mark corresponds to one cell.
ATKAR phosphorylation is sustained until mitotic entry during spontaneous checkpoint recovery. U2OS cells expressing ATKAR were followed during treatment with NCS (2 nM) and 1/FRET of cells spontaneously recovering 24–33 h later were plotted as in (A). Each line represents a single cell synchronized in silico upon mitotic entry. Gray dotted vertical line indicates 15 h before mitosis.
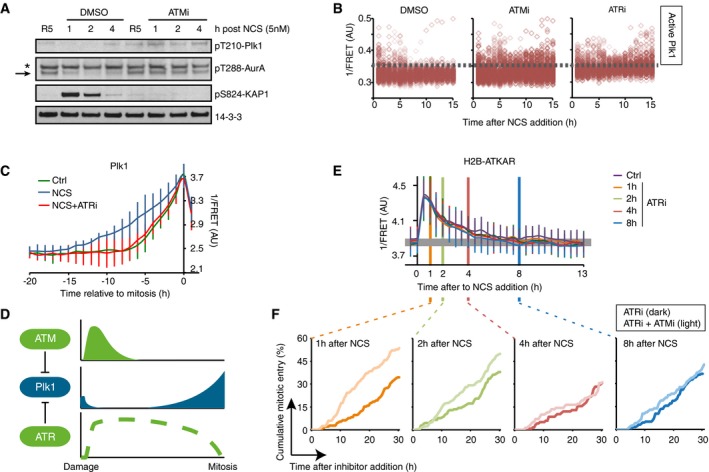
ATM inhibits Plk1 activity after NCS treatment. RPE cells were synchronized by 2 mM HU for 16 and 5 h after release to fresh media treated with NCS (5 nM) and DMSO or ATMi (10 μM) for indicated times. Antibodies against pT210‐Plk1 and pT288‐Aurora A recognize active forms of Plk1 and Aurora A, respectively. Asterisk indicates a cross‐reacting band. Arrow indicates position of Aurora A.
ATM activity contributes to Plk1 inhibition early after damage. U2OS cells expressing Plk1 FRET probe were treated with NCS (4 nM) and 15 min later ATMi, ATRi, or DMSO were added. Plots show 1/FRET of ˜500 cells/condition/time point. Dotted line shows approximate threshold below which Plk1 activity is not detected.
ATR counteracts Plk1 activity after cell cycle restart. Plk1 FRET probe expressing U2OS cells were untreated (Ctrl) or treated with 2 nM NCS followed by DMSO or ATRi. 1/FRET of individual cells entering mitosis was quantified. Graph shows average and SD of 1/FRET from ≥ 10 cells, synchronized in silico on mitosis. Note that the duration of Plk1 activation is longer in cells recovering from DNA damage compared to unperturbed cells, and that the prolonged duration is reverted in the presence of ATR inhibitor.
Schematic model. Whereas ATR inhibits Plk1 activity throughout a DDR, ATM determines when Plk1 can be activated to promote cell cycle resumption.
ATR inhibition does not affect H2B‐ATKAR FRET‐ratio after NCS. ATR inhibitor was added to U2OS cells expressing H2B‐ATKAR at the indicated time points after 4 nM NCS addition. Graph shows average and SD of 1/FRET for ≥ 10 cells per condition.
Synergistic effect of ATM and ATR inhibition early after NCS. Cumulative mitotic entry of U2OS cells after treatment with NCS (1 nM) followed by addition of ATRi (1 μM, dark lines) or ATRi and ATMi (1 and 10 μM, light lines) at different time points as indicated. For comparison, these time points are displayed as vertical lines in (D), where 4 nM NCS is used.
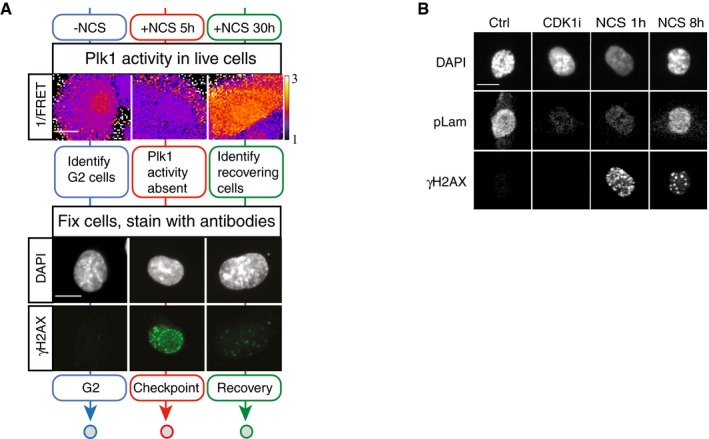
Example of approach described in Fig 4A. Representative images of live cells depicting Plk1 activity and the same cells fixed and stained for γH2AX and DAPI are shown. Mock treated cells (blue), 5 h NCS (red), or 30 h NCS (green). Scale bar: 15 μm. Heat map indicates 1/FRET (AU).
Example of images from experiment described and quantified in Fig 4E. Scale bar: 15 μm.
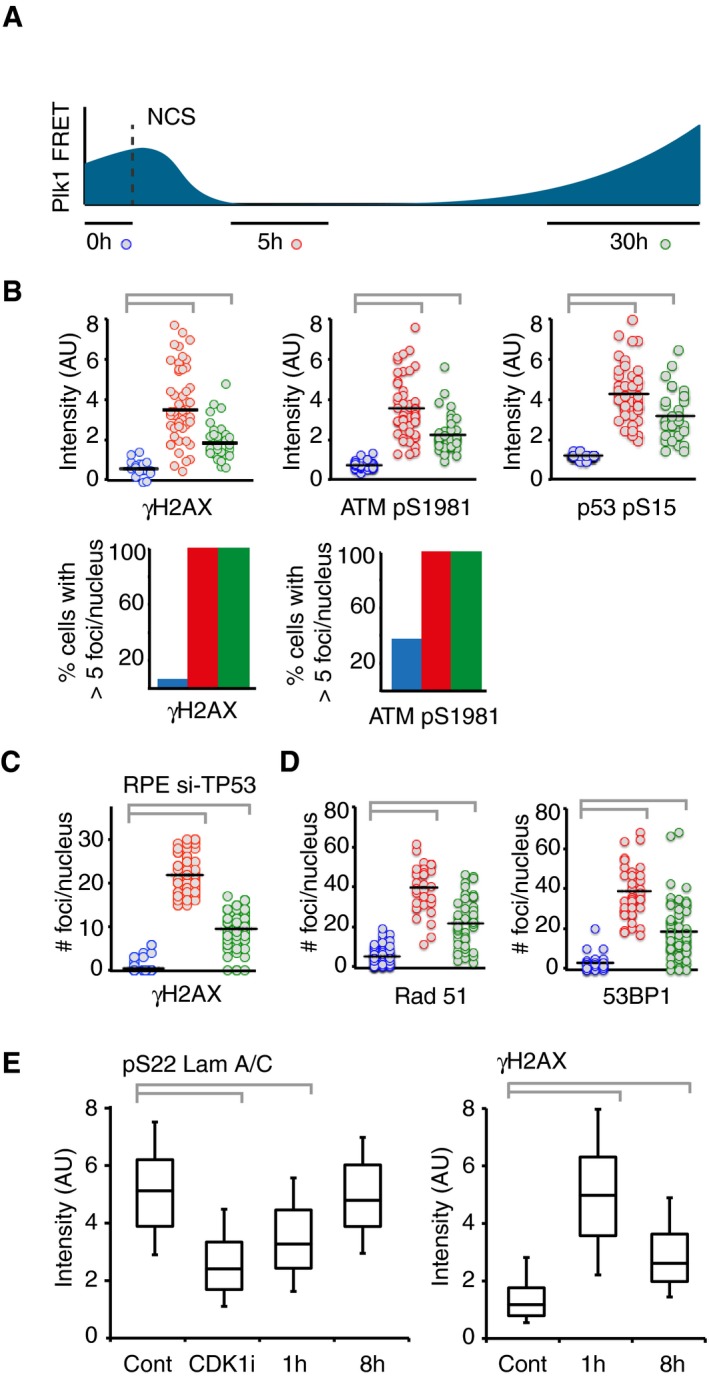
Schematic of approach. U2OS cells expressing Plk1 FRET probe were treated with NCS (2 nM). Before fixation at indicated time points, 1/FRET was followed in individual live cells to detect undamaged G2 cells (0 h, blue), G2 arrested cells without detectable Plk1 activity (5 h, red), and recovering G2 cells with increasing Plk1 activity (30 h, green). After fixation, the corresponding cells were identified both based on position and morphology.
Quantification of immunofluorescence of cells followed as in (A). Graphs show signal intensity or percentage of cells with nuclear foci detected by indicated antibodies.
RPE cells expressing Plk1‐FRET were treated with siRNA for TP53 and followed as in (A and B). Times were adjusted to 4.5 h (red) and 17 h (green). Graph shows quantification of γH2AX foci.
Quantification of immunofluorescence of cells followed as in (A and B). Graphs show amount of nuclear foci detected by indicated antibodies.
Cdk1 re‐activation in presence of γH2AX phosphorylation. RPE p53−/− cells were pulsed with EdU and treated or not (Cont, Cdk1i) with 8 nM NCS; 1 or 8 h later, cells were fixed and EdU‐negative, 4n DNA content cells (assessed by DAPI intensity) were analyzed for pS22 Lam A/C or γH2AX using quantitative immunofluorescence. RO‐3306 (Cdk1i) was added for 2 h before fixation. The box plots represent the 90th, 75th, 50th, 25th, and 10th percentiles of at least 270 G2 cells per condition.
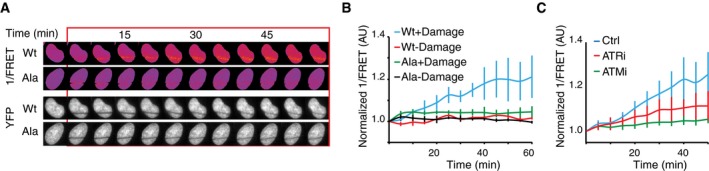
H2B‐ATKAR 1/FRET spreads over chromatin after localized damage. U2OS cells expressing H2B‐ATKAR were laser‐microirradiated, and 1/FRET was followed over time. Note that bleaching of fluorophores precludes FRET analysis within the laser‐microirradiated area.
Quantification of spread of H2B‐ATKAR (wt) or non‐phosphorylatable Ala‐H2B‐ATKAR (Ala) FRET change after laser microirradiation in U2OS cells. Measurements were performed distal to the laser‐microirradiated area. Graph shows average and SD of at least seven cells.
H2B‐ATKAR detects both ATM and ATR activity after laser microirradiation. Quantification of spread of H2B‐ATKAR FRET change after laser microirradiation in U2OS cells in the presence of ATM or ATR inhibitors. Inhibitors were added 30 min before laser microirradiation. Graph shows average and SD of at least five cells. Measurements were performed as in (B).
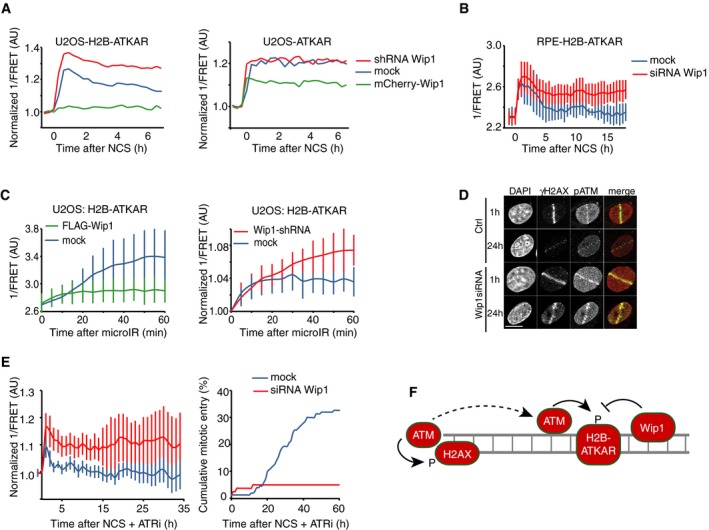
Quantification of 1/FRET of mixed populations of U2OS cells expressing H2B‐ATKAR or ATKAR. Cells were mock transfected or transfected with Wip1 shRNA or mCherry‐Wip1 for 48 h and treated with NCS (8 nM). Graph shows average of ≥ 8 cells.
Quantification of 1/FRET of RPE‐H2B‐ATKAR transfected with control or Wip1 siRNA treated with NCS (8 nM). Graph shows average of ≥ 8 cells; error bars indicate SD.
Wip1 influences the spread of H2B‐ATKAR 1/FRET change. U2OS‐H2B‐ATKAR cells were transfected with mock (blue), FLAG‐Wip1 (green), or Wip1 shRNA (red) and microirradiated with 364 nm laser. 1/FRET distal to the damaged area was quantified. Graph shows average and SD of at least five cells.
pS1981‐ATM is present throughout chromatin and counteracted by Wip1. U2OS cells were transfected with control or Wip1 siRNA, fixed after 1 or 24 h after microirradiation with 364 nm laser, and co‐stained for γH2AX and pS1981‐ATM. Scale bar: 15 μm.
Wip1‐depleted cells do not enter mitosis in presence of ATRi. 1/FRET (left) and cumulative mitotic entry (right) were measured in U2OS cells expressing H2B‐ATKAR transfected with mock or Wip1 shRNA treated with NCS (4 nM) and ATRi. Graph shows average of 10 cells. Error bars indicate SD.
Schematic model. Rather than DNA damage foci, H2B‐ATKAR signal detects ATM/Wip1 balance throughout chromatin.
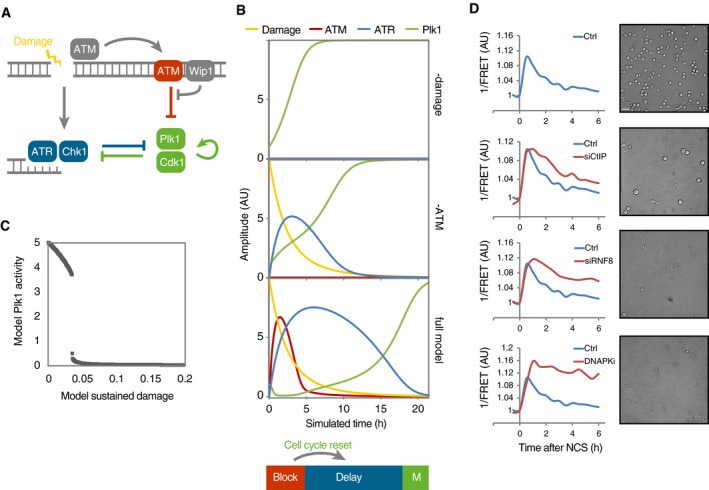
Schematic outline of simplified mathematical model. Arrows represent differential equations.
Simulation of model in the absence of damage (top) or ATM (middle) or containing all components (bottom). ATM activity on chromatin functions as a barrier that blocks Plk1 activity. Wip1 efficiently counteracts ATM‐mediated phosphorylations, which restricts ATM activity throughout chromatin to high damage levels. After reversal of the barrier, cell cycle signaling eventually overcomes ATR‐dependent activities, despite the presence of unrepaired DNA breaks. Due to the reset cell cycle activities (compare Plk1 and ATR in middle and lower graphs), a delay is introduced before ATR activities are overcome and mitosis occurs.
Cell cycle progression depends on a threshold level of damaged DNA. Simulation of optimized model (Fig EV3C), set so that after the initial DNA damage 2, a proportion of damage is not repaired. Graph shows simulation to steady state for the indicated range of sustained DNA damage levels.
Interference with DNA repair processes delays dephosphorylation of H2B‐ATKAR and mitotic entry. U2OS cells expressing H2B‐ATKAR were treated with indicated siRNAs or DNA‐PK inhibitor (NU7441, 2 μM), and 1/FRET was quantified in 10 cells after addition of 8 nM NCS (left). In parallel, mitotic cells were visualized by microscopy 24 h after treatment with 2 nM NCS and nocodazole (right). Scale bar: 50 μm.
Plk1 inhibition has no major effect on H2B‐ATKAR. Left, quantification of 1/FRET of at least 16 U2OS cells expressing H2B‐ATKAR after addition of 2 nM NCS. Plk1 inhibitor BI2536 was added 1 h before or immediately after NCS. Right, mitotic cells were visualized by microscopy 24 h after treatment with 2 nM NCS and nocodazole. Scale bar: 50 μm.
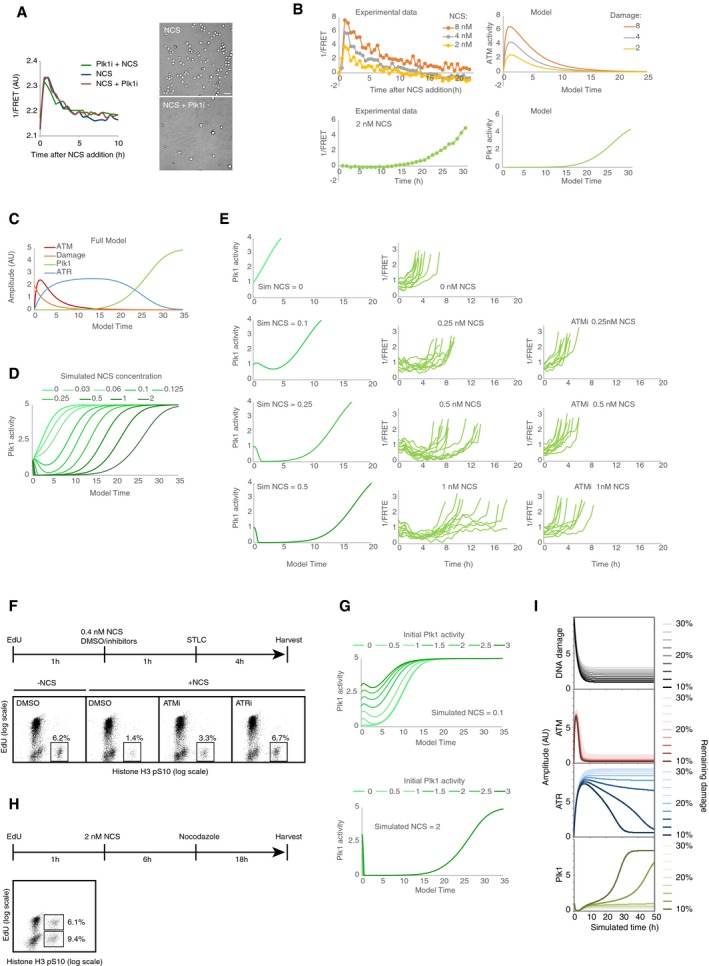
Fitting of model parameters to experimental data of U2OS cells. Top, model ATM activity was fitted to H2B‐ATKAR signal after NCS addition. Left graph shows average signal of at least 100 cells per condition. Bottom, model Plk1 activity was fitted to Plk1 FRET signal during recovery from NCS treatment. Left graph shows average signal of nine cells entering mitosis 27–32 h after NCS addition, synchronized in silico upon mitotic entry.
Model after fitting experimental data from (B).
Simulation of model using decreasing levels of DNA damage (corresponding to 0–2 nM NCS). Graph shows Plk1 activity. Note delayed activation of Plk1 activity after lower levels of DNA damage and full reversal of Plk1 activity after higher doses of damage.
Plk1 activity in recovering cells after NCS treatment. Cells were exposed to the indicated NCS concentrations, in the presence or absence of ATM inhibitor. Individual cells that showed a low level of Plk1 FRET signal upon NCS addition (indicating early G2 phase) and that subsequently entered mitosis were followed over time. Left, model predictions of Plk1 activity in early G2 cells after NCS addition. The model shows a factor 2 deviation from experimental data, possibly partly due to batch‐to‐batch variation in NCS potency.
ATM and ATR controls recovery from a G2 checkpoint. U2OS cells were treated as indicated in schematic. Graphs show percentage of EdU‐negative, pHistone H3‐positive cells analyzed by flow cytometry.
Simulation of model using low (0.1 nM NCS, top) or high (2 nM NCS, bottom) amounts of DNA damage at different initial activities of Plk1.
Both S‐phase and G2 cells exposed to NCS recover from DNA damage. U2OS cells were treated as indicated in schematic and analyzed by flow cytometry. Graphs show percentage of EdU‐positive or EdU‐negative cells that are positive for pHistone H3.
Cell cycle progression depends on a threshold level of damaged DNA. Simulation of model depicted in Fig 7A and B, but set so that 10–30% of initial damage is not repaired, as shown in top graph. Amount of remaining damage is color‐coded as indicated to the right. Above a threshold level of damage, ATM activity remains sufficiently high to ensure that ATR activity will be maintained and the cell cycle restart will not occur.
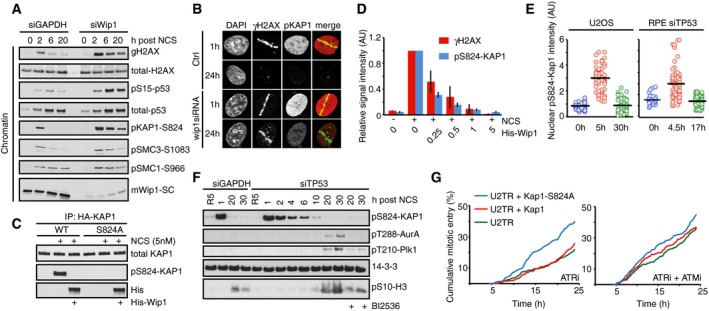
U2OS cells transfected with GAPDH or Wip1 siRNA were treated with NCS (5 nM) and collected after 2, 6, and 20 h. Chromatin fractions were probed with indicated antibodies.
RPE cells transfected with Wip1 siRNA were microirradiated, fixed 1 or 24 h later, and stained with the indicated antibodies.
HA‐KAP1‐WT or HA‐KAP1‐S824A were immunopurified from cells exposed to NCS, incubated with His‐Wip1 and probed with pS824‐KAP1 or KAP1 antibody.
U2OS cells were fixed 1 h after treatment with NCS, incubated with His‐Wip1 (0–5 ng/μl) and probed for γH2AX and pS824‐KAP1. Plot shows mean nuclear fluorescence intensity of at least 100 cells per condition; error bars indicate SD.
Kap1 is dephosphorylated before Plk1 activation. RPE cells transfected with TP53 siRNA and U2OS cells were followed as in Fig 4A and stained for pS824‐Kap1. G2 cells (0 h, blue), G2‐arrested cells without detectable Plk1 activity (5 h, red), and recovering G2 cells with increasing Plk1 activity (30 h, green). For RPE cells, the times were modified as indicated. Black bars indicate median and circles correspond to individual cells.
RPE cells transfected with GAPDH or TP53 siRNA were synchronized by HU, released to fresh media for 5 h (R5), and treated with NCS for indicated times. Nocodazole (NZ) was added 1 h after NCS. Where indicated, cells were incubated in the presence of BI2536. Whole‐cell lysates were probed with indicated antibodies. Antibodies against active forms of Plk1 and Aurora A kinase and to a mitotic marker pS10‐H3 were used to determine when cells recover from the checkpoint arrest.
Overexpression of Kap1‐S824A phenocopies ATM inhibition. Cumulative mitotic entry of ≥ 300 U2OS cells expressing inducible HA‐tagged Kap1‐wt (red) or Kap1‐S824A (green) after treatment with NCS (4 nM) and subsequent treatment after 1 h with ATRi or ATRi + ATMi.
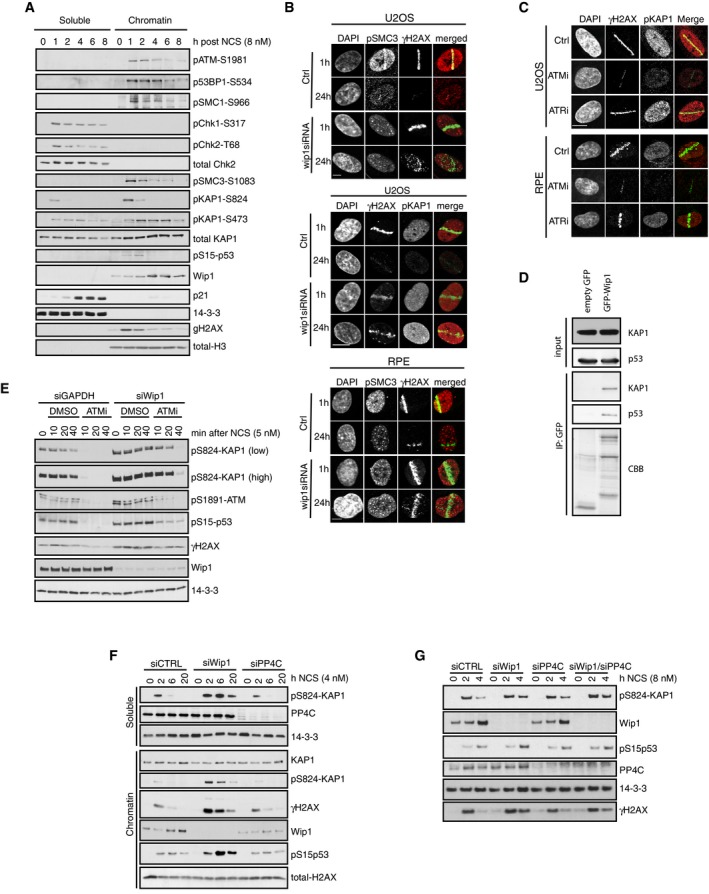
RPE cells were treated with NCS (8 nM) and collected after 1–8 h. Soluble and chromatin fractions were probed with indicated antibodies.
U2OS or RPE cells were transfected with Wip1 siRNA, microirradiated, and stained after 1 or 24 h with the indicated antibodies. Scale bars: 8 μm or 15 μm (middle).
U2OS and RPE cells were microirradiated in the presence of indicated inhibitors. After 1 h, cells were stained with the indicated antibodies. Scale bar: 10 μm.
EGFP or EGFP‐Wip1 was immunoprecipitated from HEK293 cells using GFP‐Trap. Endogenous KAP1 and p53 were probed with antibodies. Coomassie Brilliant Blue (CBB).
U2OS cells transfected with GAPDH or Wip1 siRNA were treated with NCS in combination with DMSO or ATMi for indicated times. Whole‐cell lysates were probed with indicated antibodies.
U2OS cells transfected with GAPDH, Wip1, or PP4C siRNA were treated with NCS for indicated times. Soluble and chromatin fractions were probed with indicated antibodies.
RPE cells transfected with GAPDH, Wip1, or PP4C siRNA were treated with NCS for indicated times. Whole‐cell lysates were probed with indicated antibodies.
Similar articles
-
Mitotic DNA damage response: Polo-like kinase-1 is dephosphorylated through ATM-Chk1 pathway.Cell Cycle. 2010 Jun 15;9(12):2389-98. doi: 10.4161/cc.9.12.11904. Epub 2010 Jun 15. Cell Cycle. 2010. PMID: 20581453
-
Regulation of Polo-like kinase 1 by DNA damage in mitosis. Inhibition of mitotic PLK-1 by protein phosphatase 2A.J Biol Chem. 2007 Jan 26;282(4):2473-82. doi: 10.1074/jbc.M605480200. Epub 2006 Nov 22. J Biol Chem. 2007. PMID: 17121863
-
Phosphorylation of Plk1 at S137 and T210 is inhibited in response to DNA damage.Cell Cycle. 2005 Jan;4(1):166-71. doi: 10.4161/cc.4.1.1348. Epub 2005 Jan 5. Cell Cycle. 2005. PMID: 15611664
-
Polo-Like Kinase 1 and DNA Damage Response.DNA Cell Biol. 2024 Sep;43(9):430-437. doi: 10.1089/dna.2024.0018. Epub 2024 Jul 3. DNA Cell Biol. 2024. PMID: 38959179 Review.
-
Distinct roles of ATR and DNA-PKcs in triggering DNA damage responses in ATM-deficient cells.EMBO Rep. 2009 Jun;10(6):629-35. doi: 10.1038/embor.2009.60. Epub 2009 May 15. EMBO Rep. 2009. PMID: 19444312 Free PMC article.
Cited by
-
The expression and clinical significance of PLK1/p-PLK1 protein in NK/T cell Lymphoma.Diagn Pathol. 2023 Nov 30;18(1):129. doi: 10.1186/s13000-023-01413-w. Diagn Pathol. 2023. PMID: 38037110 Free PMC article.
-
An ATM-PPM1D Circuit Controls the Processing and Restart of DNA Replication Forks.bioRxiv [Preprint]. 2025 May 15:2025.05.13.652823. doi: 10.1101/2025.05.13.652823. bioRxiv. 2025. PMID: 40462982 Free PMC article. Preprint.
-
A comprehensive evaluation of pathogenic mutations in primary cutaneous melanomas, including the identification of novel loss-of-function variants.Sci Rep. 2019 Nov 19;9(1):17050. doi: 10.1038/s41598-019-53636-x. Sci Rep. 2019. PMID: 31745173 Free PMC article.
-
WIP1 Promotes Homologous Recombination and Modulates Sensitivity to PARP Inhibitors.Cells. 2019 Oct 15;8(10):1258. doi: 10.3390/cells8101258. Cells. 2019. PMID: 31619012 Free PMC article.
-
PPM1D activity promotes cellular transformation by preventing senescence and cell death.Oncogene. 2024 Oct;43(42):3081-3093. doi: 10.1038/s41388-024-03149-3. Epub 2024 Sep 5. Oncogene. 2024. PMID: 39237765 Free PMC article.
References
-
- Akopyan K, Silva Cascales H, Hukasova E, Saurin AT, Mullers E, Jaiswal H, Hollman DA, Kops GJ, Medema RH, Lindqvist A (2014) Assessing kinetics from fixed cells reveals activation of the mitotic entry network at the S/G2 transition. Mol Cell 53: 843–853 - PubMed
-
- Altmeyer M, Lukas J (2013) To spread or not to spread–chromatin modifications in response to DNA damage. Curr Opin Genet Dev 23: 156–165 - PubMed
-
- Bartek J, Lukas J (2007) DNA damage checkpoints: from initiation to recovery or adaptation. Curr Opin Cell Biol 19: 238–245 - PubMed
MeSH terms
Substances
LinkOut - more resources
Full Text Sources
Other Literature Sources
Molecular Biology Databases
Research Materials
Miscellaneous
