

OPA1 deficiency promotes secretion of FGF21 from muscle that prevents obesity and insulin resistance
- PMID: 28607005
- PMCID: PMC5510002
- DOI: 10.15252/embj.201696179
OPA1 deficiency promotes secretion of FGF21 from muscle that prevents obesity and insulin resistance
Abstract
Mitochondrial dynamics is a conserved process by which mitochondria undergo repeated cycles of fusion and fission, leading to exchange of mitochondrial genetic content, ions, metabolites, and proteins. Here, we examine the role of the mitochondrial fusion protein optic atrophy 1 (OPA1) in differentiated skeletal muscle by reducing OPA1 gene expression in an inducible manner. OPA1 deficiency in young mice results in non-lethal progressive mitochondrial dysfunction and loss of muscle mass. Mutant mice are resistant to age- and diet-induced weight gain and insulin resistance, by mechanisms that involve activation of ER stress and secretion of fibroblast growth factor 21 (FGF21) from skeletal muscle, resulting in increased metabolic rates and improved whole-body insulin sensitivity. OPA1-elicited mitochondrial dysfunction activates an integrated stress response that locally induces muscle atrophy, but via secretion of FGF21 acts distally to modulate whole-body metabolism.
Keywords: ER stress; FGF21; OPA1; mitochondrial dysfunction; skeletal muscle.
© 2017 The Authors.
Figures
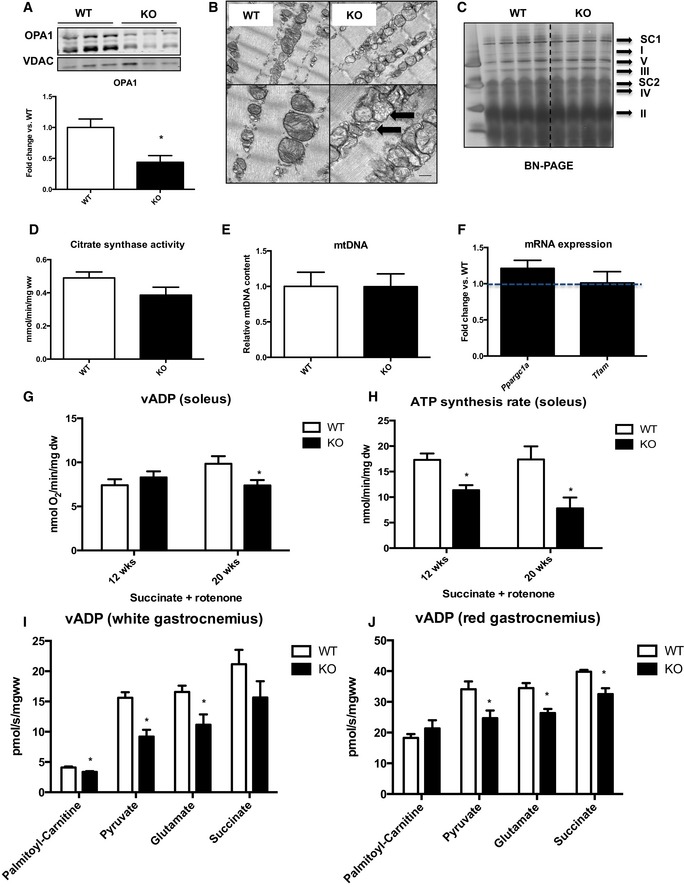
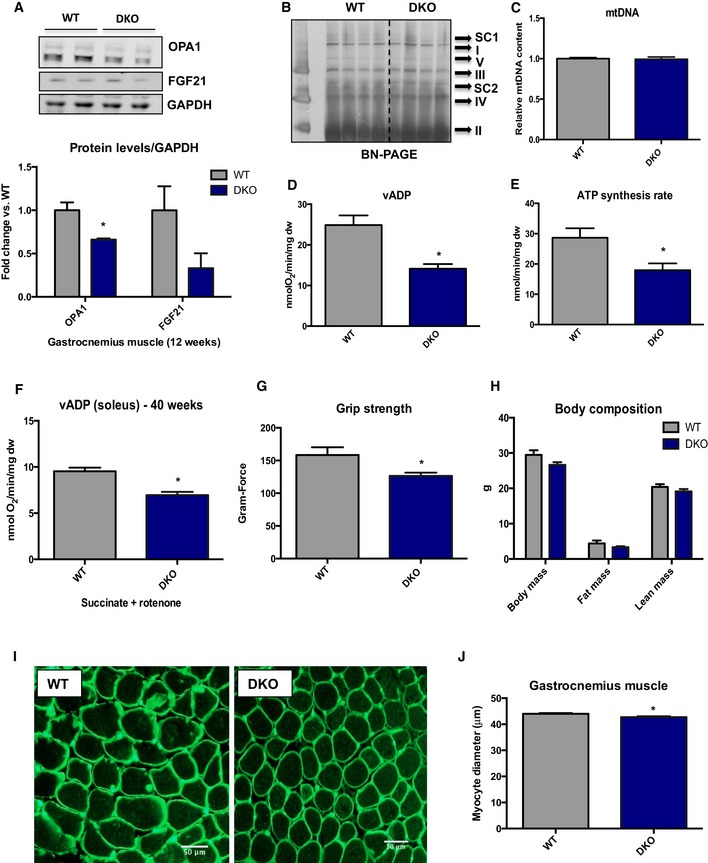
Representative immunoblot of OPA1 in gastrocnemius muscle from 12‐week‐old WT and mOPA1 KO (KO) mice and densitometric analysis of OPA1 normalized by VDAC (n = 6).
Electron micrographs from soleus muscle of 12‐week‐old mice (arrows highlight mitochondria with abnormal cristae structure) (n = 4). Scale bar = 0.32 μm.
BN‐PAGE in gastrocnemius muscle of 12‐week‐old mice (n = 4). I‐V, mitochondrial OXPHOS complexes I‐V; SC1, super complex 1; SC2 super complex 2.
Citrate synthase activity in gastrocnemius muscle of 12‐week‐old mice (n = 6).
mtDNA copy number in gastrocnemius muscle of 12‐week‐old mice (n = 6).
mRNA expression of mitochondrial biogenesis genes (n = 4–6).
Maximally stimulated succinate‐supported mitochondrial respirations in soleus from 12‐ and 20‐week‐old mice (n = 4–7).
Succinate‐supported ATP synthesis rates in soleus from 12‐ and 20‐week‐old mice (n = 3–6).
Maximally stimulated mitochondrial respirations in white gastrocnemius muscle from 20‐week‐old mice (n = 3–4).
Maximally stimulated mitochondrial respirations in red gastrocnemius muscle from 20‐week‐old mice (n = 3–4).
- A, B
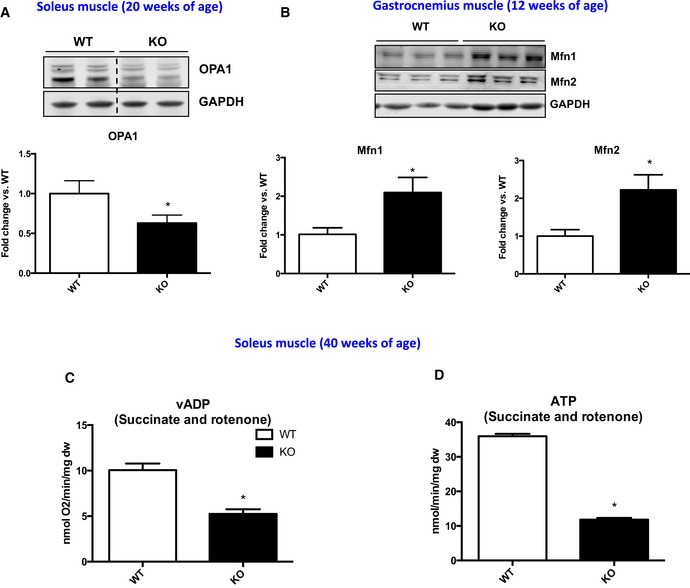
Representative immunoblots and densitometric quantification in muscle homogenates from WT and mOPA1 KO mice. (A) OPA1 levels in soleus muscle normalized to GAPDH (n = 3). (B) Mfn1 and Mfn2 normalized to GAPDH (n = 4–5).
- C
Maximally stimulated succinate‐supported mitochondrial respirations in soleus from 40‐week‐old WT and mOPA1 KO (KO) mice (n = 5).
- D
Succinate‐supported ATP synthesis rates in soleus from 40‐week‐old WT and mOPA1 KO (KO) mice (n = 5).
- A
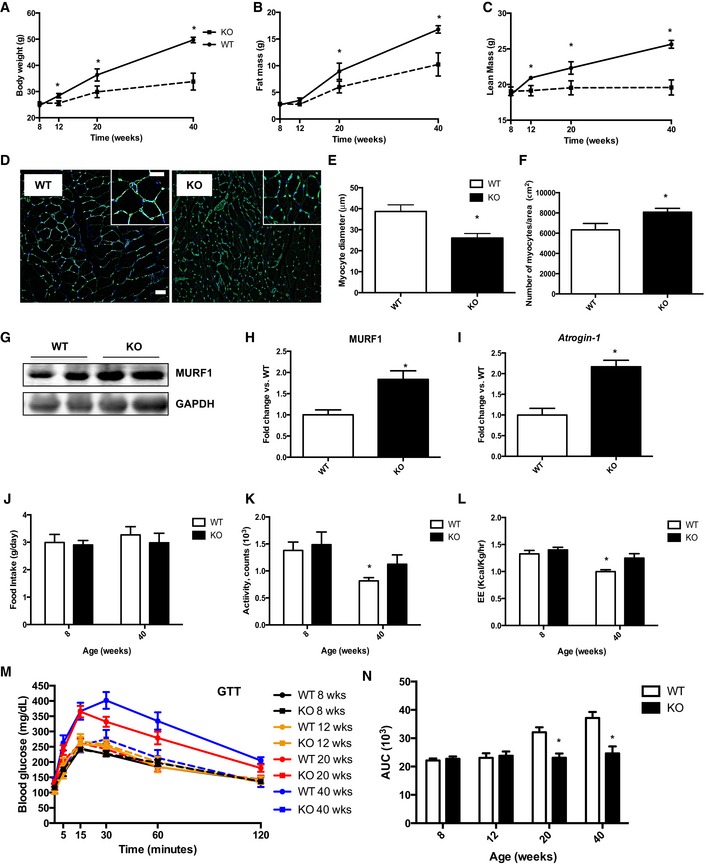
Body weight over time (n = 8–13).
- B
Total fat mass over time (n = 8–13).
- C
Total lean mass over time (n = 8–13).
- D
Cross sections of gastrocnemius muscle from 20‐week‐old mice stained with wheat‐germ agglutinin (WGA). Scale bar = 20 μm (main images) and 40 μm (magnification inserts).
- E
Measurements of muscle fiber diameter in gastrocnemius muscle from 20‐week‐old mice (n = 3–5).
- F
Measurements of the number of myocyte/area (n = 3–5).
- G, H
(G) Western blot analysis and (H) densitometric quantification of MuRF1 and GAPDH in gastrocnemius muscle from 40‐week‐old mice. Densitometric quantification is relative to GAPDH (n = 5).
- I
mRNA expression of Atrogin‐1 in gastrocnemius muscle of 20‐week‐old mice (n = 5). Data are represented as fold change vs. WT mice.
- J–L
CLAMS data in 8‐ and 40‐week‐old WT and mOPA1 KO (KO) mice. (J) Daily food intake (n = 5–9). (K) Activity levels (n = 6–9). (L) Energy expenditure (n = 6–9).
- M
Glucose tolerance tests (n = 7–11).
- N
Area under the curve (AUC) for glucose tolerance tests (n = 7–11).
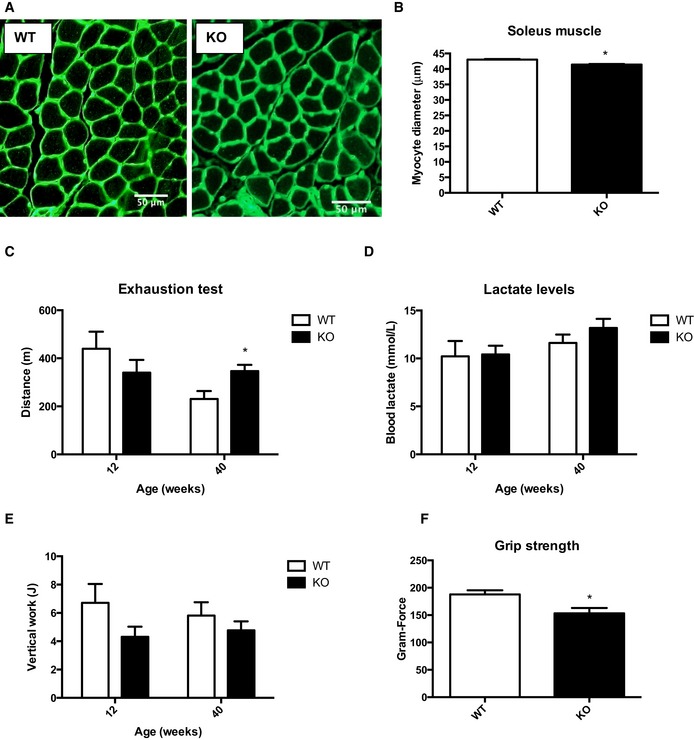
Cross sections of soleus muscle from 20‐week‐old mice stained with wheat‐germ agglutinin (WGA). Scale bar = 50 μm.
Measurements of muscle fiber diameter in soleus muscle from 20‐week‐old mice (n = 4).
Exhaustion test in 20‐ and 40‐week‐old WT and mOPA1 KO mice (n = 4–9).
Blood lactate after the exhaustion test (n = 4–9).
Measurements of vertical work performed by 20‐ and 40‐week‐old mice during the exhaustion test (n = 4–9).
Measurements of grip strength in 40‐week‐old mice (n = 5).
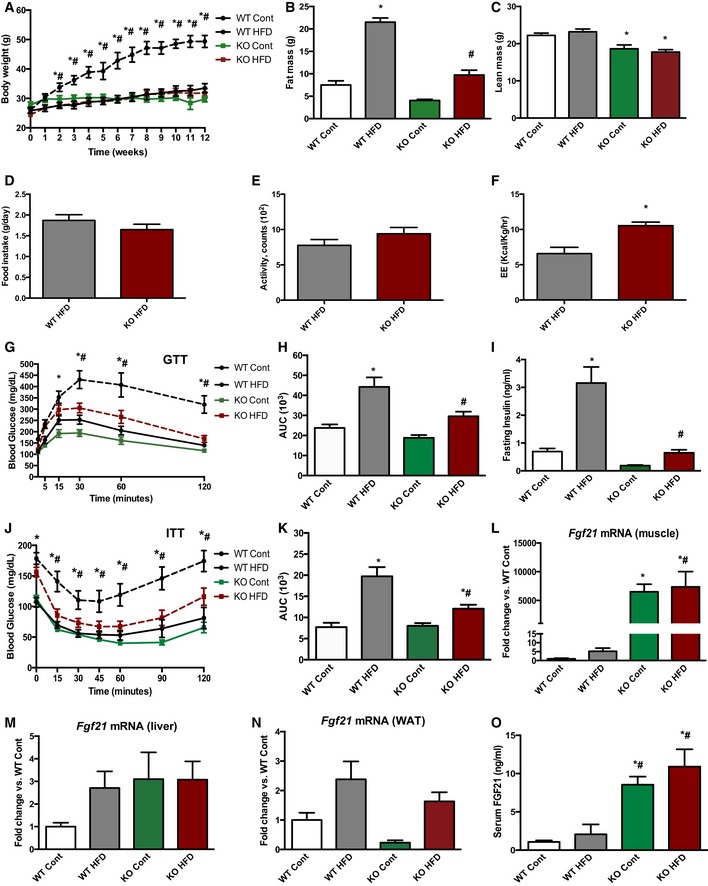
- A
Weekly body weight during 12 weeks of control or HFD feeding (n = 5–9).
- B
Total fat mass after 12 weeks on control or HFD (n = 9–11).
- C
Total lean mass after 12 weeks on control or HFD (n = 9–11).
- D–F
CLAMS data in high‐fat‐fed WT and mOPA1 KO (KO) mice at the end of 12 weeks of feeding. (D) Daily food intake (n = 5–7). (E) Activity level (n = 5–7). (F) Energy expenditure (n = 6–7).
- G
Glucose tolerance tests in control and high‐fat‐fed WT and mOPA1 KO (KO) mice at the end of 12 weeks of feeding (n = 5–9).
- H
Area under the curve (AUC) for glucose tolerance tests (n = 5–9).
- I
Fasting insulin levels (n = 5–9).
- J
Insulin tolerance test in control and high‐fat‐fed WT and KO mice at the end of 12 weeks of feeding (n = 5–8).
- K
Area under the curve (AUC) for insulin tolerance tests (n = 5–8).
- L–N
FGF21 mRNA expression in 20‐week‐old mice at the end of 12 weeks of feeding. (L) Skeletal muscle (n = 3–5). (M) Liver (n = 4–5). (N) White adipose tissue (WAT) (n = 3–7).
- O
FGF21 plasma levels in control and high‐fat‐fed WT and KO mice at the end of 12 weeks of feeding (n = 3–6).
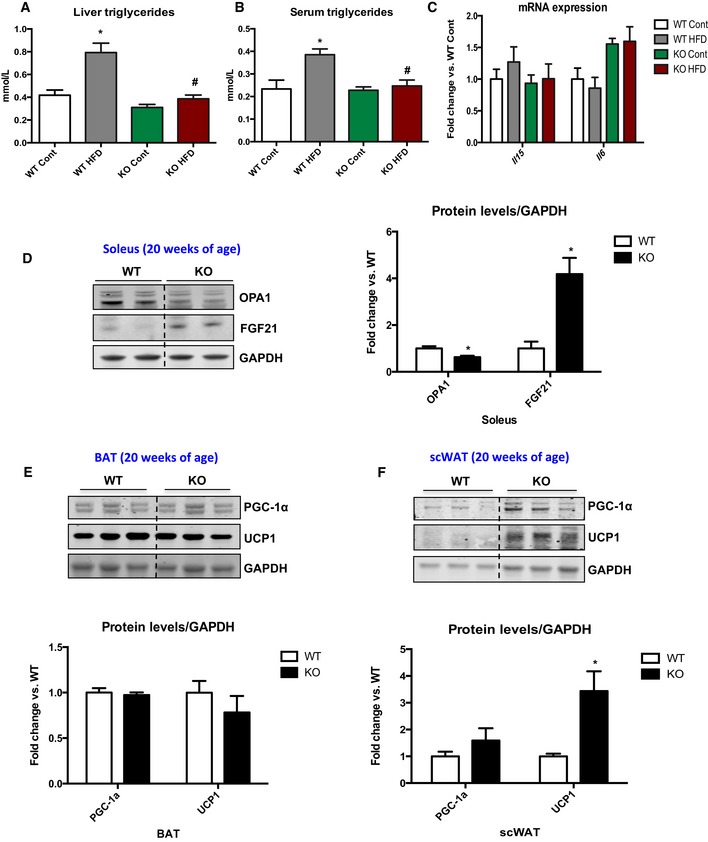
Triglycerides levels in mice fed either a control or a HFD for 12 weeks (n = 5–6).
Fasting triglyceride levels in the serum of mice fed either a control or a HFD for 12 weeks (n = 5–8).
IL‐15 and IL‐6 mRNA expression in gastrocnemius muscle of 20‐week‐old WT and mOPA1 KO mice (n = 4–5).
Representative immunoblot and densitometric quantification of OPA1 and FGF21 normalized to GAPDH in soleus muscle of 20‐week‐old mice (n = 3).
Representative immunoblot and densitometric quantification of PGC‐1α and UCP1 normalized to GAPDH in BAT of 20‐week‐old mice (n = 4).
Representative immunoblot and densitometric quantification of PGC‐1α and UCP1 normalized to GAPDH in sc‐WAT of 20‐week‐old mice (n = 3–4). Data are represented as fold change vs. WT mice.
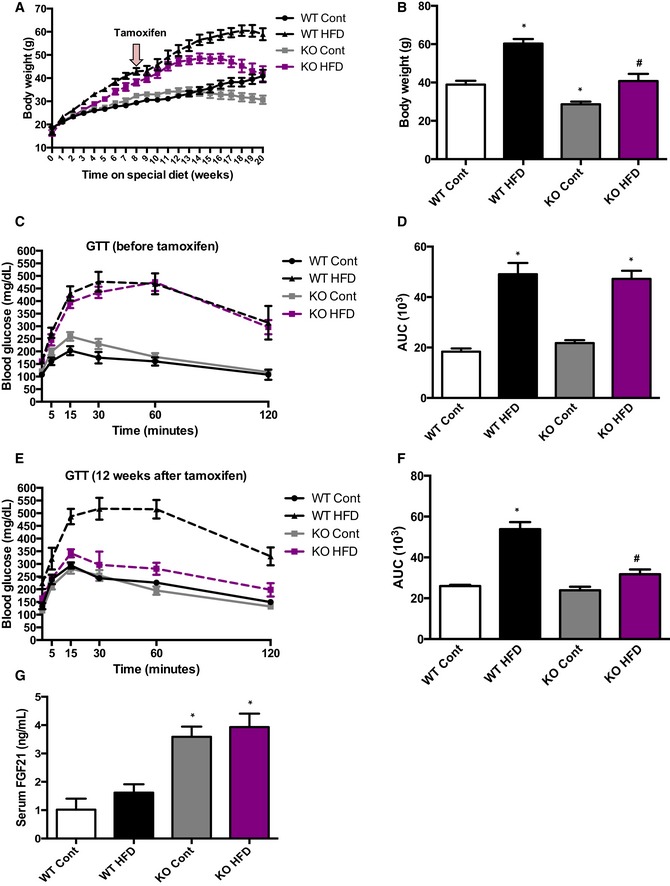
Weekly body weight before and after tamoxifen injections (total of 20 weeks of control or HFD) (n = 6).
Final body weight after 20 weeks of control or HFD (n = 6).
Glucose tolerance tests in control and high‐fat‐fed WT and mOPA1 KO (KO) before tamoxifen injection (8 weeks of control or HFD) (n = 6–9).
Area under the curve (AUC) for glucose tolerance tests (n = 6–9).
Glucose tolerance tests in control and high‐fat‐fed WT and mOPA1 KO (KO) 12 weeks after tamoxifen injection (20 weeks total of control or HFD) (n = 5–8).
Area under the curve (AUC) for glucose tolerance tests (n = 5–8).
FGF21 plasma levels after 20 weeks of control or HFD (12 weeks after tamoxifen injections) (n = 6–8).
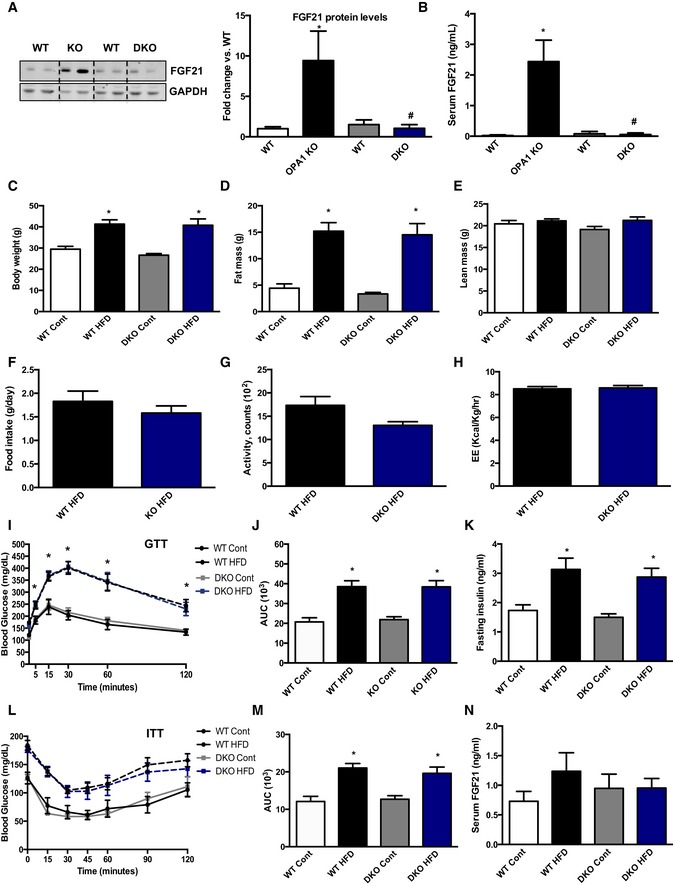
- A
Representative immunoblot of FGF21 in gastrocnemius muscle from 12‐week‐old mice and densitometric analysis of FGF21 normalized by GAPDH (n = 4).
- B
FGF21 serum levels in 12‐week‐old mOPA1 KO (KO), DKO mice, and their respective WT controls (WT) (n = 5).
- C–N
Metabolic data in DKO mice and their respective WT controls after 10 weeks of control or HFD. (C) Final body weight (n = 5–9). (D) Total fat mass (n = 5–9). (E) Total lean mass (n = 5–9). (F) Daily food intake (n = 4). (G) Activity level (n = 4). (H) Energy expenditure (n = 4). (I) Glucose tolerance tests (n = 9–16). (J) Area under the curve (AUC) for the GTT (n = 9–16). (K) Fasting insulin levels (n = 5–11). (L) Insulin tolerance test (n = 7–10). (M) Area under the curve (AUC) for the ITT (n = 7–10). (N) FGF21 plasma levels (n = 5–10).
Representative immunoblots and densitometric quantification of OPA1 normalized to GAPDH in gastrocnemius muscle from 12‐week‐old WT and mOPA1/FGF21 KO mice (n = 3).
BN‐PAGE in gastrocnemius muscle of 12‐week‐old mice (n = 4).
mtDNA copy number in gastrocnemius muscle of 12‐week‐old mice (n = 3–4).
Maximally stimulated succinate‐supported mitochondrial respirations in soleus from 20‐week‐old mice (n = 4–6).
Succinate‐supported ATP synthesis rates in soleus from 20‐week‐old mice (n = 4–5).
Maximally stimulated succinate‐supported mitochondrial respirations in soleus from 40‐week‐old mice (n = 5).
Measurements of grip strength in 40‐week‐old mice (n = 3).
Body weight and body composition in 20‐week‐old WT and DKO mice (n = 5–9).
Cross sections of gastrocnemius muscle from 20‐week‐old mice stained with wheat‐germ agglutinin (WGA). Scale bar = 50 μm.
Measurements of muscle fiber diameter in gastrocnemius muscle from 20‐week‐old mice (n = 3).
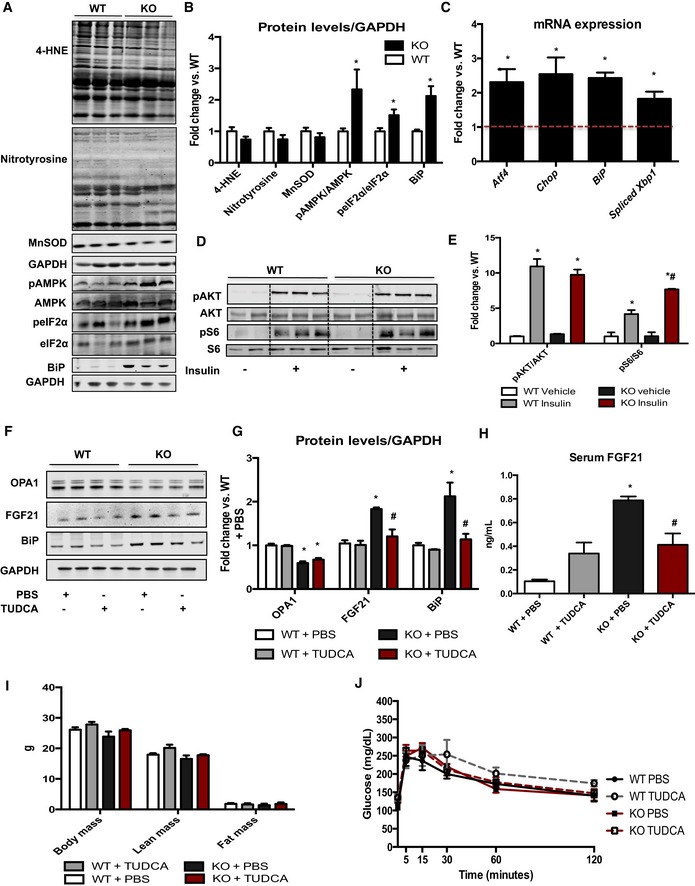
Representative immunoblots in gastrocnemius muscle from 12‐week‐old WT or mOPA1 KO (KO) mice.
Densitometric analysis of immunoblots of 4‐hydroxynonenal (4‐HNE), nitrotyrosine, MnSOD (n = 5), and BiP (n = 3) normalized to GAPDH protein levels (n = 5) and of pAMPK/AMPK (n = 5) and peIF2α/eIF2α ratios (n = 5).
mRNA expression of ER stress genes in gastrocnemius muscle from 20‐week‐old WT or mOPA1 KO (KO) mice (data are expressed as fold change vs. WT mice, represented as the dashed line) (n = 3–5).
AKT phosphorylation at Ser 473 and S6 phosphorylation at Ser235/236, 30 min after an i.p. injection of either saline or insulin, normalized by total AKT and total S6 levels, respectively.
Densitometric analysis of pAKT/AKT and pS6/S6 immunoblots (n = 3).
Representative immunoblots in soleus muscle from 12‐week‐old WT or mOPA1 KO (KO) mice treated with TUDCA for 4 weeks.
Densitometric analysis of immunoblots of OPA1, FGF21, and BiP normalized to GAPDH protein levels (n = 4).
FGF21 serum levels in 12‐week‐old mOPA1 KO mice and their respective WT controls 4 weeks after TUDCA treatment (n = 3–4).
Body weight and body composition in 12‐week‐old mice 4 weeks after TUDCA treatment (n = 3–5).
Glucose tolerance test in 12‐week‐old mice 4 weeks after TUDCA treatment (n = 4–6).
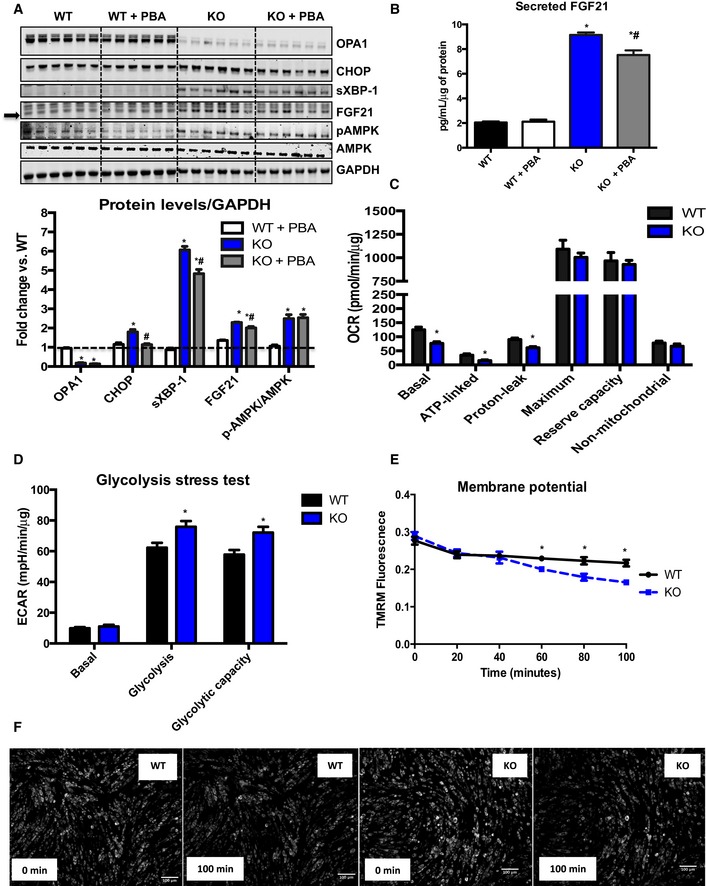
Representative immunoblots in primary myotubes obtained from OPA1fl/fl mice and infected with Ad‐GFP or Ad‐Cre. Cells were treated with either vehicle (PBS) or PBA for 3 days. Densitometric analysis of immunoblots of OPA1, CHOP, XBP‐1, and FGF21 normalized to GAPDH protein levels and of pAMPK/AMPK ratios (n = 6).
Secreted FGF21 levels measured in the media (n = 6).
Measurement of oxygen consumption rates (OCR) in primary myotubes 3 days after adenoviral infection (n = 8–10 technical replicates).
Measurements of extracellular acidification rates during a glycolysis stress test in primary myotubes 3 days after adenoviral infection (n = 8–10 technical replicates).
TMRM fluorescence over time after treatment with H2O2 (n = 3 technical replicates).
Representative pictures of primary myotubes stained with TMRM at times 0 (immediately after addition of H2O2) and 100 min after H2O2 treatment. Scale bar = 100 μm.
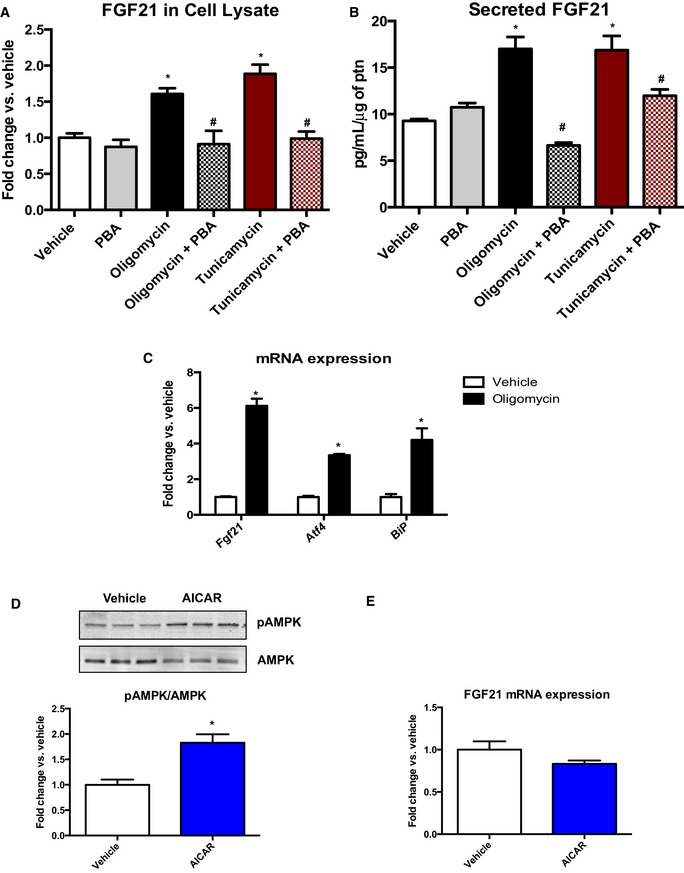
FGF21 protein levels measured by immunoblot, in cell lysates from C2C12 myotubes treated either with vehicle, oligomycin, or tunicamycin ± PBA for 8 h. Data are represented as fold change vs. vehicle normalized to GAPDH (n = 4–8).
FGF21 in the media secreted from C2C12 myotubes treated either with vehicle, oligomycin, or tunicamycin ± PBA for 8 h (n = 3).
mRNA expression of Fgf21, Atf4, and BiP in C2C12 myotubes treated with vehicle or oligomycin for 8 h (data are expressed as fold change vs. vehicle) (n = 4–6).
Western blot analysis and densitometric quantification of phosphorylated AMPK normalized to total AMPK in C2C12 cells treated with vehicle or AICAR for 12 h (n = 4).
FGF21 mRNA expression in C2C12 cells treated with vehicle or AICAR for 12 h (n = 3–4). Data are represented as fold change vs. vehicle.
References
-
- Arany Z, Lebrasseur N, Morris C, Smith E, Yang W, Ma Y, Chin S, Spiegelman BM (2007) The transcriptional coactivator PGC‐1beta drives the formation of oxidative type IIX fibers in skeletal muscle. Cell Metab 5: 35–46 - PubMed
MeSH terms
Substances
Grants and funding
LinkOut - more resources
Full Text Sources
Other Literature Sources
Medical
Molecular Biology Databases
