. 2017 Jun 27;114(26):E5226-E5235.
doi: 10.1073/pnas.1705066114. Epub 2017 Jun 12.

Maintenance of antiangiogenic and antitumor effects by orally active low-dose capecitabine for long-term cancer therapy

Affiliations

Maintenance of antiangiogenic and antitumor effects by orally active low-dose capecitabine for long-term cancer therapy

Yin Zhang et al. Proc Natl Acad Sci U S A. .

Abstract

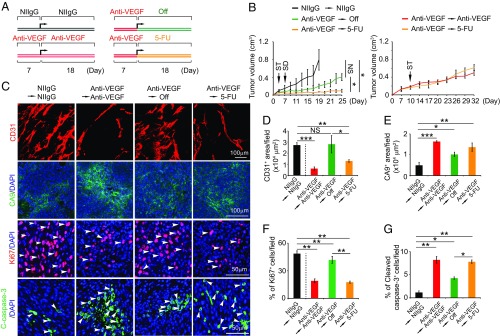
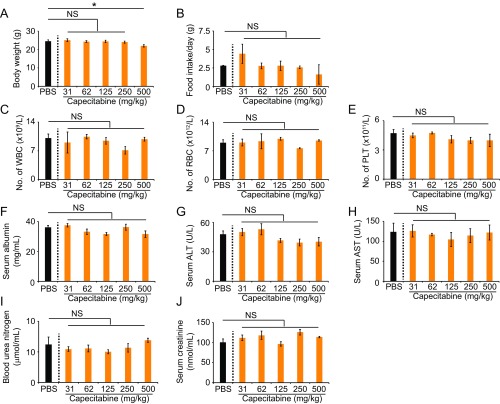
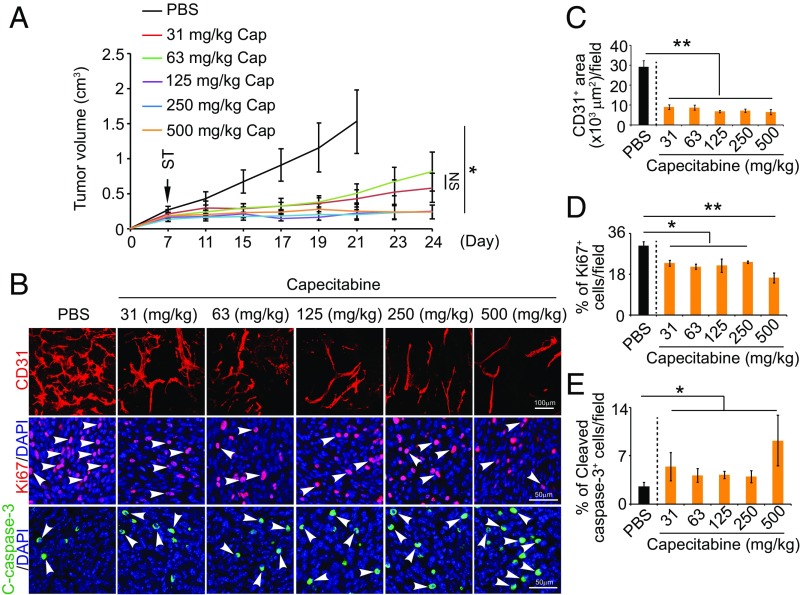
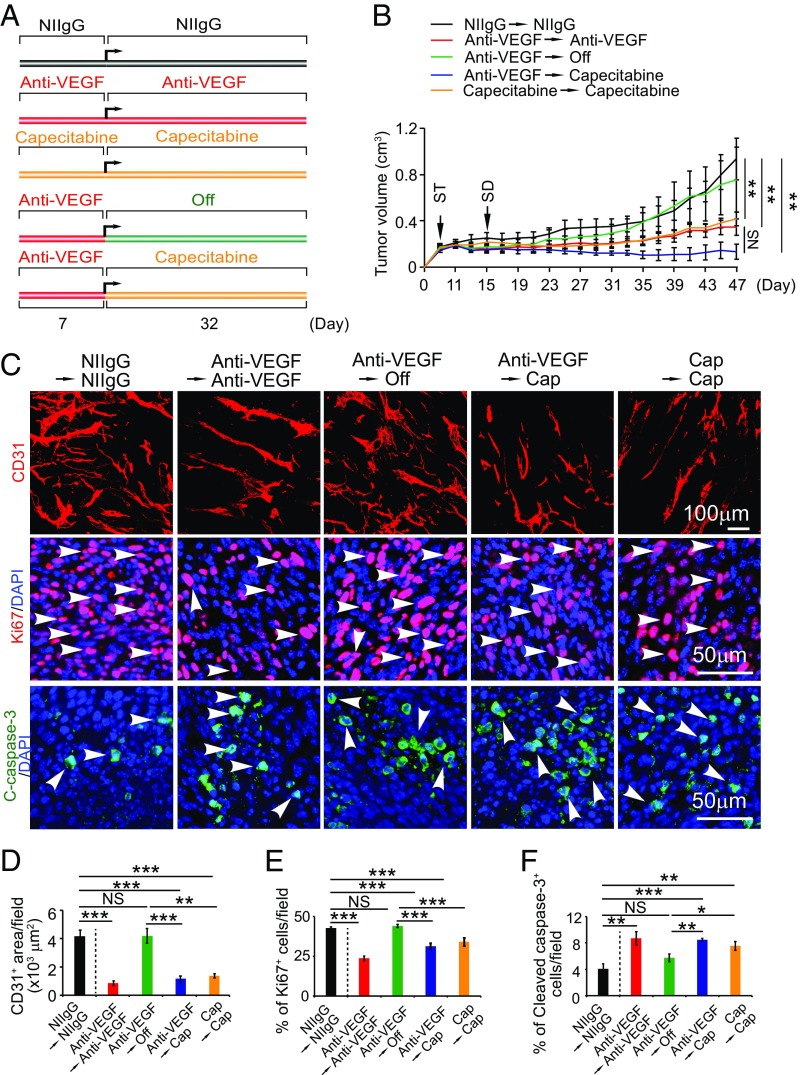
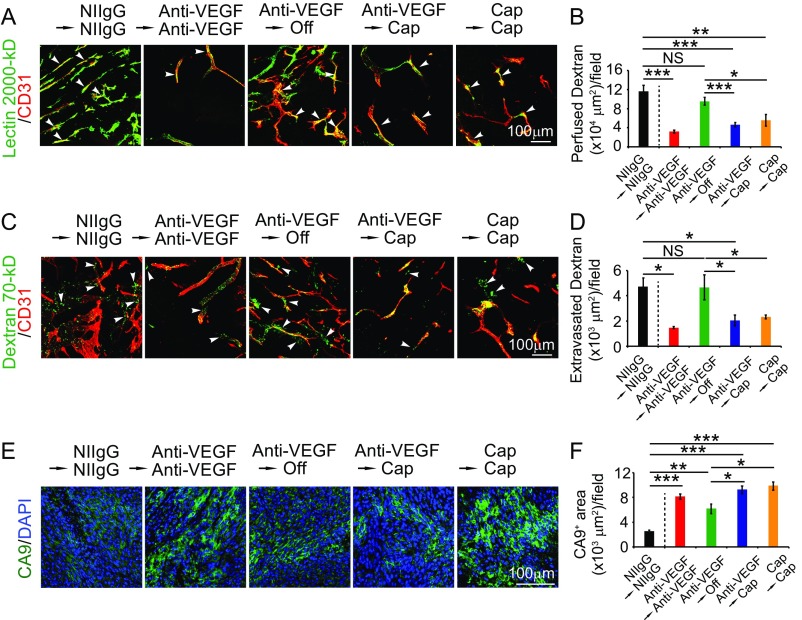
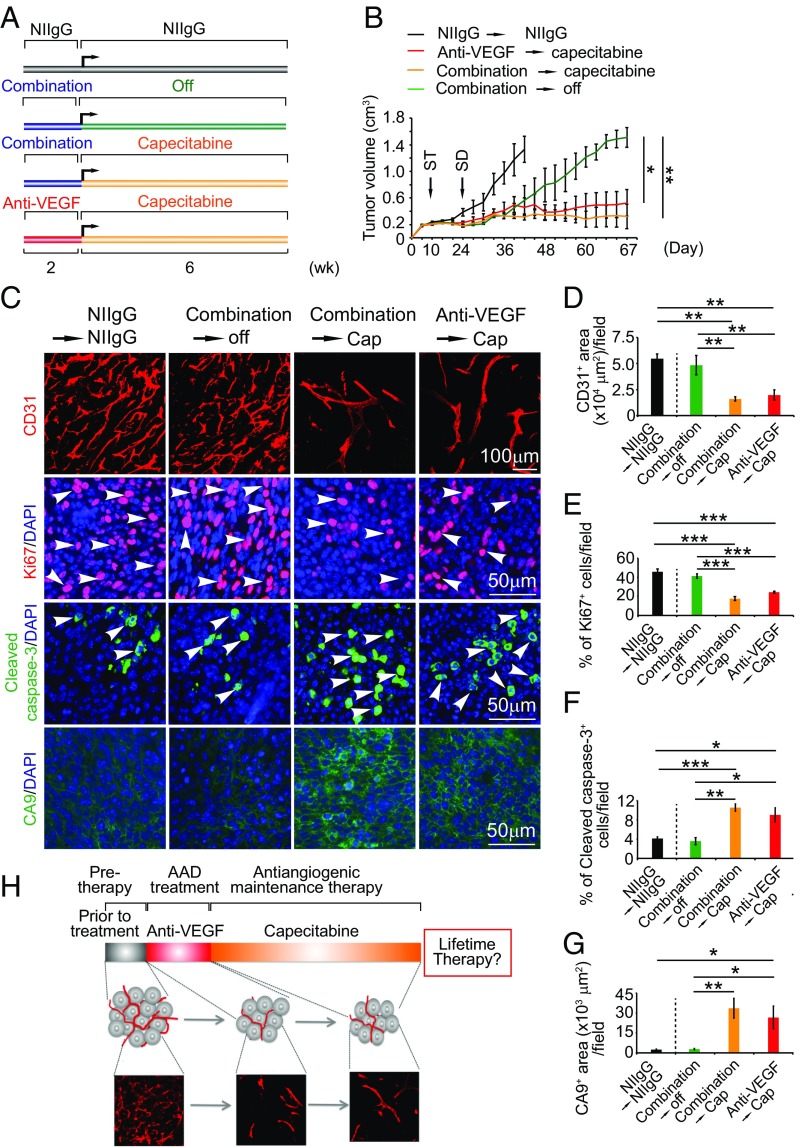
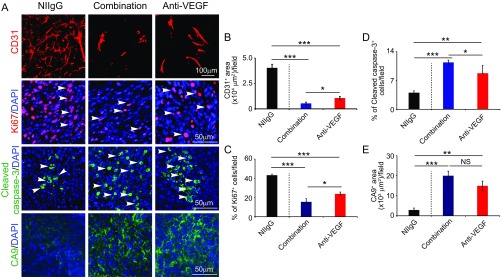
Long-term uninterrupted therapy is essential for maximizing clinical benefits of antiangiogenic drugs (AADs) in cancer patients. Unfortunately, nearly all clinically available AADs are delivered to cancer patients using disrupted regimens. We aim to develop lifetime, nontoxic, effective, orally active, and low-cost antiangiogenic and antitumor drugs for treatment of cancer patients. Here we report our findings of long-term maintenance therapy with orally active, nontoxic, low cost antiangiogenic chemotherapeutics for effective cancer treatment. In a sequential treatment regimen, robust antiangiogenic effects in tumors were achieved with an anti-VEGF drug, followed by a low-dose chemotherapy. The nontoxic, low dose of the orally active prodrug capecitabine was able to sustain the anti-VEGF-induced vessel regression for long periods. In another experimental setting, maintenance of low-dose capecitabine produced greater antiangiogenic and antitumor effects after AAD plus chemotherapy. No obvious adverse effects were developed after more than 2-mo of consecutive treatment with a low dose of capecitabine. Together, our findings provide a rationalized concept of effective cancer therapy by long-term maintenance of AAD-triggered antiangiogenic effects with orally active, nontoxic, low-cost, clinically available chemotherapeutics.

Keywords: VEGF; angiogenesis; cancer therapy; chemotherapy; tumor growth.


Conflict of interest statement

The authors declare no conflict of interest.

Figures

Fig. 1.
Fig. 1.
Antiproliferative effects of chemotherapeutics. IC50 values of a MTT assay were used to determine the antiproliferative effect. EC: endothelial cell; A549: human lung carcinoma; HT29: human colorectal adenocarcinoma; MDA-MB-231: human breast adenocarcinoma. (A) Inhibitory effects by antimetabolite drugs. (B) Inhibitory effects by alkylating drugs. (C) Inhibitory effects by cytostatic antibiotics. (D) Inhibitory effects by plant alkaloids. Data were quantified as mean determinants (n = 3 samples per group). Each experiment was repeated at least twice. Data are means ± SEM. *P < 0.05; **P < 0.01; ***P < 0.001. NS, not significant.
Fig. 2.
Fig. 2.
In vitro inhibitory effects of 5-FU on cell proliferation. (A and B) Inhibition of animal (CEC and MC38) and human (hEC and SW480) endothelial cell and colorectal cancer proliferation by various concentrations of 5-FU (n = 3 samples per group). (C and D) Antiproliferative effects of various concentrations of 5-FU on animal and human ECs and CRCs (n = 3 samples per group). Arrowheads indicate Ki67+ proliferating cells. (E and F) Induction of apoptosis by various concentrations of 5-FU on animal and human ECs and CRCs (n = 3 samples per group). Arrowheads indicate cleaved caspase 3+ apoptotic cells. Data are means ± SEM. **P < 0.01; ***P < 0.001. NS, not significant.
Fig. 3.
Fig. 3.
5-FU exhibits dose-dependent antitumor and antiangiogenic effects. (A) Growth rates of 5-FU–treated tumors (n = 6–8 animals per group). ST: starting treatment. (B) Representative histological images of CD31+ blood vessels, CA9+ hypoxia, Ki67+ proliferating cells, and cleaved caspase-3+ apoptotic cells. Arrowheads point to proliferating (red signal) and apoptotic (green signal) cells. (CF) Quantifications of CD31+ blood vessels, CA9+ hypoxia, Ki67+ proliferating cells, and cleaved caspase-3+ apoptotic cells in 5-FU–treated tumors (n = 6–8 random fields per group). Data are means ± SEM. *P < 0.05; **P < 0.01. ***P < 0.001. NS, not significant.
Fig. S1.
Fig. S1.
Toxicity of 5-FU for CRC tumor-bearing mice. The 5-FU dose escalation-induced toxicity profiles on body weight (A), food intake (B), peripheral white blood cell count (C), peripheral red blood cell count (D), platelet counts (E), serum albumin levels (F), serum levels of alanine aminotransferase (G), serum levels of aspartate transaminase (H), blood urea nitrogen levels (I), and serum creatinine levels (J) (n = 5–6 blood samples per group). Data are means ± SEM. *P < 0.05; **P < 0.01; ***P < 0.001. NS, not significant.
Fig. 4.
Fig. 4.
5-FU–induced antiangiogenic maintenance in colorectal tumors. (A) Treatment schedule. (B) Growth rates of continuous NIIgG-treated, continuous VEGF blockade-treated, VEGF blockade and cessation-treated, and VEGF blockade followed by a low dose of 5-FU–treated MC38 colorectal cancers (n = 6–7 mice per group). ST: starting treatment; SD: switching drug. (C) Representative histological images of CD31+ blood vessels, CA9+ hypoxia, Ki67+ proliferating cells, and cleaved caspase-3+ apoptotic cells. Arrowheads point to proliferating (red signal) and apoptotic (green signal) cells. (DG) Quantifications of CD31+ blood vessels, CA9+ hypoxia, Ki67+ proliferating cells, and cleaved caspase-3+ apoptotic cells in various agent-treated tumors (n = 6–8 random fields per group). Data are means ± SEM. *P < 0.05; **P < 0.01. ***P < 0.001. NS, not significant.
Fig. S2.
Fig. S2.
Capecitabine toxicity profiles for CRC tumor-bearing mice. Capecitabine dose escalation-induced toxicity profiles on body weight (A), food intake (B), peripheral white blood cell count (C), peripheral red blood cell count (D), platelet count (E), serum albumin levels (F), serum levels of alanine aminotransferase (G), serum levels of aspartate transaminase (H), blood urea nitrogen levels (I), and serum creatinine levels (J) (n = 5–6 blood samples per group). Data are means ± SEM. *P < 0.05. NS, not significant.
Fig. 5.
Fig. 5.
Dose-dependent antitumor and antiangiogenic effects by capecitabine. (A) Growth rates of capecitabine (Cap)-treated tumors (n = 6–8 animals per group). ST: starting treatment. (B) Representative histological images of CD31+ blood vessels, Ki67+ proliferating cells, and cleaved caspase-3+ apoptotic cells. Arrowheads point to proliferating (red signal) and apoptotic (green signal) cells. (CE) Quantifications of CD31+ blood vessels, Ki67+ proliferating cells, and cleaved caspase-3+ apoptotic cells in 5-FU–treated tumors (n = 6–8 random fields per group). Data are means ± SEM. *P < 0.05; **P < 0.01. NS, not significant.
Fig. 6.
Fig. 6.
Antiangiogenic and antitumor maintenance therapy with an extremely low dose of capecitabine. (A) Sequential treatment schedule. (B) Growth rates of continuous NIIgG-treated, continuous VEGF blockade-treated, continuous capecitabine-treated, VEGF blockade and cessation-treated, and VEGF blockade switching to low-dose capecitabine-treated MC38 colorectal cancers (n = 6–7 mice per group). ST: starting treatment; SD: switching drug. (C) Representative histological images of CD31+ blood vessels, Ki67+ proliferating cells, and cleaved caspase-3+ apoptotic cells. Arrowheads point to proliferating (red signal) and apoptotic (green signal) cells. (DF) Quantifications of CD31+ blood vessels, Ki67+ proliferating cells, and cleaved caspase-3+ apoptotic cells in various agent-treated tumors (n = 6–8 random fields per group). Data are means ± SEM. *P < 0.05; **P < 0.01; ***P < 0.001. NS, not significant.
Fig. S3.
Fig. S3.
Vessel perfusion, permeability, and hypoxia. (A) Blood perfusion in various agent-treated tumors. Green: lectin; red: CD31. Arrowheads point to perfused vessels. (B) Quantification of vessel perfusion (n = 6–8 random fields per group). (C) Vascular permeability of various agent-treated tumors. Green: dextran; red: CD31. Arrowheads point to leaked dextran signals. (D) Quantification of leaked dextran signals (n = 6–8 random fields per group). (E) Tumor hypoxia of various agent-treated tumors. Green: CA9+ signals; blue: DAPI+ signals. (F) Quantification of CA9+ signals (n = 6–8 random fields per group). Data are means ± SEM. *P < 0.05; **P < 0.01; ***P < 0.001. NS, not significant.
Fig. 7.
Fig. 7.
Sustaining potent antitumor and antiangiogenic effects by an extremely low dose of capecitabine. (A) Sequential treatment schedule. (B) Growth rates of NIIgG-treated, VEGF blockade plus capecitabine switching to cessation-treated, VEGF blockade plus capecitabine switching to low-dose capecitabine-treated, and VEGF blockade switching to low-dose capecitabine-MC38 colorectal cancers (n = 6–9 mice per group). ST: starting treatment; SD: switching drug. (C) Representative histological images of CD31+ blood vessels, Ki67+ proliferating cells, cleaved caspase-3+ apoptotic cells, and CA9+ hypoxia. Arrowheads point to proliferating (red signal) and apoptotic (green signal) cells. (DG) Quantifications of CD31+ blood vessels, Ki67+ proliferating cells, cleaved caspase-3+ apoptotic cells, and CA9+ hypoxia in various agent-treated tumors (n = 6–8 random fields per group). Data are means ± SEM. *P < 0.05; **P < 0.01; ***P < 0.001. NS, not significant. (H) Schematic diagram of capecitabine-based antiangiogenic maintenance therapy. Anti-VEGF treatment persists for a relatively short period (red bar), and the subsequent treatment was switched to an extremely low dose and nontoxic orally active capecitabine for long time. This therapeutic regimen produces robust antiangiogenic and antitumor effects.
Fig. S4.
Fig. S4.
Tumor microenvironmental changes after initial treatment with anti-VEGF alone or anti-VEGF plus capecitabine. (A) Representative histological images of CD31+ blood vessels, Ki67+ proliferating cells, cleaved caspase-3+ apoptotic cells, and CA9+ hypoxia. Arrowheads point to proliferating (red signal) and apoptotic (green signal) cells. (BE) Quantifications of CD31+ blood vessels, Ki67+ proliferating cells, cleaved caspase-3+ apoptotic cells, and CA9+ hypoxia in various agent-treated tumors (n = 6–8 random fields per group). Data are means ± SEM. *P < 0.05; **P < 0.01; ***P < 0.001. NS, not significant.

References

    1. Folkman J. Tumor angiogenesis: Therapeutic implications. N Engl J Med. 1971;285:1182–1186. - PubMed
    1. Cao Y, et al. Forty-year journey of angiogenesis translational research. Sci Transl Med. 2011;3:114rv3. - PMC - PubMed
    1. Ferrara N, Adamis AP. Ten years of anti-vascular endothelial growth factor therapy. Nat Rev Drug Discov. 2016;15:385–403. - PubMed
    1. Wadzinski MG, et al. Heparin-binding angiogenesis factors: Detection by immunological methods. Clin Physiol Biochem. 1987;5:200–209. - PubMed
    1. Davis S, et al. Isolation of angiopoietin-1, a ligand for the TIE2 receptor, by secretion-trap expression cloning. Cell. 1996;87:1161–1169. - PubMed

Publication types

LinkOut - more resources