. 2017 Jun 27;114(26):6776-6781.
doi: 10.1073/pnas.1700818114. Epub 2017 Jun 12.

Weak protein-protein interactions in live cells are quantified by cell-volume modulation

Affiliations

Weak protein-protein interactions in live cells are quantified by cell-volume modulation

Shahar Sukenik et al. Proc Natl Acad Sci U S A. .

Abstract

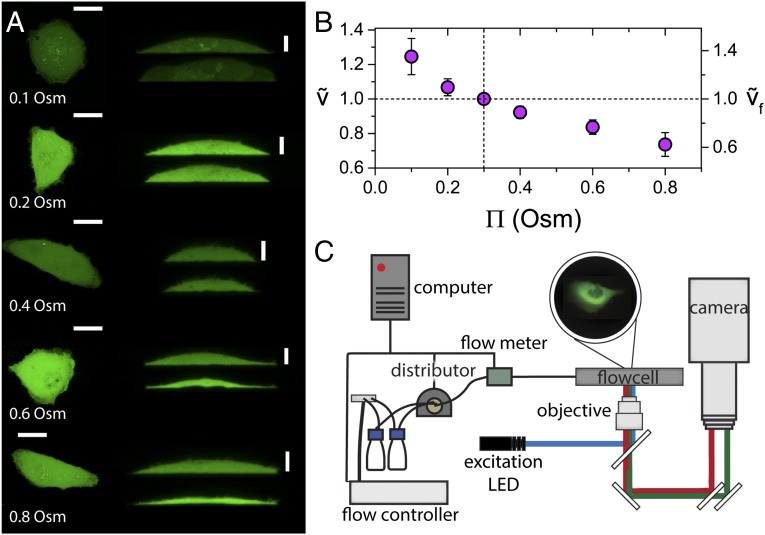
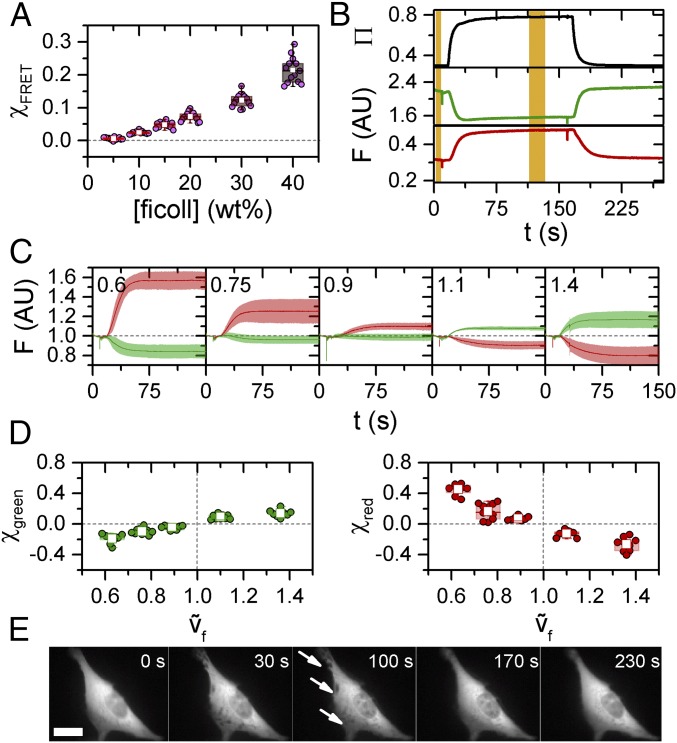
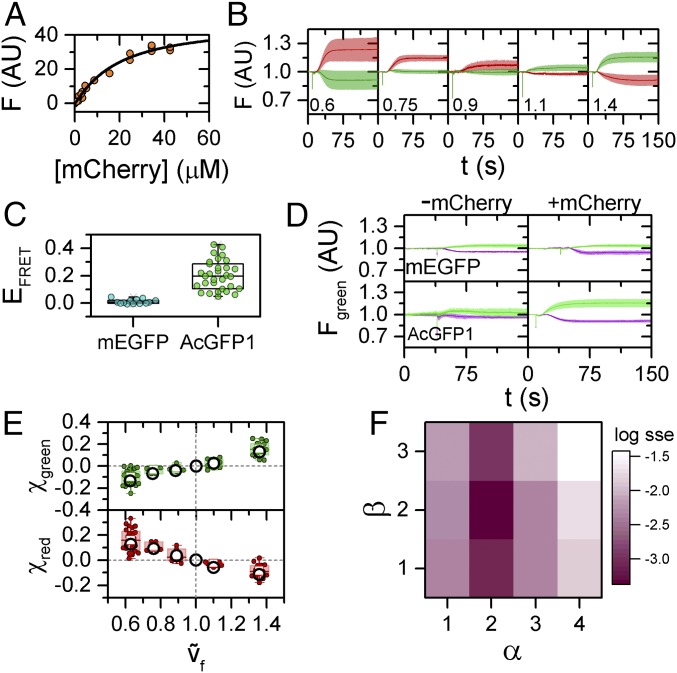
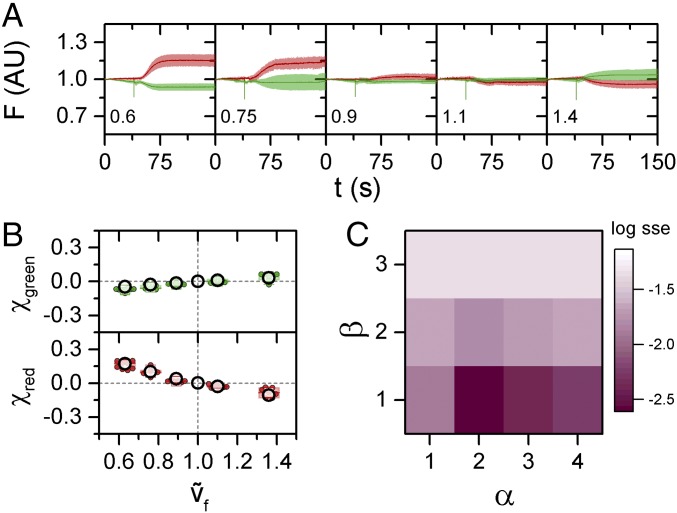
Weakly bound protein complexes play a crucial role in metabolic, regulatory, and signaling pathways, due in part to the high tunability of their bound and unbound populations. This tunability makes weak binding (micromolar to millimolar dissociation constants) difficult to quantify under biologically relevant conditions. Here, we use rapid perturbation of cell volume to modulate the concentration of weakly bound protein complexes, allowing us to detect their dissociation constant and stoichiometry directly inside the cell. We control cell volume by modulating media osmotic pressure and observe the resulting complex association and dissociation by FRET microscopy. We quantitatively examine the interaction between GAPDH and PGK, two sequential enzymes in the glycolysis catalytic cycle. GAPDH and PGK have been shown to interact weakly, but the interaction has not been quantified in vivo. A quantitative model fits our experimental results with log Kd = -9.7 ± 0.3 and a 2:1 prevalent stoichiometry of the GAPDH:PGK complex. Cellular volume perturbation is a widely applicable tool to detect transient protein interactions and other biomolecular interactions in situ. Our results also suggest that cells could use volume change (e.g., as occurs upon entry to mitosis) to regulate function by altering biomolecular complex concentrations.

Keywords: FRET; cell volume; live-cell microscopy; protein–protein interactions; quinary interactions.


Conflict of interest statement

The authors declare no conflict of interest.

Figures

Fig. 1.
Fig. 1.
Volume changes in response to osmotic pressure modulations. (A) Representative 3D confocal images of cells subjected to volume modulation. Image at Left shows maximum xy projection. Images at Right show an xz slice before (Upper) and 1 min after (Lower) osmotic challenge. (Scale bars: xy, 20 μm; xz, 10 μm.) Changes in intensity before and after osmotic challenge are due to concentration changes of the loaded dye (calcein AM) resulting from volume modulation. (B) Average relative cell-volume change (compared with isosmotic conditions) as function of osmolarity (see SI Appendix, Fig. S1 for details). Error bars are SD of the data from n > 10 measurements of individual cells. (C) Volume-modulation experimental setup.
Fig. 2.
Fig. 2.
Structural changes in fCrH2 in response to volume modulations. (A) Box chart showing relative FRET change of purified fCrH2 in increasing ficoll (polymeric crowder) concentrations. χFRET is measured relative to the absence of ficoll. For all box charts in this work, boxes span from 25 to 75% of the data, with the median shown as a line, and SD shown as whiskers. Colored circles are data points from individual experiments, with the average shown as a white square. (B) Osmolarity in Osm (Upper), and cell-average green and red fluorescence (Lower) collected from a cell expressing fCrH2 and subjected to an osmotic shift to 0.8 Osm. The yellow regions are averaged and used to calculate χ (Eq. 2). (C) Time traces of the normalized fluorescence changes to green and red fluorescence. f is specified on the top left corner of each trace. Shaded areas are SD of the mean, which is shown as a line. n > 10 for all data shown. (D) Relative changes to green (Left) and red (Right) fluorescence from data in C. The changes are shown as function of the relative free volume change, f. (E) Snapshots of the same cell as B at different stages of the experiment. Upon shifts to 0.8 Osm, or upon return to isosmotic conditions from 0.1 Osm, cells exhibited invaginations in their membranes (arrows) that disappeared when iso-osmotic conditions were restored, as observed previously (59). (Scale bar: 10 μm.)
Fig. 3.
Fig. 3.
Fluorescent protein association detected by volume modulations. (A) In vitro binding experiment shows AcGFP/mCherry association. Solid line is a concatenated fit of three experiments to the Hill equation, with Kd = 20 ± 5 μM, n = 1.1 ± 0.1 (see also SI Appendix, Fig. S7). (B) Changes to green and red fluorescence of cells coexpressing AcGFP1 and mCherry following volume modulation. Inset numbers are f. Lines are averages of n > 10 experiments for each volume modulation. Shaded areas are SD of the data. (C) EFRET (Eq. 2, Methods) under isosmotic conditions is negligible for mEGFP in the presence of mCherry compared with AcGFP1. The high variability for AcGFP1 is a result of different expression levels in each cell. Box charts as in Fig. 2. (D) Time trace of changes to green fluorescence under volume increase (green, 0.1 Osm) and decrease (magenta, 0.8 Osm) perturbation shows a response only for AcGFP1, not mEGFP. Shaded areas represent SD of all repeats, n > 5 for all experiments. (E) χ values for green and red fluorescence for AcGFP1-mCherry, obtained from experiments shown in B. Box charts as in Fig. 2. Open circles are fits of the model to the experimental data (see SI Appendix, Table S2 for fit constants). (F) Heat map showing log of the sum of square errors between fit and experimental results (sse) for different stoichiometries of AcGFP1 and mCherry (α and β, respectively; see SI Appendix, section S3 for details).
Fig. 4.
Fig. 4.
GAPDH-PGK binding detected by volume modulations. (A) Changes to green and red fluorescence of cells coexpressing labeled GAPDH and PGK from volume modulations. Inset numbers are the osmolarity of the modulation. Lines are averages of n > 7 experiments for each volume modulation. Shaded areas are SD of the data. (B) χ values for green and red fluorescence for GAPDH-PGK. Box charts are as in Fig. 2. Open circles are fits of the model to the experimental data (see SI Appendix, Table S2 for fit constants). (C) Heat map showing log of the sum of square errors between fit and experimental results (sse) for different stoichiometries of GAPDH and PGK (α and β, respectively; see SI Appendix, section S3 for details).

Similar articles

Cited by

References

    1. Schreiber G, Fersht AR. Rapid, electrostatically assisted association of proteins. Nat Struct Biol. 1996;3:427–431. - PubMed
    1. Caplow M, Fee L. Dissociation of the tubulin dimer is extremely slow, thermodynamically very unfavorable, and reversible in the absence of an energy source. Mol Biol Cell. 2002;13:2120–2131. - PMC - PubMed
    1. Phillip Y, Kiss V, Schreiber G. Protein-binding dynamics imaged in a living cell. Proc Natl Acad Sci USA. 2012;109:1461–1466. - PMC - PubMed
    1. König I, et al. Single-molecule spectroscopy of protein conformational dynamics in live eukaryotic cells. Nat Methods. 2015;12:773–779. - PubMed
    1. McConkey EH. Molecular evolution, intracellular organization, and the quinary structure of proteins. Proc Natl Acad Sci USA. 1982;79:3236–3240. - PMC - PubMed

Publication types

Substances

LinkOut - more resources