

Varicella-Zoster Virus-Specific Cellular Immune Responses to the Live Attenuated Zoster Vaccine in Young and Older Adults
- PMID: 28607114
- PMCID: PMC5505810
- DOI: 10.4049/jimmunol.1700290
Varicella-Zoster Virus-Specific Cellular Immune Responses to the Live Attenuated Zoster Vaccine in Young and Older Adults
Abstract
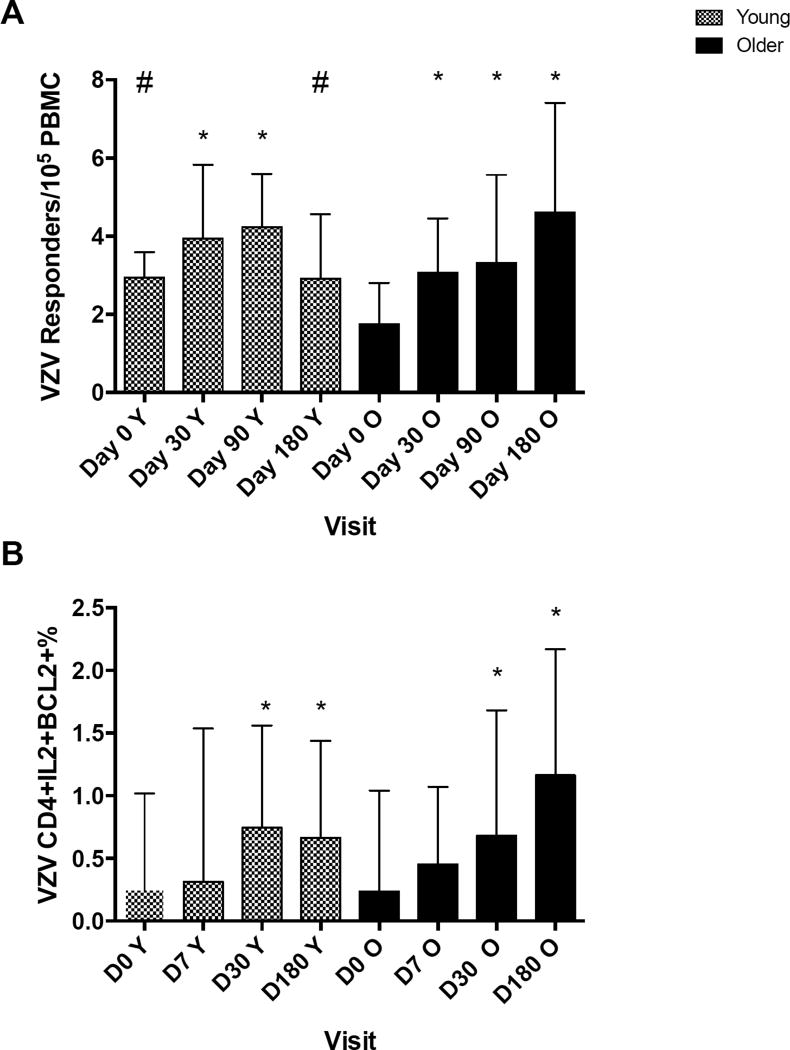
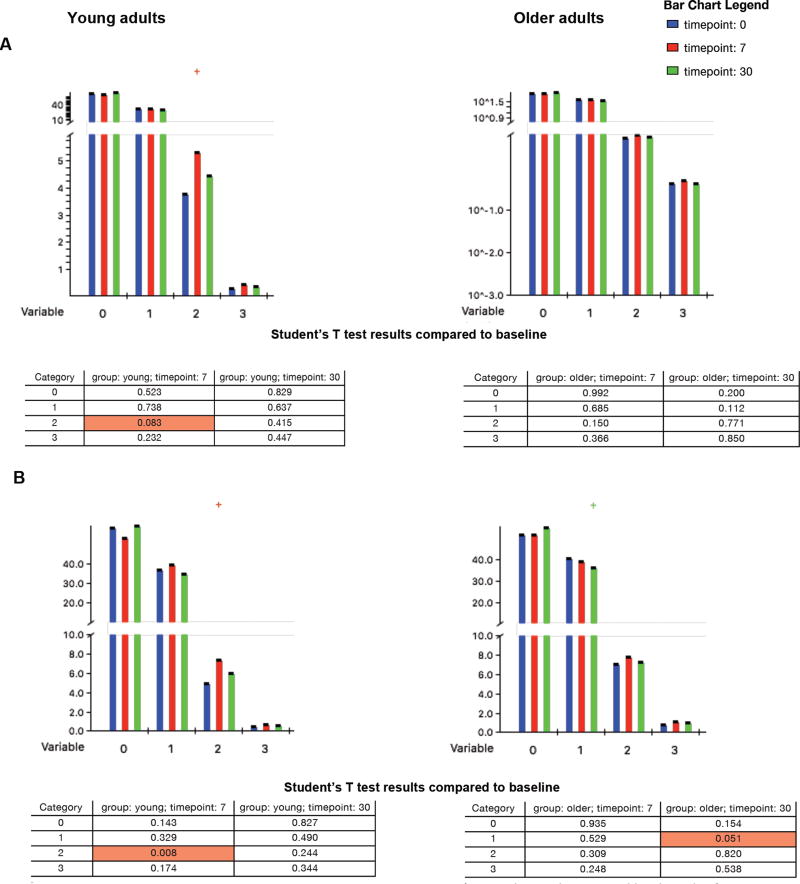
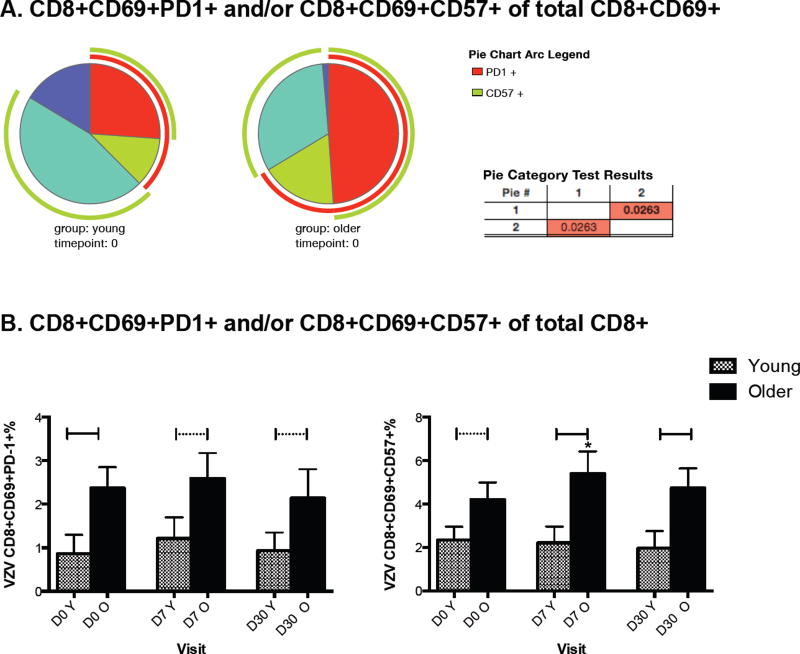
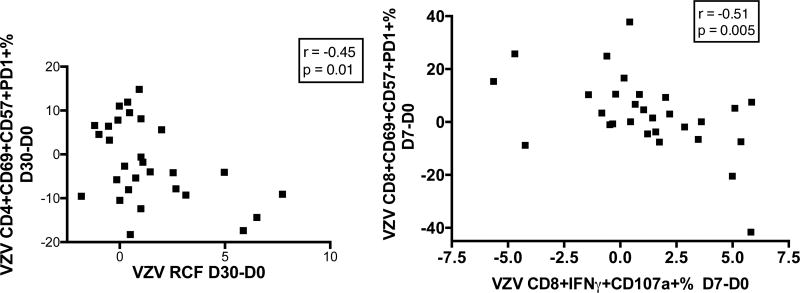
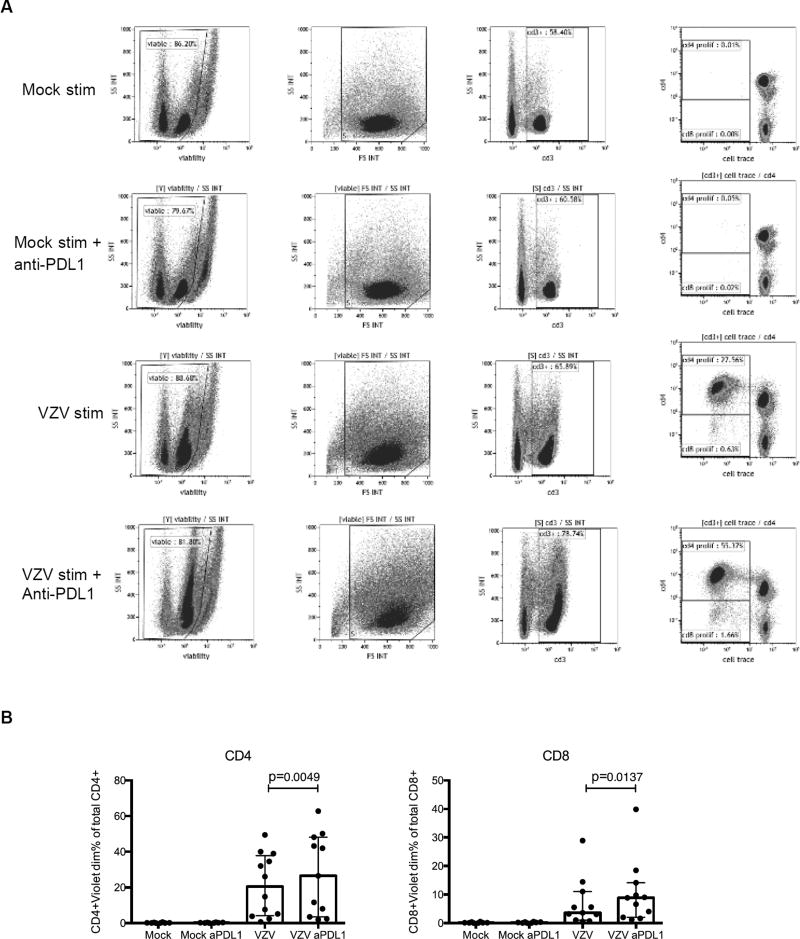
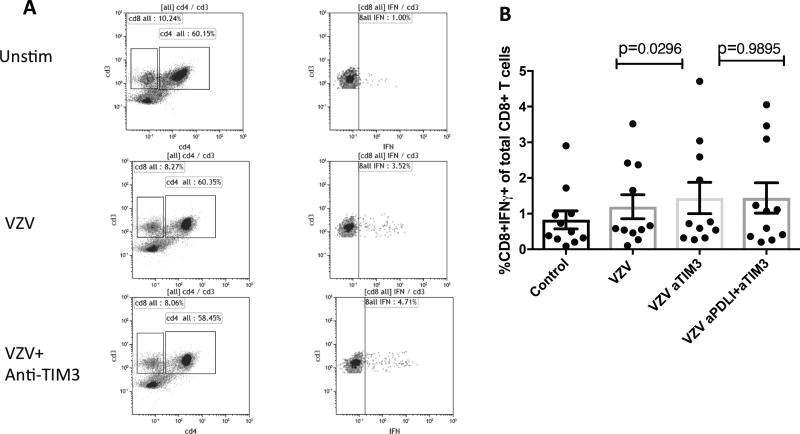
The incidence and severity of herpes zoster (HZ) increases with age. The live attenuated zoster vaccine generates immune responses similar to HZ. We compared the immune responses to zoster vaccine in young and older to adults to increase our understanding of the immune characteristics that may contribute to the increased susceptibility to HZ in older adults. Young (25-40 y; n = 25) and older (60-80 y; n = 33) adults had similar magnitude memory responses to varicella-zoster virus (VZV) ex vivo restimulation measured by responder cell-frequency and flow cytometry, but the responses were delayed in older compared with young adults. Only young adults had an increase in dual-function VZV-specific CD4+ and CD8+ T cell effectors defined by coexpression of IFN-γ, IL-2, and CD107a after vaccination. In contrast, older adults showed marginal increases in VZV-specific CD8+CD57+ senescent T cells after vaccination, which were already higher than those of young adults before vaccination. An increase in VZV-stimulated CD4+CD69+CD57+PD1+ and CD8+CD69+CD57+PD1+ T cells from baseline to postvaccination was associated with concurrent decreased VZV-memory and CD8+ effector responses, respectively, in older adults. Blocking the PD1 pathway during ex vivo VZV restimulation increased the CD4+ and CD8+ proliferation, but not the effector cytokine production, which modestly increased with TIM-3 blockade. We conclude that high proportions of senescent and exhausted VZV-specific T cells in the older adults contribute to their poor effector responses to a VZV challenge. This may underlie their inability to contain VZV reactivation and prevent the development of HZ.
Copyright © 2017 by The American Association of Immunologists, Inc.
Figures
Similar articles
-
The Effect of Age on the Immunogenicity of the Live Attenuated Zoster Vaccine Is Predicted by Baseline Regulatory T Cells and Varicella-Zoster Virus-Specific T Cell Immunity.J Virol. 2019 Jul 17;93(15):e00305-19. doi: 10.1128/JVI.00305-19. Print 2019 Aug 1. J Virol. 2019. PMID: 31092579 Free PMC article.
-
Age-Dependent Pre-Vaccination Immunity Affects the Immunogenicity of Varicella Zoster Vaccination in Middle-aged Adults.Front Immunol. 2018 Jan 23;9:46. doi: 10.3389/fimmu.2018.00046. eCollection 2018. Front Immunol. 2018. PMID: 29410671 Free PMC article.
-
Persistence of Varicella-Zoster Virus-Specific Plasma Cells in Adult Human Bone Marrow following Childhood Vaccination.J Virol. 2020 Jun 16;94(13):e02127-19. doi: 10.1128/JVI.02127-19. Print 2020 Jun 16. J Virol. 2020. PMID: 32321817 Free PMC article.
-
Immune senescence and vaccines to prevent herpes zoster in older persons.Curr Opin Immunol. 2012 Aug;24(4):494-500. doi: 10.1016/j.coi.2012.06.002. Epub 2012 Aug 2. Curr Opin Immunol. 2012. PMID: 22857823 Review.
-
VZV T cell-mediated immunity.Curr Top Microbiol Immunol. 2010;342:341-57. doi: 10.1007/82_2010_31. Curr Top Microbiol Immunol. 2010. PMID: 20473790 Review.
Cited by
-
Th1 regulatory events by infectious pathogens, herpes zoster and herpes simplex viruses: prospects for therapeutic options for atopic eczema.Postepy Dermatol Alergol. 2022 Aug;39(4):662-667. doi: 10.5114/ada.2022.118920. Epub 2022 Sep 1. Postepy Dermatol Alergol. 2022. PMID: 36090727 Free PMC article. Review.
-
Ageing of Immune System and Response to a Live-Attenuated Herpes Zoster Vaccine in Lung Transplant Candidates.Vaccines (Basel). 2021 Feb 28;9(3):202. doi: 10.3390/vaccines9030202. Vaccines (Basel). 2021. PMID: 33671003 Free PMC article.
-
Characteristics and economic burden of hospitalized patients with herpes zoster in China, before vaccination.Hum Vaccin Immunother. 2023 Dec 15;19(3):2268990. doi: 10.1080/21645515.2023.2268990. Epub 2023 Oct 30. Hum Vaccin Immunother. 2023. PMID: 37899682 Free PMC article.
-
Report on WHO meeting on immunization in older adults: Geneva, Switzerland, 22-23 March 2017.Vaccine. 2018 Feb 8;36(7):921-931. doi: 10.1016/j.vaccine.2017.12.029. Epub 2018 Jan 12. Vaccine. 2018. PMID: 29336923 Free PMC article.
-
A silver bullet for ageing medicine?: clinical relevance of T-cell checkpoint receptors in normal human ageing.Front Immunol. 2024 Feb 1;15:1360141. doi: 10.3389/fimmu.2024.1360141. eCollection 2024. Front Immunol. 2024. PMID: 38361938 Free PMC article. Review.
References
-
- Yawn BP, Saddier P, Wollan PC, St Sauver JL, Kurland MJ, Sy LS. A population-based study of the incidence and complication rates of herpes zoster before zoster vaccine introduction. Mayo Clin Proc. 2007;82:1341–1349. - PubMed
-
- Kost RG, Straus SE. Postherpetic neuralgia--pathogenesis, treatment, and prevention. N Engl J Med. 1996;335:32–42. - PubMed
-
- Choo PW, Galil K, Donahue JG, Walker AM, Spiegelman D, Platt R. Risk factors for postherpetic neuralgia. Arch Intern Med. 1997;157:1217–1224. - PubMed
-
- Mitchell BM, Bloom DC, Cohrs RJ, Gilden DH, Kennedy PG. Herpes simplex virus-1 and varicella-zoster virus latency in ganglia. J Neurovirol. 2003;9:194–204. - PubMed
Publication types
MeSH terms
Substances
Grants and funding
LinkOut - more resources
Full Text Sources
Other Literature Sources
Research Materials
