

Trends in Prehypertension and Hypertension Risk Factors in US Adults: 1999-2012
- PMID: 28607131
- PMCID: PMC5594566
- DOI: 10.1161/HYPERTENSIONAHA.116.09004
Trends in Prehypertension and Hypertension Risk Factors in US Adults: 1999-2012
Abstract
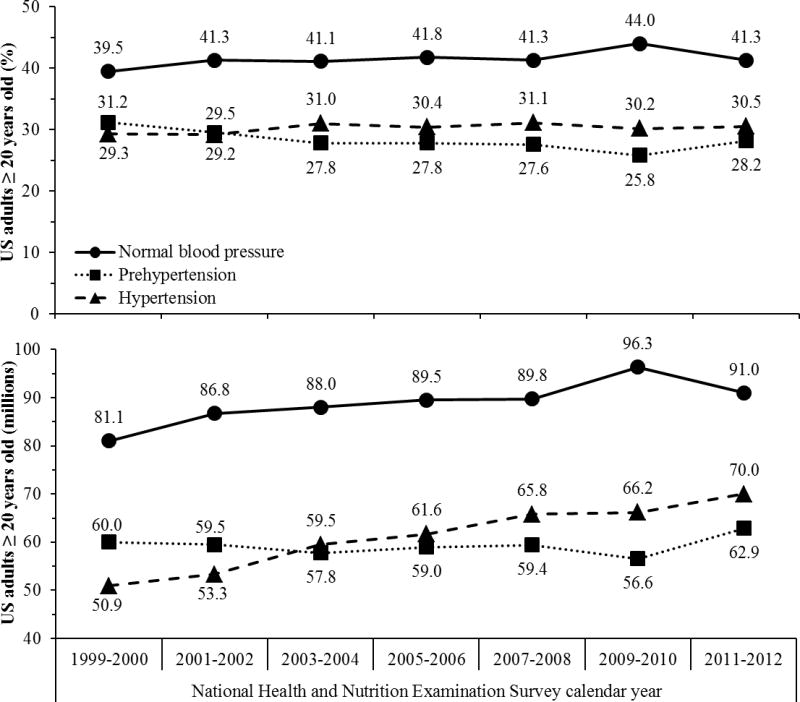
Prehypertension is associated with increased risk for hypertension and cardiovascular disease. Data are limited on the temporal changes in the prevalence of prehypertension and risk factors for hypertension and cardiovascular disease among US adults with prehypertension. We analyzed data from 30 958 US adults ≥20 years of age who participated in the National Health and Nutrition Examination Surveys between 1999 and 2012. Using the mean of 3 blood pressure (BP) measurements from a study examination, prehypertension was defined as systolic BP of 120 to 139 mm Hg and diastolic BP <90 mm Hg or diastolic BP of 80 to 89 mm Hg and systolic BP <140 mm Hg among participants not taking antihypertensive medication. Between 1999-2000 and 2011-2012, the percentage of US adults with prehypertension decreased from 31.2% to 28.2% (P trend=0.007). During this time period, the prevalence of several risk factors for cardiovascular disease and incident hypertension increased among US adults with prehypertension, including prediabetes (9.6% to 21.6%), diabetes mellitus (6.0% to 8.5%), overweight (33.5% to 37.3%), and obesity (30.6% to 35.2%). There was a nonstatistically significant increase in no weekly leisure-time physical activity (40.0% to 43.9%). Also, the prevalence of adhering to the Dietary Approaches to Stop Hypertension eating pattern decreased (18.4% to 11.9%). In contrast, there was a nonstatistically significant decline in current smoking (25.9% to 23.2%). In conclusion, the prevalence of prehypertension has decreased modestly since 1999-2000. Population-level approaches directed at adults with prehypertension are needed to improve risk factors to prevent hypertension and cardiovascular disease.
Keywords: blood pressure; exercise; nutrition surveys; prehypertension; prevention; risk factors; trend.
© 2017 American Heart Association, Inc.
Conflict of interest statement
Figures
References
-
- Chobanian AV, Bakris GL, Black HR, Cushman WC, Green LA, Izzo JL, Jr, Jones DW, Materson BJ, Oparil S, Wright JT, Jr, Roccella EJ, National Heart L, Blood Institute Joint National Committee on Prevention DE, Treatment of High Blood P, National High Blood Pressure Education Program Coordinating C The seventh report of the joint national committee on prevention, detection, evaluation, and treatment of high blood pressure: The jnc 7 report. JAMA: The Journal of the American Medical Association. 2003;289:2560–2572. - PubMed
-
- Vasan RS, Larson MG, Leip EP, Evans JC, O’Donnell CJ, Kannel WB, Levy D. Impact of high-normal blood pressure on the risk of cardiovascular disease. The New England Journal of Medicine. 2001;345:1291–1297. - PubMed
-
- Muntner P, Woodward M, Mann DM, Shimbo D, Michos ED, Blumenthal RS, Carson AP, Chen H, Arnett DK. Comparison of the framingham heart study hypertension model with blood pressure alone in the prediction of risk of hypertension: The multi-ethnic study of atherosclerosis. Hypertension. 2010;55:1339–1345. - PMC - PubMed
-
- Egan BM, Stevens-Fabry S. Prehypertension–prevalence, health risks, and management strategies. Nature Reviews Cardiology. 2015;12:289–300. - PubMed
Publication types
MeSH terms
Substances
Grants and funding
LinkOut - more resources
Full Text Sources
Other Literature Sources
Medical
