. 2017 Jul 19;37(29):6816-6836.
doi: 10.1523/JNEUROSCI.0125-17.2017. Epub 2017 Jun 12.

Unique versus Redundant Functions of Neuroligin Genes in Shaping Excitatory and Inhibitory Synapse Properties

Affiliations

Unique versus Redundant Functions of Neuroligin Genes in Shaping Excitatory and Inhibitory Synapse Properties

Soham Chanda et al. J Neurosci. .

Abstract

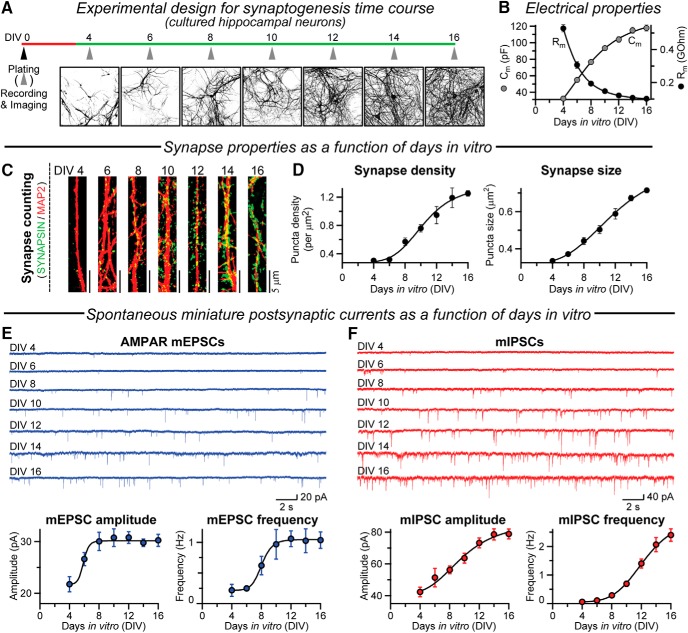
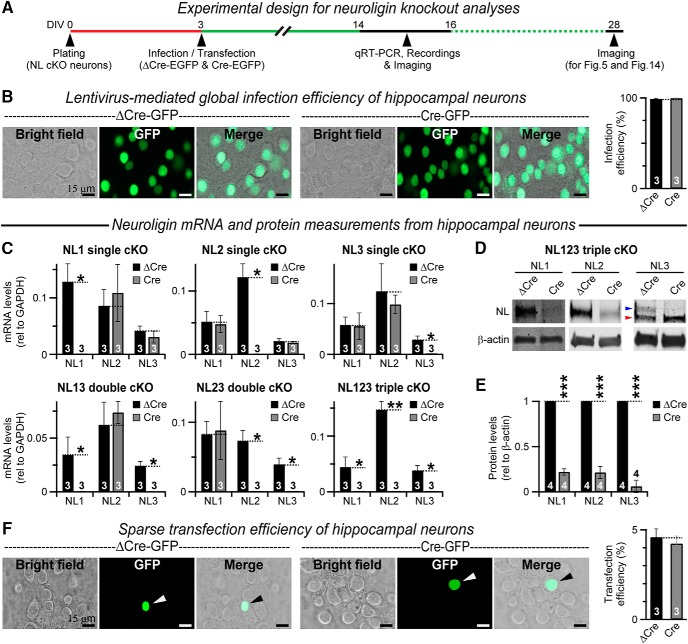
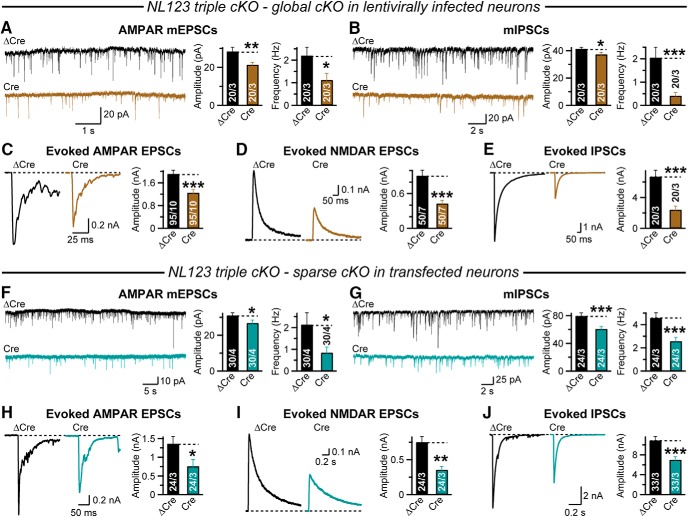
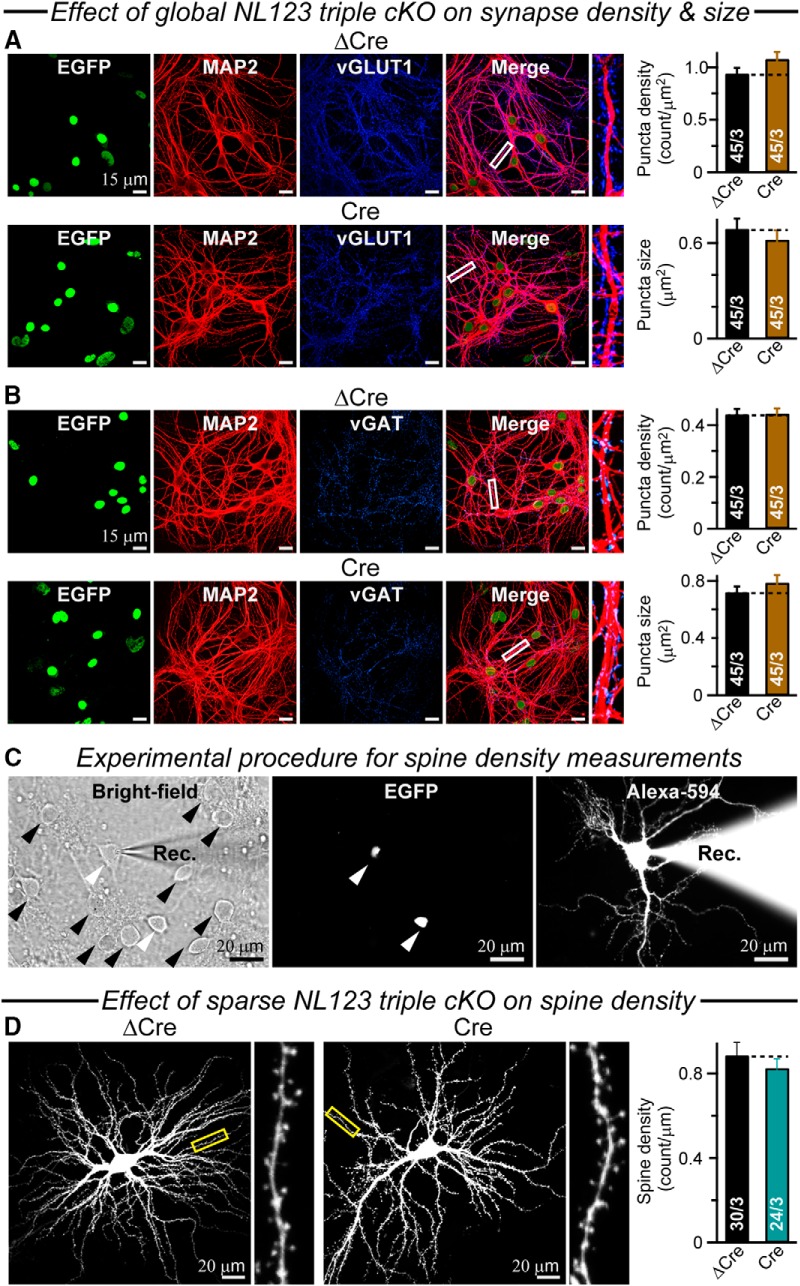
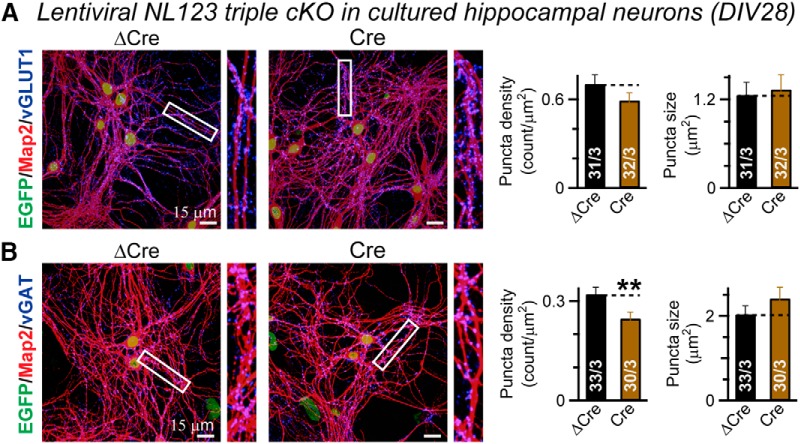
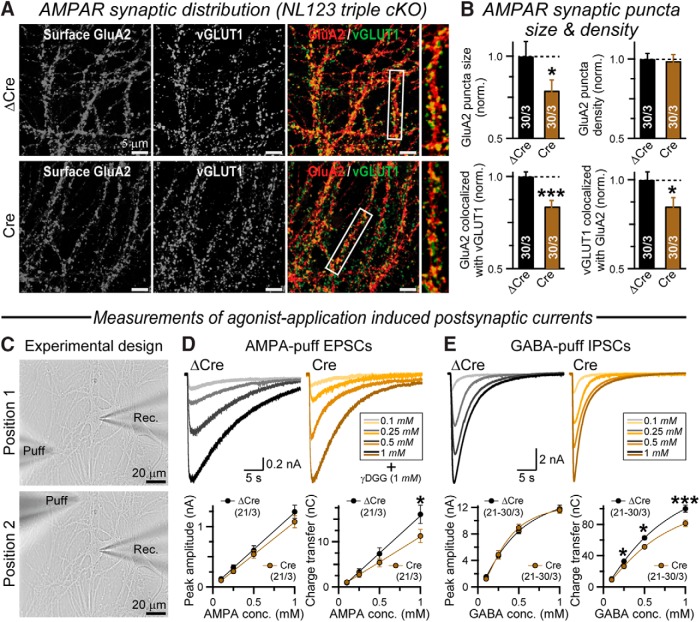
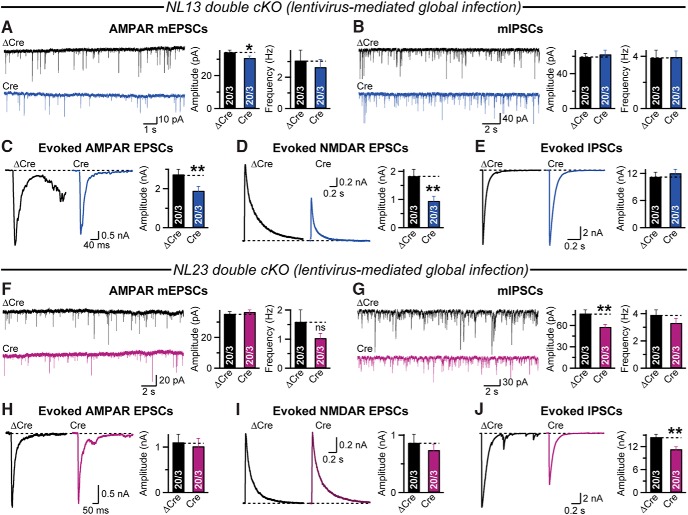
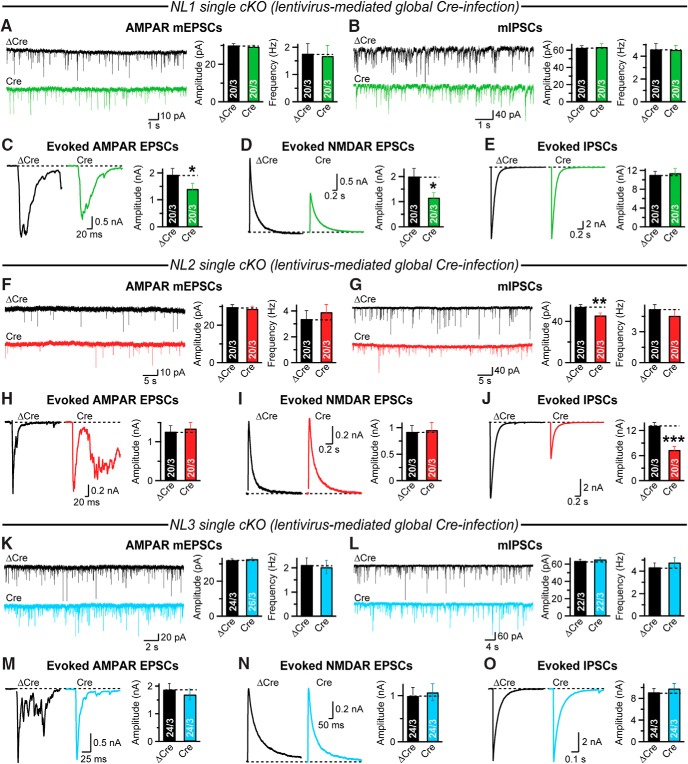
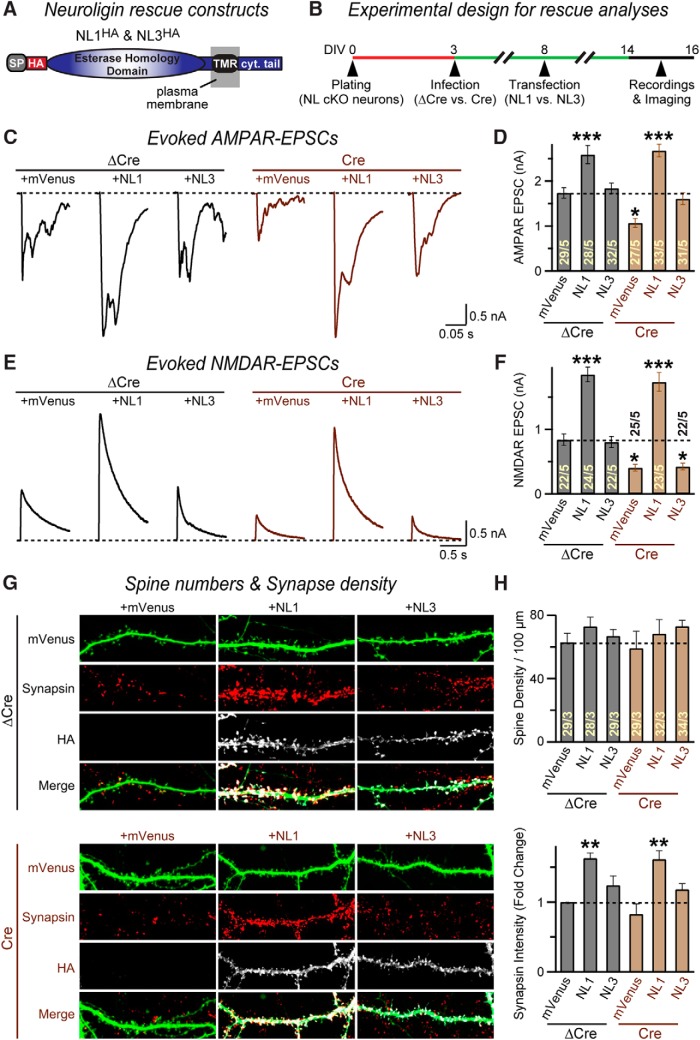
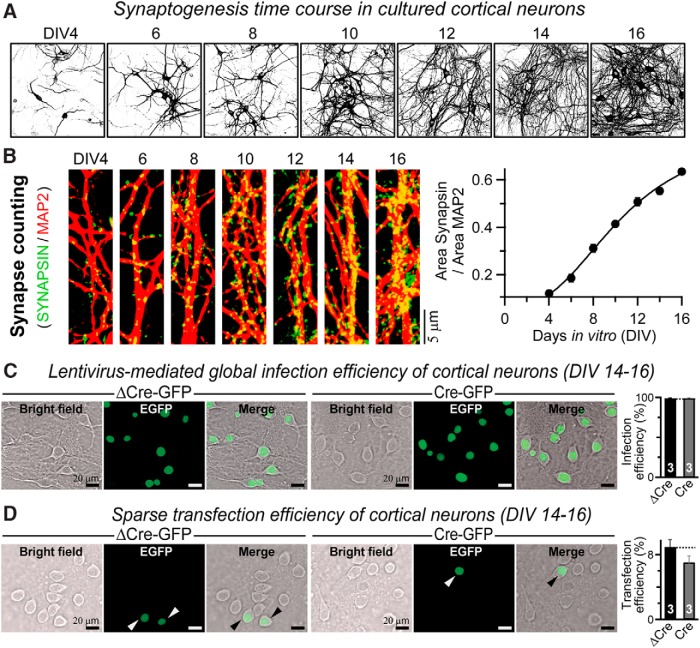
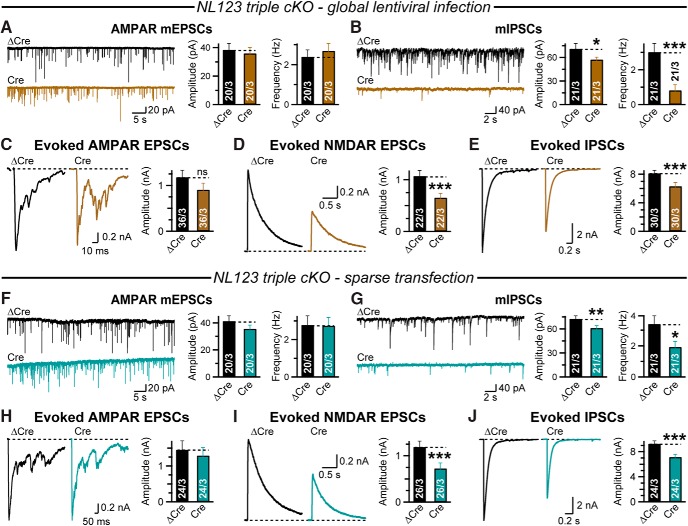
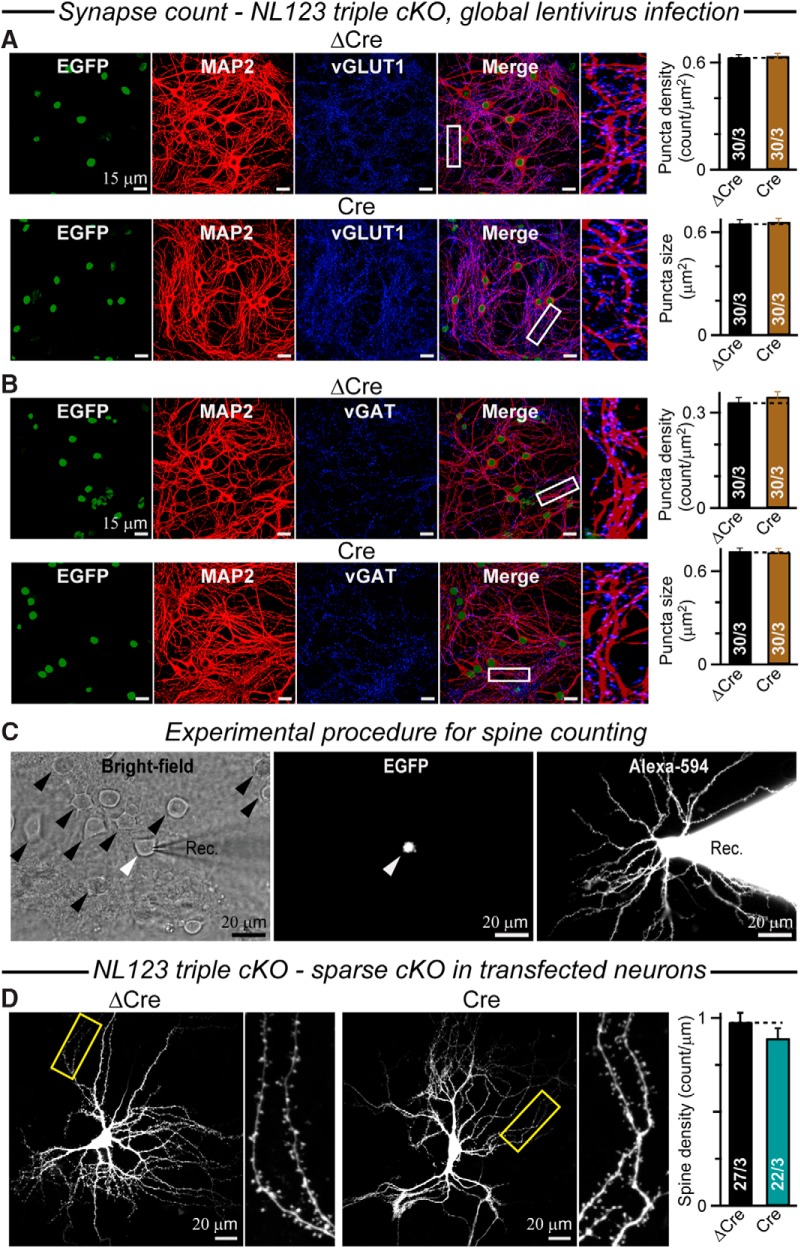
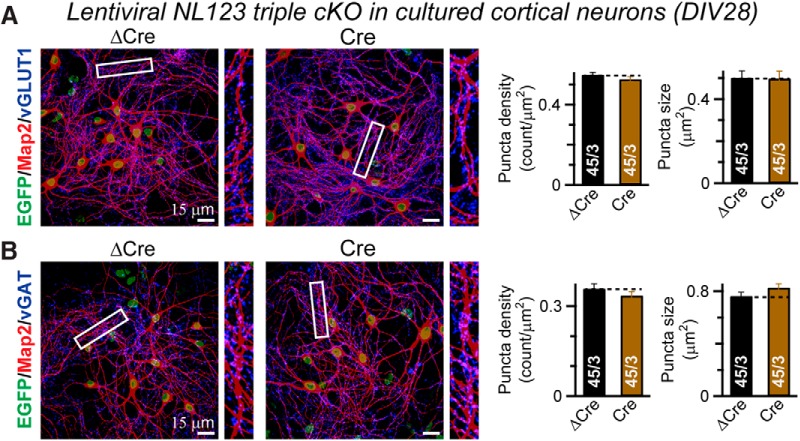
Neuroligins are evolutionarily conserved postsynaptic cell adhesion molecules that interact with presynaptic neurexins. Neurons express multiple neuroligin isoforms that are targeted to specific synapses, but their synaptic functions and mechanistic redundancy are not completely understood. Overexpression or RNAi-mediated knockdown of neuroligins, respectively, causes a dramatic increase or decrease in synapse density, whereas genetic deletions of neuroligins impair synapse function with only minor effects on synapse numbers, raising fundamental questions about the overall physiological role of neuroligins. Here, we have systematically analyzed the effects of conditional genetic deletions of all major neuroligin isoforms (i.e., NL1, NL2, and NL3), either individually or in combinations, in cultured mouse hippocampal and cortical neurons. We found that conditional genetic deletions of neuroligins caused no change or only a small change in synapses numbers, but strongly impaired synapse function. This impairment was isoform specific, suggesting that neuroligins are not functionally redundant. Sparse neuroligin deletions produced phenotypes comparable to those of global deletions, indicating that neuroligins function in a cell-autonomous manner. Mechanistically, neuroligin deletions decreased the synaptic levels of neurotransmitter receptors and had no effect on presynaptic release probabilities. Overexpression of neuroligin-1 in control or neuroligin-deficient neurons increased synaptic transmission and synapse density but not spine numbers, suggesting that these effects reflect a gain-of-function mechanism; whereas overexpression of neuroligin-3, which, like neuroligin-1 is also targeted to excitatory synapses, had no comparable effect. Our data demonstrate that neuroligins are required for the physiological organization of neurotransmitter receptors in postsynaptic specializations and suggest that they do not play a major role in synapse formation.SIGNIFICANCE STATEMENT Human neuroligin genes have been associated with autism, but the cellular functions of different neuroligins and their molecular mechanisms remain incompletely understood. Here, we performed comparative analyses in cultured mouse neurons of all major neuroligin isoforms, either individually or in combinations, using conditional knockouts. We found that neuroligin deletions did not affect synapse numbers but differentially impaired excitatory or inhibitory synaptic functions in an isoform-specific manner. These impairments were due, at least in part, to a decrease in synaptic distribution of neurotransmitter receptors upon deletion of neuroligins. Conversely, the overexpression of neuroligin-1 increased synapse numbers but not spine numbers. Our results suggest that various neuroligin isoforms perform unique postsynaptic functions in organizing synapses but are not essential for synapse formation or maintenance.

Keywords: conditional knockout; neuroligin; primary neuronal culture; synapse development; synaptic transmission; synaptogenesis.


Figures

Figure 1.
Figure 1.
Time course of excitatory and inhibitory synaptogenesis in cultured hippocampal neurons. A, Schematic illustration of experimental design (top) and representative images of neuronal morphology as a function of in vitro culture time (bottom, visualized by MAP2 immunostaining). Hippocampal neurons were cultured from newborn mice (black arrowhead), and electrophysiological and morphological parameters of synaptic maturation were monitored at DIV4 to DIV16 (gray arrowheads) as described in B–F. B, Cm and Rm of hippocampal neurons mature gradually in culture. The capacitance and input resistance values (mean ± SEM) are plotted as a function of culture time (n = 51–75 neurons/time point from three independent cultures). Data were fitted to a Hill function (P = Pmax/[1 + (bar graph/DIV)n], where P = Cm or Rm; for Cm, Pmax = 135.46 ± 14.2 pF, n = 2.54 ± 0.73, and K1/2 = 7.78 ± 0.45 d; for Rm, Pmax = 86.13 ± 12.5 MΩ, n = 3.05 ± 0.82, and K1/2 = 4.46 ± 1.29 d. C, D, Overall synaptogenesis proceeds continuously from DIV4 to DIV16 in cultured hippocampal neurons. Neurons were double labeled by immunofluorescence for MAP2 (red) and synapsin (green). The density of synaptic puncta per MAP2-positive area and the size of synaptic puncta were measured [C, representative images; D, plots of synaptic puncta density and size as a function of culture time (mean ± SEM; n = 20 fields/DIV, 3 independent batches)]. In D, data were fitted to a Hill function (see legend to B); for synapse density, Pmax = 1.36 ± 0.12 puncta/μm2, n = 4.99 ± 1.41, and K1/2 = 10.37 ± 0.71 d; for synapse size, Pmax = 0.87 ± 0.13 μm2, n = 3.32 ± 0.9, and K1/2 = 12 ± 1.82 d. E, Measurements of spontaneous mEPSCs uncover early formation of functional glutamatergic synapses in cultured hippocampal neurons [top, representative traces; bottom, summary plots of the mEPSC amplitude (left) and frequency (right); data are means ± SEM; n = 49–87 cells/DIV]. Data were fitted to a Hill function (see legend for B); for the mEPSC amplitude, Pmax = 30.15 ± 0.51 pA, n = 15.89 ± 104, and K1/2 = 5.88 ± 0.87 d; for the mEPSC frequency, Pmax = 1.05 ± 0.09 Hz, n = 11.31 ± 10.6, and K1/2 = 8.04 ± 0.57 d. F, Same as E, except for GABAAR-mediated mIPSCs, n = 64–114 cells/DIV). For mIPSC amplitude, Pmax = 85.99 ± 11.4 pA, n = 3.67 ± 2.04, and K1/2 = 9.62 ± 1.38 d; and for mIPSC frequency, Pmax = 3.02 ± 0.6 Hz, n = 5.62 ± 0.95, and K1/2 = 12.46 ± 1.11 d.
Figure 2.
Figure 2.
Validation of acute cKO of neuroligins in cultured hippocampal neurons using lentiviral expression of Cre-recombinase in all neurons or transfection of Cre-recombinase in a subset of neurons, with ΔCre as a negative control in all cases. A, Strategy for neuroligin cKO analysis. Hippocampal neurons cultured from newborn neuroligin cKO mice were uniformly infected at DIV3 with lentiviruses expressing EGFP-tagged wild-type Cre-recombinase (Cre) or a mutant version of the same (ΔCre), or alternatively sparsely transfected at DIV3 with plasmids encoding the same proteins. All subsequent analyses of neuroligin KOs were performed at DIV14-16, if not mentioned otherwise. Particularly for Figure 5 and Fig. 14, DIV3-infected Cre- or ΔCre-expressing neurons were cultured for an extended period and were analyzed at DIV28. B, Lentiviral infection expresses Cre or ΔCre in all neurons (left, representative images; right, summary graphs of the infection efficiency quantified via the nuclear EGFP signal of lentivirally encoded Cre-EGFP or ΔCre-EGFP). C, Quantitative RT-PCR measurements confirm that lentiviral Cre expression at DIV3 reduces neuroligin expression below the detection limit at DIV14-16. Bar graphs show GAPDH-normalized neuroligin mRNA expressions for NL1, NL2, and NL3, in cultured hippocampal neurons expressing ΔCre (black) or Cre (gray); neurons were cultured from the indicated cKO mice. D, E, Representative images (D) and summary graphs (E) of Western blot analysis for NL1, NL2, and NL3 protein expressions in DIV14-16 primary hippocampal neurons derived from NL123 triple cKO animals, which were infected with lentivirus encoding either ΔCre or Cre at DIV3. The neuroligin signals (NL) were normalized to corresponding β-actin signals for quantifications in E. Arrowheads in D indicate NL3 signal (blue) and a nonspecific band (red). F, Same as B, except for Ca2+ phosphate-mediated sparse transfection of cultured hippocampal neurons. For all summary graphs, average values are presented as the mean ± SEM. along with numbers of independent cultures. Asterisks show significant differences between ΔCre and Cre conditions, as assessed by paired, one-tailed t test (*p < 0.05; **p < 0.01; ***p < 0.005).
Figure 3.
Figure 3.
Acute triple KO of NL1, NL2, and NL3 (NL123) in cultured hippocampal neurons impairs excitatory and inhibitory synaptic strength by a cell-autonomous, postsynaptic mechanism. A, B, Acute lentiviral deletion of NL123 decreases the amplitudes and frequency of spontaneous mEPSCs (A) and mIPSCs (B). Left, representative traces; right, summary graphs of the mEPSC/mIPSC amplitudes and frequency at DIV14-16. C–E, Acute lentiviral deletion of NL123 decreases the amplitudes of evoked synaptic responses in excitatory synapses (measured as AMPAR-mediated, C; and NMDAR-mediated EPSCs; D) and in inhibitory synapses (IPSCs; E). Left, Representative traces. Right, Summary graphs of the EPSC/IPSC amplitudes at DIV14-16. F–J, Same as A–E, except that hippocampal neurons cultured from NL123 triple cKO mice were sparsely transfected with plasmids encoding ΔCre or Cre, as indicated. Data are reported as the mean ± SEM; numbers of neurons/independent cultures analyzed are shown in bars. Significant differences between ΔCre and Cre conditions are indicated with asterisks (*p < 0.05; **p < 0.01; ***p < 0.005; unpaired, one-tailed t test).
Figure 4.
Figure 4.
Acute cKO of neuroligins does not alter synapse or spine numbers in cultured hippocampal neurons. A, Uniform deletion of neuroligins in all neurons does not decrease excitatory synapse density in hippocampal neurons cultured from NL123 triple cKO mice. Neurons were infected at DIV3 with lentiviruses expressing ΔCre (top row) or Cre (bottom row), and immunostained at DIV14-16 for EGFP to identify nuclear ΔCre/Cre expression, for MAP2 to label dendrites, and for vGLUT1 to mark excitatory synapses. Left, representative images as indicated (right view shows an expanded view of the selected dendrites boxed in the merged image); right, summary graphs of the density (top) or size (bottom) of vGLUT1-positive synaptic puncta. B, Same as A, except that neurons were immunostained for vGAT to mark inhibitory synapses. C, Neurons cultured from NL123 triple cKO mice were sparsely transfected at DIV3 with plasmids expressing ΔCre-EGFP or Cre-EGFP, and patched at DIV14-16 with a recording pipette (Rec.) containing the fluorescent dye Alexa Fluor-594 to enable visualization of the entire dendritic arbor and of spines of a transfected neuron (left, bright-field image, with white and black arrowheads indicating transfected and nontransfected neighboring neurons, respectively; center, EGFP fluorescence of transfected neurons expressing nuclear Cre- or ΔCre-EGFP fusion proteins; right, Alexa Fluor-594 fluorescence of a patched transfected neuron). D, Sparse deletion of neuroligins in a small subset of neurons does not decrease the spine density, as quantified with Alexa Fluor-594 fluorescence. Left and center, Representative images of Alexa Fluor-594-filled neurons (for better visualization, boxed dendritic sections are expanded on the right of each neuron), sparsely transfected with ΔCre vs Cre-expressing vectors; right, summary graphs of the spine density. All summary data are the reported as the mean ± SEM; numbers of fields/independent cultures analyzed are shown in bars. No significant differences (p > 0.05, unpaired, one-tailed t test) were detected between ΔCre vs Cre conditions in any of the experiments.
Figure 5.
Figure 5.
Extended deletion of NL123 for 4 weeks causes only minor change in synapse numbers. A, Representative images (areas identified with a white frame are enlarged on the right for each image) and summary graphs of the density (left) and size (right) of synaptic puncta of hippocampal neurons that were cultured from NL123 triple cKO mice, infected at DIV3 with lentiviruses expressing ΔCre (control) or Cre, and immunostained at DIV28 for vGLUT1 (to label excitatory synapses), MAP2 (to visualize dendrites), and EGFP (to assess infection efficiency since the lentiviruses express Cre or ΔCre as EGFP fusion proteins). B, Same as A, except that neurons were stained for the inhibitory synapse marker vGAT instead of the excitatory synapse marker vGLUT1. Data are reported as the mean ± SEM; total number of fields/batches analyzed is indicated in the bars. Statistical significance was assessed using an unpaired, one-tailed t test (**p > 0.01; all other comparisons were p > 0.05).
Figure 6.
Figure 6.
Conditional loss of neuroligins does not affect the properties of presynaptic neurotransmitter release. A, Representative images (Pseudo colored) of dendritic sections from hippocampal neurons of NL123 triple cKO mice, when globally expressed ΔCre (top) or Cre (bottom) at DIV3 and live stained at DIV16 with antibody against the luminal domain of Syt1lum for 10 min in the presence of 50 mm KCl and 1.8 mm Ca2+ (left), and coimmunostained for Syn1 (middle) after fixation and permeabilization (signals merged, right). Insets are magnified views of the boxed areas (white) from merged images. B, Average graphs indicate the size (top left) and density (top right) of Syt1-positive actively recycling presynaptic boutons, and the colocalization of Syt1-labeled active synapses with Syn1-positive presynaptic terminals (bottom left) or the colocalization of Syn1-positive presynaptic puncta with Syt1-positive terminals (bottom right). Colocalizations are measures of normalized Mander's coefficients for respective correlations of immunofluorescence signals from ΔCre (black) vs Cre (brown) conditions. C, Experimental strategy (left) to directly monitor presynaptic vesicle release in primary hippocampal neurons derived from NL123 triple cKO mice, which were globally infected at DIV3 with lentivirus-expressing EGFP-tagged ΔCre or Cre (asterisk), loaded with 5 μm FM1-43 dye for 90 s in the presence of 50 mm KCl and 3 mm Ca2+ at DIV14-16, and fluorescently labeled presynaptic boutons (arrowheads) on dendritic branches were visualized after a 10 min wash with dye-free media. The time-lapse images (right) represent FM1–43 signals from presynaptic terminals of NL123 triple cKO hippocampal neurons expressing ΔCre or Cre as indicated, before (pre stim., top two) and after exposure to 50 mm KCl in the presence of 3 mm Ca2+ (bottom three). D, Normalized average intensity of FM1-43 signals (left) from ΔCre (connected filled circles, black) vs Cre (connected filled circles, brown) expressing NL123 cKO neurons, before and after 50 mm KCl treatment (black bar). Data from individual cells were further fitted to a double-exponential function, and the summary graph (right) indicates the fast-decay component of FM1-43 signal intensity following 50 mm KCl exposure for ΔCre (black) and Cre (brown) conditions. E, Analysis of variability in AMPAR-mediated evoked EPSCs for NL123 cKO hippocampal neurons globally expressing ΔCre vs Cre. Example traces (left) show 10 consecutive trials (light shades) overlaid with average values (dark shades). Summary graph (right) depict coefficients of variation as an indirect measure of release probability. F, G, Representative traces (left) and summary graphs (right) of average PPRs (Δt = 100 ms) of NMDAR-mediated EPSCs (F) or IPSCs (G). H, Sample traces (left) and average amplitudes (right) of NMDAR-mediated evoked EPSCs during repetitive synaptic stimulation at 0.1 Hz from NL123 cKO neurons globally expressing ΔCre (black) or Cre (brown), before (Ctrl) and after bath application of 10 μm MK-801 (black bar), as normalized to trial 1 in MK-801. I, Summary graphs indicate fast (left) and slow (right) kinetic components for MK-801-dependent inhibition of NMDAR-mediated evoked EPSC amplitudes, when fitted with a double-exponential function. J–L, Same as E–G, except for NL123 triple cKO hippocampal neurons sparsely transfected with plasmids encoding ΔCre or Cre, as indicated. All average data are reported as the mean ± SEM; corresponding numbers of fields imaged (for A and B), synaptic terminals analyzed (for C and D), or cells patched (E–L) per independent experimental batches are indicated. No significant difference (p > 0.05, unpaired, one-tailed t test) between ΔCre and Cre conditions was detected for any of the experiments.
Figure 7.
Figure 7.
Global triple NL123 cKO decreases the synaptic and surface localizations of postsynaptic receptors. A, Representative images (Pseudo colored) from dendritic branches of hippocampal neurons that were cultured from NL123 triple cKO mice and infected with lentiviruses expressing ΔCre (top) or Cre (bottom) at DIV3 and immunostained for surface AMPARs (GluA2 staining, left) and excitatory synapses (vGLUT1 staining, center) at DIV16 (merged views, right). B, Summary graphs represent the size (top left) and density (top right) of GluA2-positive synaptic puncta, as well as the colocalization of GluA2 receptors with vGlut1-positive presynaptic terminals (bottom left) or the colocalization of vGlut1-positive presynaptic terminals with GluA2 receptor-positive puncta (bottom right). In these analyses, colocalizations are measured as normalized Mander's coefficients for respective correlations of immunofluorescence signals. C, Sample image of a hippocampal neuron from low-density culture, as cells were patched using a recording pipette (Rec.), and a second pipette (Puff) was used to pressure deliver the selective receptor agonist near two different dendritic processes (Position 1 and Position 2). D, Example traces (top) of postsynaptic currents from NL123 triple cKO neurons expressing ΔCre (black) vs Cre (brown), as induced by exogenous application of AMPA of varying concentrations (color shades) to selectively stimulate surface AMPARs in the presence of γDGG (1 mm, low-affinity competitive AMPAR antagonist), and summary graphs of the average peak amplitude (bottom left) and total charge transfer (bottom right) for dose-dependent AMPA-induced responses (AMPA conc.). For every cell, agonist-induced EPSCs were averaged for two to three different puff-pipette positions (see C). Summary data are fit with straight lines; for peak amplitude, slope = 1.22 ± 0.11 (for ΔCre, black) and 1.08 ± 0.1 (for Cre, brown); for total charge transfer, slope = 16.48 ± 1.86 (for ΔCre, black) and 11.21 ± 1.41 (for Cre, brown). E, Same as D, but for responses induced by puffs of GABA. Lines in summary graphs are fits with Hill equation (see legend to Fig. 1B); for peak amplitude, Pmax = 15.54 ± 5.04 nA (for ΔCre, black) and 13.1 ± 2.13 nA (for Cre, brown), n = 1.41 ± 0.83 (for ΔCre, black) and 1.85 ± 0.92 (for Cre, brown), and K1/2 = 435.65 ± 144 μm (for ΔCre, black) and 329.8 ± 51.6 μm (for Cre, brown); for total charge transfer, Pmax = 180 ± 108 nC (for ΔCre, black) and 130.43 ± 67.4 nC (for Cre, brown), n = 1.19 ± 0.6 (for ΔCre, black) and 1.35 ± 0.73 (for Cre, brown), and K1/2 = 804.47 ± 721 μm (for ΔCre, black) and 690.22 ± 479 μm (for Cre, brown). Data in bar graphs are reported as the mean ± SEM; numbers on the bars indicate total number of fields analyzed (for imaging) or cells recorded (for electrophysiology)/number of independent cultures, from each condition. Asterisks indicate significant differences between ΔCre and Cre conditions (*p < 0.05; ***p < 0.005; unpaired, one-tailed t test).
Figure 8.
Figure 8.
Acute conditional double cKO of neuroligins NL13 and of NL23 partially replicate the phenotype produced by conditional NL123 triple cKO in cultured hippocampal neurons. A, Sample traces of AMPAR-mediated mEPSCs (left) recorded from DIV 14 to DIV16 primary hippocampal neurons of NL13 double cKO animals, globally infected with lentivirus expressing ΔCre (top) or Cre (bottom) at DIV3. Bar graphs (mean ± SEM) represent the average amplitude (left) and frequency (right) of mEPSC events for ΔCre (black) vs Cre (blue) conditions. B, Same as A, except for GABAergic mIPSCs. C–E, Representative traces of evoked synaptic currents for AMPAR EPSCs (C) NMDAR EPSCs (D), and GABAAR IPSCs (E) recorded from ΔCre-expressing (black) vs Cre-expressing (blue) NL13 double cKO neurons. Corresponding bar graphs (mean ± SEM) indicate average amplitudes of evoked EPSCs/IPSCs for ΔCre vs Cre condition. F–J, Same as A–E, except cultures were derived from NL23 double cKO, and infected with ΔCre-expressing (black) or Cre-expressing (purple) lentivirus. Numbers on the bar graphs represent the total number of cells recorded/number of batches, for all experimental conditions. Significant differences between ΔCre and Cre conditions are indicated with asterisks (*p < 0.05; **p < 0.01; unpaired, one-tailed t test). ns, Not significant. (p > 0.05).
Figure 9.
Figure 9.
Individual neuroligins perform distinct roles in excitatory and inhibitory synaptic transmission in cultured hippocampal neurons. A, Representative traces of AMPAR-mediated mEPSC recordings (left) made from DIV14 to DIV16 primary hippocampal neurons of NL1 single cKO animals, globally infected with lentivirus expressing ΔCre (top) vs Cre-recombinase (bottom) at DIV3. Bar graphs indicate average mEPSC amplitude (left) and frequency (right) for ΔCre (black) vs Cre (green) conditions and presented as the mean ± SEM. B, Same as A, except for GABAAR-mediated mIPSC recordings. C–E, Representative traces of AMPAR-mediated (C) and NMDAR-mediated (D) evoked EPSCs or GABAAR-mediated evoked IPSCs (E), as recorded from DIV14 to DIV16 primary hippocampal neurons of NL1 cKO animals, globally infected with lentivirus expressing ΔCre (black) vs Cre (green) at DIV3. Corresponding bar graphs indicate average amplitudes of evoked EPSCs or IPSCs for ΔCre vs Cre condition, and values are represented as the mean ± SEM. F–J, Same as A–E, except NL2 single cKO cultures were infected with lentiviruses expressing ΔCre (black) vs Cre (red). K–O, Same as A–E, except NL3 single cKO cultures were infected with lentiviruses expressing ΔCre (black) vs Cre (cyan). For individual experimental condition, total number of cells recorded/total number of batches are indicated inside corresponding average bar graphs. Significant differences between ΔCre and Cre conditions are indicated with asterisks (*p < 0.05; **p < 0.01; ***p < 0.005; unpaired, one-tailed t test).
Figure 10.
Figure 10.
NL1 and NL3 differentially rescue different components of the triple KO phenotype. A, Schematic of domain structures for HA-tagged NL1 and NL3 proteins used, to analyze the effects of neuroligin overexpression in NL123 triple cKO neurons. B, Experimental protocol. Hippocampal neurons were cultured from newborn NL123 triple cKO mice, globally infected at DIV3 with lentivirus expressing either ΔCre or Cre, sparsely cotransfected at DIV8 with plasmids encoding mVenus alone (control) or mVenus together with HA-tagged versions of NL1 or NL3, and analyzed at DIV14-16. C, D, Representative traces (C) and average amplitudes (D) of AMPAR-mediated evoked EPSCs, recorded from neurons treated with the manipulations described in B. E, F, Same as C and D, but for NMDAR-mediated evoked EPSCs. G, Sample images of dendrites from neurons that were treated with the manipulations described in B, and analyzed by imaging for the transfected mVenus and for immunostained HA neuroligins and synapsin (top panels, ΔCre control samples; bottom panels, Cre samples); merged views of all signals are shown at the bottom of each panel. H, Summary graphs of spine numbers (top) and synaptic puncta (bottom) as a function of neuroligin overexpression in transfected NL123 triple cKO neurons expressing ΔCre (black) vs Cre (brown), as quantified by mVenus-fluorescence or Synapsin staining, respectively. All summary graphs show the mean ± SEMs; numbers in bars indicate the number of cells patched (for electrophysiology) or dendritic sections analyzed (for imaging)/independent cultures. Statistical comparisons were made by one-way ANOVA with post hoc Tukey's test (*p < 0.05; **p < 0.01; ***p < 0.005).
Figure 11.
Figure 11.
Global vs sparse conditional deletion of NL123 during synaptic development of cultured cortical neurons. A, B, Sample images (A) demonstrating gradual development of neurite arborization from DIV4 to DIV16 (left to right) in primary cortical culture and representative dendritic sections (B) of cortical neurons from DIV4 to DIV16, when coimmunostained for Map2 (red signal) and Synapsin (green signal), indicate gradual increase in synaptic specifications, as quantified (bottom right) by the average values (n = 20/DIV, mean ± SEM) of Synapsin area/Map2 area. Data are fit using Hill equation (line) with Hill parameters Pmax = 0.81 ± 0.13, n = 2.7 ± 0.77, and K1/2 = 10.53 ± 1.12 d. C, Representative images (left) of primary cortical neurons derived from NL123 triple cKO animals, when infected at DIV3 with lentiviruses expressing ΔCre-EGFP or Cre-EGFP, and analyzed at DIV14-16 for infection efficiency (right, mean ± SEM, n = 3 independent cultures), using nuclear EGFP signal. D, Same as C, except for Ca2+ phosphate-mediated sparse transfection (arrowheads) of cultured cortical neurons.
Figure 12.
Figure 12.
Acute cKO of neuroligins impairs synaptic transmission in cultured cortical neurons similar to hippocampal neurons. A, B, Spontaneous mEPSCs (A) and mIPSCs (B) recorded at DIV14-16 from NL123 triple cKO primary cortical cultures, which were globally infected with lentivirus expressing ΔCre (black) or Cre (brown) at DIV3. Left, Representative traces; right, summary graphs (mean ± SEM) of the mEPSC/mIPSC amplitudes and frequency. C, Representative traces (left) and average peak amplitudes (right, mean ± SEM) of AMPAR-mediated evoked EPSCs recorded from DIV14-16 cortical neurons expressing ΔCre (black) or Cre (brown), through lentivirus-mediated global infection at DIV3. D, E, Same as C, except for NMDAR-mediated evoked EPSCs (D) or GABAAR-mediated evoked IPSCs (E). F–J, Same as A–E, except for calcium phosphate-mediated sparse transfection (ΔCre in black, and Cre in cyan) at DIV3. For all experiments, total number of cells recorded/independent batches is indicated on bar graphs. Statistical significance between ΔCre vs Cre conditions were assessed using unpaired, one-tailed t test (ns, p > 0.05; *p < 0.05; **p < 0.01; ***p < 0.005).
Figure 13.
Figure 13.
Acute NL123 cKO in cultured cortical neurons does not impair synaptogenesis. A, Conditional deletion of neuroligins does not alter excitatory synapse size and density in cortical neurons cultured from NL123 triple cKO mice (left, representative images; right, quantifications of synaptic puncta). Neurons were infected with lentiviruses expressing EGFP-fused ΔCre (top images) or Cre (bottom images) and immunostained for EGFP, MAP2, and vGLUT1 as indicated (“merged” images show the superimposed EGFP, MAP2, and vGlut1 immunofluorescence signals). The boxed area in the merged representative image is expanded in the right image. Summary graphs show average vGLUT1-positive synaptic puncta density (top) or size (bottom). B, Same as A, except for inhibitory synapses with neurons that were stained for vGAT instead of vGLUT1. C, Experimental strategy to quantify spine density of cortical neurons cultured from NL123 triple cKO mice, which were sparsely transfected at DIV3 with plasmids expressing ΔCre or Cre, and patched at DIV14-16 with a recording pipette (Rec.) containing the fluorescent dye Alexa Fluor-594. Left, Bright-field image (white and black arrowheads indicate transfected and nontransfected cells, respectively). Center, EGFP fluorescence of transfected cells expressing nuclear Cre- or ΔCre-EGFP fusion proteins. Right, Alexa Fluor-594 fluorescence of a patched transfected cell. D, Conditional deletion of neuroligins does not alter postsynaptic spine density of cortical neurons, as measured with Alexa Fluor-594 fluorescence. Left and center, Sample images of Alexa Fluor-594-infused neurons (boxed dendritic sections are expanded on the right for each cell), sparsely transfected with ΔCre vs Cre-expressing vectors. Right, Summary graphs depict spine densities from corresponding conditions. Bar graphs show mean ± SEM, with the number of imaging fields (for global manipulations) or neurons (for sparse manipulations)/independent cultures analyzed depicted in the bars. No significant differences (p > 0.05, unpaired, one-tailed t test) were observed between ΔCre vs Cre conditions for any of the quantifications shown.
Figure 14.
Figure 14.
Long-term absence of neuroligins causes no change in synapse numbers for cultured cortical neurons. A, Sample images (left) with corresponding boxed areas (white) enlarged for better visualization, and summary graphs (right) representing the density and size of synaptic puncta of cortical neurons from NL123 triple cKO mice, when infected at DIV3 with lentiviruses expressing ΔCre (control) vs Cre, and immunostained at DIV28 for vGLUT1 (to label excitatory synapses), MAP2 (to visualize dendrites), and EGFP (to assess infection efficiency since the lentiviruses express Cre or ΔCre as EGFP-fusion proteins). B, Same as A, except for neurons stained for the inhibitory synapse marker vGAT instead of the excitatory synapse marker vGLUT1. Data are the mean ± SEM; total number of imaging fields/independent experiments is indicated with corresponding average values. Statistical significance was tested using unpaired, one-tailed t test (for all comparisons, p > 0.05).

Comment in

Similar articles

Cited by

References

    1. Araç D, Boucard AA, Ozkan E, Strop P, Newell E, Südhof TC, Brunger AT (2007) Structures of neuroligin-1 and the neuroligin-1/neurexin-1 beta complex reveal specific protein-protein and protein-Ca2+ interactions. Neuron 56:992–1003. 10.1016/j.neuron.2007.12.002 - DOI - PubMed
    1. Bacaj T, Ahmad M, Jurado S, Malenka RC, Südhof TC (2015) Synaptic function of Rab11Fip5: selective requirement for hippocampal long-term depression. J Neurosci 35:7460–7474. 10.1523/JNEUROSCI.1581-14.2015 - DOI - PMC - PubMed
    1. Banovic D, Khorramshahi O, Owald D, Wichmann C, Riedt T, Fouquet W, Tian R, Sigrist SJ, Aberle H (2010) Drosophila neuroligin 1 promotes growth and postsynaptic differentiation at glutamatergic neuromuscular junctions. Neuron 66:724–738. 10.1016/j.neuron.2010.05.020 - DOI - PubMed
    1. Bekkers JM, Stevens CF (1990) Presynaptic mechanism for long-term potentiation in the hippocampus. Nature 346:724–729. 10.1038/346724a0 - DOI - PubMed
    1. Blundell J, Blaiss CA, Etherton MR, Espinosa F, Tabuchi K, Walz C, Bolliger MF, Südhof TC, Powell CM (2010) Neuroligin-1 deletion results in impaired spatial memory and increased repetitive behavior. J Neurosci 30:2115–2129. 10.1523/JNEUROSCI.4517-09.2010 - DOI - PMC - PubMed

Publication types

LinkOut - more resources